2010 NAU GSR (PDF)
File information
This PDF 1.3 document has been sent on pdf-archive.com on 23/12/2010 at 04:53, from IP address 75.5.x.x.
The current document download page has been viewed 1017 times.
File size: 14.27 KB (5 pages).
Privacy: public file


File preview
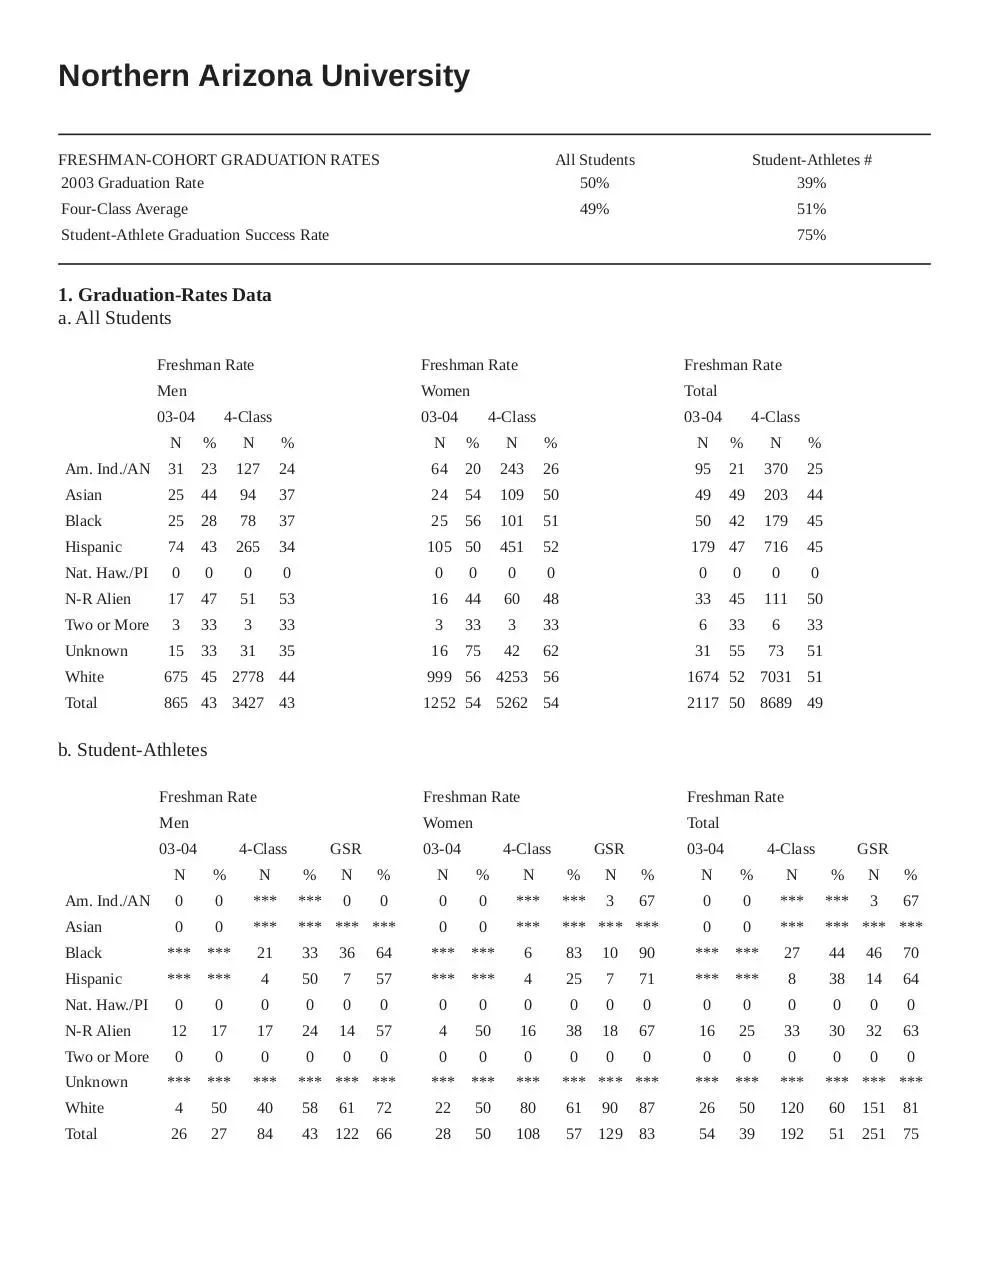
Northern Arizona University
FRESHMAN-COHORT GRADUATION RATES
2003 Graduation Rate
All Students
50%
Student-Athletes #
39%
49%
51%
Four-Class Average
Student-Athlete Graduation Success Rate
75%
1. Graduation-Rates Data
a. All Students
Freshman Rate
Freshman Rate
Freshman Rate
Men
Women
Total
03-04
4-Class
03-04
4-Class
03-04
4-Class
N
%
N
%
N
%
N
%
N
%
N
%
Am. Ind./AN
31
23
127
24
64
20
243
26
95
21
370
25
Asian
25
44
94
37
24
54
109
50
49
49
203
44
Black
25
28
78
37
25
56
101
51
50
42
179
45
Hispanic
74
43
265
34
105 50
451
52
179 47
716
45
Nat. Haw./PI
0
0
0
0
0
0
0
0
0
0
0
0
N-R Alien
17
47
51
53
16
44
60
48
33
45
111
50
Two or More
3
33
3
33
3
33
3
33
6
33
6
33
Unknown
15
33
31
35
16
75
42
62
31
55
73
51
White
675 45 2778 44
999 56 4253 56
1674 52 7031 51
Total
865 43 3427 43
1252 54 5262 54
2117 50 8689 49
Freshman Rate
Freshman Rate
Freshman Rate
Men
Women
Total
b. Student-Athletes
03-04
4-Class
GSR
03-04
4-Class
GSR
03-04
4-Class
GSR
N
%
N
%
N
%
N
%
N
%
N
%
N
%
N
%
N
%
Am. Ind./AN
0
0
***
***
0
0
0
0
***
***
3
67
0
0
***
***
3
67
Asian
0
0
***
*** *** ***
0
0
***
*** *** ***
0
0
***
*** *** ***
Black
*** ***
21
33
36
64
*** ***
6
83
10
90
*** ***
27
44
46
70
Hispanic
*** ***
4
50
7
57
*** ***
4
25
7
71
*** ***
8
38
14
64
Nat. Haw./PI
0
0
0
0
0
0
0
0
0
0
0
0
0
0
0
0
0
0
N-R Alien
12
17
17
24
14
57
4
50
16
38
18
67
16
25
33
30
32
63
Two or More
0
0
0
0
0
0
0
0
0
0
0
0
0
0
0
0
0
0
Unknown
*** ***
***
*** *** ***
*** ***
***
*** *** ***
*** ***
***
*** *** ***
White
4
50
40
58
61
72
22
50
80
61
90
87
26
50
120
60
151
81
Total
26
27
84
43
122
66
28
50
108
57
129
83
54
39
192
51
251
75
c. Student-Athletes by Sport Category
Baseball
Men's Basketball
Men's CC/Track
Freshman Rate
Freshman Rate
Freshman Rate
2003 4-Class GSR
2003 4-Class GSR
2003 4-Class GSR
Am. Ind./AN
-
-
-
Am. Ind./AN
-
-
-
Asian
-
-
-
Asian
-
-
-
Black
0-a
0-a
75-a
Black
-
0-a
50-a
Hispanic
-
-
-
Hispanic
-
-
0-a
Nat. Haw./PI
-
-
-
Nat. Haw./PI
-
-
-
N-R Alien
-
-
0-a
50-a
60-a
71-b
Two or More
-
-
-
Two or More
-
-
-
Unknown
-
-
-
Unknown
-
-
-
White
0-a
50-b
63-b
White
-
54-c
69-c
Total
0-a
38-b
67-c
Total
50-a
50-d
65-e
Football
Men's Other
Freshman Rate
Freshman Rate
2003 4-Class GSR
2003 4-Class GSR
Am. Ind./AN
-
-
-
Am. Ind./AN
-
-
-
Asian
-
0-a
33-a
Asian
-
-
-
Black
29-b
41-d
63-e
Black
-
-
-
Hispanic
100-a
67-a
67-b
Hispanic
-
0-a
0-a
-
-
-
Nat. Haw./PI
-
-
-
11-b
11-b
25-a
0-a
0-a
67-a
-
-
-
Two or More
-
-
-
Unknown
0-a
0-a
100-a
Unknown
-
-
-
White
67-a
62-e
74-e
White
-
-
100-a
Total
29-e
44-e
66-e
Total
0-a
0-a
80-a
Nat. Haw./PI
N-R Alien
Two or More
N-R Alien
Women's Basketball
Women's CC/Track
Women's Other
Freshman Rate
Freshman Rate
Freshman Rate
2003
4-Class
GSR
2003
4-Class
GSR
Am. Ind./AN
-
0-a
50-a
Am. Ind./AN
-
-
0-a
Asian
-
-
-
Asian
-
-
Black
100-a
75-a
75-a
Black
-
0-a
0-a
0-a
Hispanic
Nat. Haw./PI
-
-
-
N-R Alien
-
100-a
100-a
Two or More
-
-
Unknown
-
White
Total
Hispanic
N-R Alien
2003
4-Class
GSR
Am. Ind./AN
-
100-a
100-a
-
Asian
-
-
100-a
100-a
100-b
Black
-
-
-
-
-
100-a
Hispanic
-
33-a
75-a
Nat. Haw./PI
-
-
-
Nat. Haw./PI
-
-
-
N-R Alien
-
25-a
57-b
50-a
36-c
67-b
-
Two or More
-
-
-
Two or More
-
-
-
-
-
Unknown
-
-
-
Unknown
-
-
0-a
100-a
56-b
89-b
White
0-a
44-b
93-c
White
47-d
65-e
85-e
80-a
60-c
81-d
Total
0-a
44-d
84-e
Total
48-e
60-e
83-e
Values for N (a. 1-5, b. 6-10, c. 11-15, d. 16-20, e. greater than 20)
N-R Alien
2. Undergraduate-Enrollment Data (All full-time students enrolled Fall 2009-10)
a. All Students
Women
N
519
Total
N
793
b. Student-athletes
Am. Ind./AN
Men
N
274
Asian
166
225
391
Black
228
277
Hispanic
727
Nat. Haw./PI
24
N-R Alien
Two or More
Unknown
Men
N
1
Women
N
1
Total
N
2
Asian
1
4
5
505
Black
27
6
33
1282
2009
Hispanic
10
2
12
16
40
Nat. Haw./PI
2
0
2
192
195
387
N-R Alien
6
15
21
68
109
177
Two or More
3
0
3
Am. Ind./AN
84
107
191
Unknown
0
2
2
White
4597
6280
10877
White
42
35
77
Total
6360
9010
15370
Total
92
65
157
c. Student-Athletes # By Sports Category
Men
Basketball
0
Baseball
0
CC/Track
1
Football
0
Other
0
Asian
0
0
0
1
0
Black
6
0
4
17
0
Hispanic
1
0
0
9
0
Nat. Haw./PI
0
0
0
2
0
N-R Alien
0
0
5
1
0
Two or More
0
0
0
3
0
Unknown
0
0
0
0
0
White
4
0
5
32
1
Total
11
0
15
65
1
Am. Ind./AN
Women
Basketball
0
CC/Track
0
Other
1
Asian
0
0
4
Black
4
2
0
Hispanic
0
0
2
Nat. Haw./PI
0
0
0
N-R Alien
0
4
11
Two or More
0
0
0
Unknown
0
0
2
White
9
4
22
Total
13
10
42
Am. Ind./AN
#Only student-athletes receiving athletics aid are included in this report.
Information about the Graduation Rates Report
Introduction.
This information sheet and the 2010 NCAA Graduation Rates Report have been prepared by the NCAA, based
on data provided by the institution in compliance with NCAA Bylaw 18.4.2.2.1 (admissions and graduation-rate
disclosure) and the Federal Student Right-to-Know and Campus Security Act. Each NCAA Division I college or
university is required to distribute this sheet and the report to prospective student-athletes and parents, as
specified in Bylaw 13.3.1.2 (report distribution).
The graduation rates report provides information about two groups of students at the college or university
identified at the top of the form: (1) all undergraduate students who were enrolled in a full-time program of
studies for a degree, and (2) student-athletes who received athletics aid from the college or university for any
period of time during their entering year. [Note: Athletics aid is a grant, scholarship, tuition waiver or other
assistance from a college or university that is awarded on the basis of a student's athletics ability.]
The report gives graduation information about students and student-athletes entering in 2003. This is the most
recent graduating class for which the required six years of information is available. The report provides
information about student-athletes who received athletics aid in one or more of eight sports categories: football,
men's basketball, baseball, men's track/cross country, men's other sports and mixed sports, women's basketball,
women's track/cross country, and other women's sports. For each of those sports categories, it includes
information in six self-reported racial or ethnic groups: American Indian or Alaska Native, Asian, Black or
African-American, Hispanic or Latino, Native Hawaiian or Pacific Islander, Non-Resident Alien, Two or More
Races, White or Non-Hispanic and Unknown (not included in one of the other eight groups or not available) and
the total (all nine groups combined).
A graduation rate (percent) is based on a comparison of the number (N) of students who entered a college or
university and the number of those who graduated within six years. For example, if 100 students entered and 60
graduated within six years, the graduation rate is 60 percent. It is important to note that graduation rates are
affected by a number of factors: some students may work part time and need more than six years to graduate,
some may leave school for a year or two to work or travel, some may transfer to another college or university or
some may be dismissed for academic deficiencies.
Two different measures of graduation rates are presented in this report: (1) freshman-cohort rate, and (2)
Graduation Success Rate (GSR). The freshman-cohort rate indicates the percentage of freshmen who entered
during a given academic year and graduated within six years. The GSR adds to the first-time freshmen, those
students who entered midyear, as well as student-athletes who transferred into an institution. In addition, the
GSR will subtract students from the entering cohort who are considered allowable exclusions (those who either
die or become permanently disabled, those who leave the school to join the armed forces, foreign services or
attend a church mission), as well as those who would have been academically eligible to compete had they
returned to the institution.
Graduation Rates Report.
1. Graduation Rates Data. The box at the top of the graduation rates report provides freshman-cohort graduation
rates for all students and for student-athletes who received athletics aid at this college or university.
Additionally, this box provides GSR data for the population of student-athletes. [Note: Pursuant to the StudentRight-to-Know Act, anytime a cell containing cohort numbers includes only one or two students, the data in that
cell and one other will be suppressed so that no individual can be identified.]
a. All Students. This section provides the freshman-cohort graduation rates for all full-time, degree-seeking
students by race or ethnic group. It shows the rate for men who entered as freshmen in 2003-04, and the fourclass average, which includes those who entered as freshmen 2000-01, 2001-02, 2002-03 and 2003-04. The
same rates are provided for women. The total for 2003-04 is the rate for men and women combined, and the
four-class average is for all students who entered in 2000-01, 2001-02, 2002-03 and 2003-04.
b. Student-Athletes. This section provides the freshman-cohort graduation rates and also the GSRs for studentathletes in each race and ethnic group who received athletics aid. Information is provided for men and women
separately and for all student-athletes.
c. Student-Athletes by Sports Categories. This section provides the identified graduation rates as in 1-b for each
of the eight sports categories. (The small letters indicate the value of N.)
2. Undergraduate Enrollment Data.
a. All Students. This section indicates the number of full-time, undergraduate, degree-seeking students enrolled
for the 2009 fall term and the number of men and women in each racial or ethnic group.
b. Student-Athletes. This section identifies how many student-athletes were enrolled for the 2009 fall term and
the number of men and women in each racial or ethnic group.
c. Student-Athletes by Sports Categories. This section provides the enrollment data as identified in 3-b for each
of the eight sports categories.
Download 2010 NAU GSR
2010_NAU_GSR.pdf (PDF, 14.27 KB)
Download PDF
Share this file on social networks
Link to this page
Permanent link
Use the permanent link to the download page to share your document on Facebook, Twitter, LinkedIn, or directly with a contact by e-Mail, Messenger, Whatsapp, Line..
Short link
Use the short link to share your document on Twitter or by text message (SMS)
HTML Code
Copy the following HTML code to share your document on a Website or Blog
QR Code to this page

This file has been shared publicly by a user of PDF Archive.
Document ID: 0000027669.