05633842 (PDF)
File information
Title: Web Structural Metrics Evaluation
Author: Izzat Alsmadi, Ahmad T. Al-Taani, Nahed Abu Zaid
This PDF 1.4 document has been sent on pdf-archive.com on 08/09/2011 at 09:27, from IP address 94.249.x.x.
The current document download page has been viewed 1198 times.
File size: 209.91 KB (6 pages).
Privacy: public file


File preview
2010 Developments in E-systems Engineering
Web Structural Metrics Evaluation
Izzat Alsmadi, Ahmad T. Al-Taani, and Nahed Abu Zaid
Faculty of Information Technology and Computer Science
Yarmouk University, Jordan
Abstract
Evaluating websites characteristics can take several
methods. Some of those methods depend on users while
others depend on the websites themselves. There are
many software tools and related websites that measure
websites attributes such as vulnerability, performance,
navigability, structure, etc. This work focuses on studying
website structural and related metrics that can be used as
indicators of the complexity of the websites. Websites
structural metrics can be also used to predict
maintainability requirements. Examples of some
structural metrics evaluated in this study include: size,
complexity, and speed of page loading. While results
showed that structural metrics are not good indicators for
the popularity of the website, they may affect indirectly on
the popularity through their effect on the performance or
the usability of those websites. A tool is developed to
collect navigability inlink and outlink metrics. We
implemented several preprocessing steps to improve the
performance of the developed tool in comparison to other
navigability metrics or tools. Although it is not always
true, however, a popular website needs to have a high
inlink or backlink number where it indicates that such
website is known by many users or other websites. On the
other hand, outlinks give us indications of the structure of
the website and do not necessary mean less or more
popular website.
Key Words: Web Metrics, Testing, Websites
Complexity, Navigability.
1. Introduction
Evaluators of software applications and websites
strive to make sure that their software is up to the quality
standards relative to others. They used metric tools and
methods to be able to get the software characteristics and
compare them with other software applications or with
standards. In order to make the approach plausible, those
attributes should be gathered automatically through tools.
Web applications have some characteristics that make
their
maintenance
expensive.
This
includes:
heterogeneity, speed of evolution, and dynamic code
generation [2].
978-0-7695-4160-0/10 $26.00 © 2010 IEEE
DOI 10.1109/DeSE.2010.43
Characteristics of every software or website can be
classified into wide range of types. For example, there are
several characteristics that are related to performance
such as websites processing speed, and the speed of
executing transactions, reliability related characteristics
such as number of errors in pages, in scripts, etc,
characteristics related to usability such as number of
distribution of objects, colors, etc, and many other
characteristics. In some cases, some of those
characteristics may not be fully measured unless the
website is operational. For example, operational quality
results from four characteristics: effectiveness,
productivity, safety, and satisfaction. These can only be
measured during the operating environment of the
software.
Software or website attributes can be also classified
into two major types: internal and external attributes.
Internal attributes are those characteristics that we can
directly measure while external attributes are those we
like to measure or know. Internal attributes can be used to
help us know the external one. However, usually the
relation is not simple and direct between internal and
external attributes. For example, the number of links in a
web page is a size internal metric that we can directly
measure. Such internal metric has relation with several
external metrics such as size, complexity, quality, etc.
Software quality attribute on the other hand, is a very
complex attribute itself that is usually used to refer to the
overall characteristics of the software and its ability to
meet users’ needs or requirements.
(ISO/IEC-9126-1, 2001) defines 6 major quality
characteristics. Those are: functionality, reliability,
usability, efficiency, maintainability, and portability. The
ISO/IEC quality model describes each quality
characteristic of a software product by further subcharacteristics that elaborate each characteristic. The
GQM approach provides a three-step framework: (1) list
the major goals of the empirical study; (2) derive from
each goal the questions that must be answered to
determine if the goals have been met; (3) decide what
must be measured in order to be able to answer the
questions adequately (definition of the metrics).
There are several metrics that distinguish websites
evaluation from typical software evaluation. In typical
software applications, for example, traffic and usage
metrics may not be as much as important as they are in
225
websites evaluations. We are always interested to study
the behavior of users for online applications. They can
give us indirect indication for the quality of the website
from users’ perspective. Users’ behavior can be studied
through eye tracking, log files, studying users’ sessions,
etc. However, one of the challenges in this evaluation is
that there are some inconsistent factors that can be hardly
assist through a metric for the user behavior such as
loyalty, satisfaction, understandability, etc.
Usability, ease of use, user-friendliness, and ease of
learning is a set of related metrics to indicate the ability of
the user to communicate easily with the website and
understand its functionalities with minimum effort. It can
be measured through different ways such as the time it
takes a user to perform a task or different tasks using the
website (usually in comparison with other websites). It
can be also measured indirectly through studying the user
interface of the website, its consistency through the
different pages and its consistency with user interface
design standards. It can be also measured through
studying the ability of the user to get help through the
website in a convenient dynamic way or in the response
of the website to users’ mistakes and the website ability to
handle such errors without losing data or forcing the users
to restart their process completely. It can be also
measured through understandability and the user ease of
remembering of how to operate on website functionalities
and to recall this knowledge when using the website
repeatedly.
There are many quality metrics that are related to
usability with different levels of closeness or distance
from usability. Examples of those metrics include: learnability,
effectiveness,
efficiency,
memorability,
satisfaction, attitude, error related metrics, flexibility and
many others.
Productivity metrics try to evaluate the amount of
resources consumed through using the website such as
time, memory, and relate it to the level of effectiveness
gained by the user. Indicators of productivity can include:
time needed to complete a task, the parts of the goals
reached within a unit of time, cost-effectiveness of tasks,
and the amount of time it takes the user to perform certain
actions.
Users should be able to understand websites contents.
Websites should be transparent stating clearly the
organization of the website, its responsibilities, and goals.
Websites should be always screened, maintained and
updated. The dynamic life of most websites change
frequently which makes it necessary to ensure that the
website is updated and has no broken links, unreachable
pages, mistakes, etc.
2. Related Work
The evaluation of websites or web analytics can take
several forms and natures. Several research projects focus
on user manual evaluation of websites especially in some
metrics where tools or automation will not be easy or
possible. Research of web sites evaluation and metrics
spans the spectrum of the different possible metrics or
characteristics to measure. In most cases, tools are used to
gather the website characteristics. Those characteristics
can be static collected without the need to have the
website live or dynamic to measure or collect those
metrics while the website is running.
Basili et al. [1] suggested a Goal Question Metric
(GQM) approach to improve maintainability. First, the
goals must be defined. A set of questions are set and their
answers will show whether the goal is met or not. Later
one metrics are defined to gather quantitative data which
give answers to the previously defined question.
Ghosheh et al. [2] proposed an elementary study for
few maintainability design metrics of web applications
from class diagrams. The metrics collected were: size,
complexity, coupling and reusability. Many people,
earlier such as Conallen, tried to model web applications
based on UML [15].
Alagappan et al. [3] studied websites usability and
performance through the utilities availability and websites
visual appearance. They studied websites contents,
domains, and navigability and their impact on websites
usability. They studied some website-user related metrics
such as traffic analysis in terms of number of hits and
users’ behavior.
Mendes et al. [4] proposed a prediction model for
estimating design and authoring effort in website
applications. The study was based on a student class who
were taught and given an assignment for building a
website after gaining similar training. Websites attributes
along with development time were studied looking for
correlations.
Dhawan et al focused on evaluating hypermedia
applications of websites in terms of reliability, usability,
maintainability and effort estimation [5]. Pascual used
data mining and visualization to analyze and study web
data [6]. He developed and used a web mining tool called
WET.
Soltz et al introduced an efficiency metric (called
Guidance Performance Indicator, GPI) that tried to
evaluate the degree in which a goal driven website meets
its goals in terms of user acceptance [7]. This is
accomplished through modeling desired user behavior
patterns.
There are several other related papers for this subject.
Examples of such other papers include [8,
9,10,11,12,13,14,15, and 16]. The focus on those papers
is in selecting one or more particular metric to propose or
evaluate. Examples of some of the metrics that get more
focus than others include: usability, navigability,
226
accessibility, performance. Similarly, our paper focuses
on structural metrics of websites. Those are the metrics
that are related to the structure of the websites, the
number and the size of its components such as: pages,
images, forms, etc.
Calculating the number of documents in a website
focused on certain types of files such as: pdf, doc, docx,
and xls. HTML file types are excluded from document
file selections.
3. Goals and Approaches
3.2. Experiments and Evaluation
3.1. Data and Limitations
The data used in this study is collected from several
different websites that represent different domains. Those
domains include: universities, banks, government
websites, and search engines. The websites are also
intentionally selected from different countries.
A crawler tool is developed locally to crawl all pages
of the websites under the study. However, the tool will
skip any links or pages that require special authorization
or authentication. A timeout is also set to wait for a
reasonable time for any webpage or object and then will
skip the page or the object if it wasn’t reachable within
that time.
The developed tool will not be able to access any
locations in the website that require special login
credentials. This is a limitation and a constraint on this
tool that will not make collected numbers accurate.
However, as this is applied to all websites, comparison of
those gathered metrics among the different websites can
be still relevant.
In order to measure the time to crawl every website in
a reasonable and consistent manner, all websites are
crawled using the same computer and Internet connection.
However, this was not possible to implement at the same
time or the same day as crawling processes usually take
hours and in some cases days. As many websites are
dynamic, especially search engines, crawling was taken
several times and the average for all times was selected.
An
open
source
tool
(i.e.
Watin,
watin.sourceforge.net) is used to automatic the process of
gathering websites’ metrics. The tool is capable of
gathering several website components. However, there
are some limitations on this collection such as its inability
to parse through special types of components such as
multimedia flash. Examples of some of the metrics that
are collected include: number of links in every page,
number of images, frames, elements, forms, buttons,
labels, etc. There are some other metrics that were added
and collected from all websites. Examples of metrics
added and implemented in the developed tool include:
time it takes to go through the website links and access
each element, the number of external and internal links
and the number of documents in each website. We
assumed that every link that share the URL name with the
entry page as an internal link. For example,
www.gmail.com is not considered as internal relative to
www.google.com while www.mail.yahoo.com is
considered internal relative to www.yahoo.com.
In order to evaluate the structural metrics of websites
and its impact on performance, websites under study are
selected from four categories: universities, banks,
government and search engine websites. To simplify
research experiments’ reports, websites are given short
names as u1, u2, etc for websites of universities, b1, b2,
etc for websites of banks, g1, g2, etc for websites of
governmental entities and s1, s2, etc for websites of
search engines. The metrics are collected from the
different websites on two levels: level one which collect
all metrics from the website homepage only, and level 2
which collect all metrics from the homepage and all pages
referenced by or linked with the homepage. Tables 1 and
2 show selected metrics gathered from all websites at
levels 1 and 2, respectively.
Table1: Structural Metrics at Websites Levels in the First
Level.
Website
U1
U2
U3
U4
U5
U6
B1
B2
B3
B4
G1
G2
S1
S2
Time to
5m:21sec
3m:58sec
7m:51sec
8m:54sec
3m:28sec
4m:10sec
3 sec
43 sec
40 sec
2 min
7m:49sec
6m:33sec
20 sec
9 min
No. of Pics
1270
1020
3648
8798
213
3009
72
480
210
1995
4200
3136
34
1720
No. of
95
56
59
60
69
37
9
7
29
10
56
45
33
156
No. of
1
0
0
1
0
2
0
0
0
0
20
5
0
0
Level 1 means collecting information from the home
page only. There is no standard structure of how best a
homepage should be. Some websites such as Google try
to simply the contents of the first page. Other search
engines such as Yahoo and MSN (i.e. S2 and S3) include
more components in the first page. The majority of the
selected websites do not hold references to many
documents in their main page. We considered only
specific file extensions to be considered as documents
(pdf, doc, docs, xls, and xlsx).
227
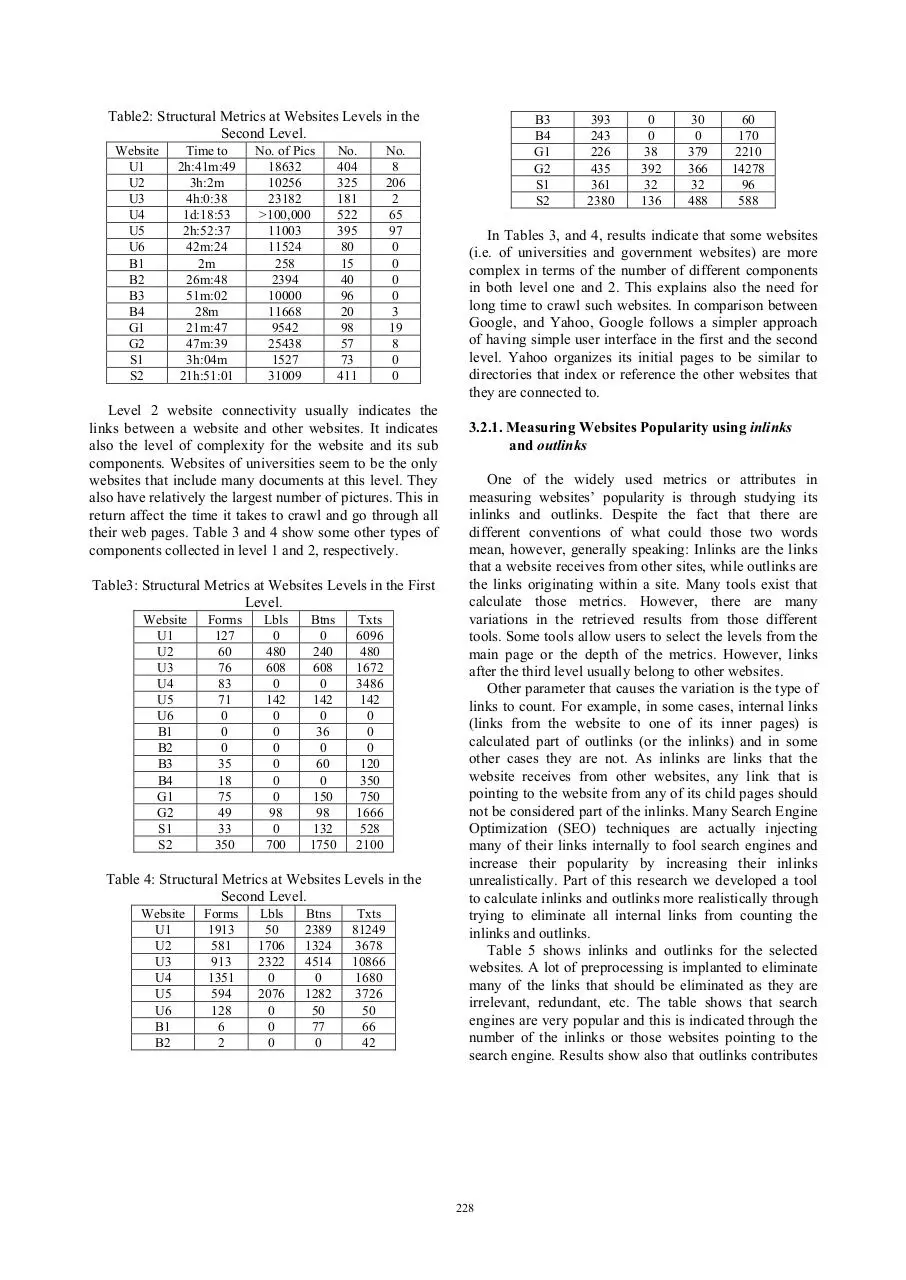
Table2: Structural Metrics at Websites Levels in the
Second Level.
Website
U1
U2
U3
U4
U5
U6
B1
B2
B3
B4
G1
G2
S1
S2
Time to
2h:41m:49
3h:2m
4h:0:38
1d:18:53
2h:52:37
42m:24
2m
26m:48
51m:02
28m
21m:47
47m:39
3h:04m
21h:51:01
No. of Pics
18632
10256
23182
>100,000
11003
11524
258
2394
10000
11668
9542
25438
1527
31009
No.
404
325
181
522
395
80
15
40
96
20
98
57
73
411
No.
8
206
2
65
97
0
0
0
0
3
19
8
0
0
Level 2 website connectivity usually indicates the
links between a website and other websites. It indicates
also the level of complexity for the website and its sub
components. Websites of universities seem to be the only
websites that include many documents at this level. They
also have relatively the largest number of pictures. This in
return affect the time it takes to crawl and go through all
their web pages. Table 3 and 4 show some other types of
components collected in level 1 and 2, respectively.
Table3: Structural Metrics at Websites Levels in the First
Level.
Website
U1
U2
U3
U4
U5
U6
B1
B2
B3
B4
G1
G2
S1
S2
Forms
127
60
76
83
71
0
0
0
35
18
75
49
33
350
Lbls
0
480
608
0
142
0
0
0
0
0
0
98
0
700
Btns
0
240
608
0
142
0
36
0
60
0
150
98
132
1750
Txts
6096
480
1672
3486
142
0
0
0
120
350
750
1666
528
2100
Table 4: Structural Metrics at Websites Levels in the
Second Level.
Website
U1
U2
U3
U4
U5
U6
B1
B2
Forms
1913
581
913
1351
594
128
6
2
Lbls
50
1706
2322
0
2076
0
0
0
Btns
2389
1324
4514
0
1282
50
77
0
Txts
81249
3678
10866
1680
3726
50
66
42
B3
B4
G1
G2
S1
S2
393
243
226
435
361
2380
0
0
38
392
32
136
30
0
379
366
32
488
60
170
2210
14278
96
588
In Tables 3, and 4, results indicate that some websites
(i.e. of universities and government websites) are more
complex in terms of the number of different components
in both level one and 2. This explains also the need for
long time to crawl such websites. In comparison between
Google, and Yahoo, Google follows a simpler approach
of having simple user interface in the first and the second
level. Yahoo organizes its initial pages to be similar to
directories that index or reference the other websites that
they are connected to.
3.2.1. Measuring Websites Popularity using inlinks
and outlinks
One of the widely used metrics or attributes in
measuring websites’ popularity is through studying its
inlinks and outlinks. Despite the fact that there are
different conventions of what could those two words
mean, however, generally speaking: Inlinks are the links
that a website receives from other sites, while outlinks are
the links originating within a site. Many tools exist that
calculate those metrics. However, there are many
variations in the retrieved results from those different
tools. Some tools allow users to select the levels from the
main page or the depth of the metrics. However, links
after the third level usually belong to other websites.
Other parameter that causes the variation is the type of
links to count. For example, in some cases, internal links
(links from the website to one of its inner pages) is
calculated part of outlinks (or the inlinks) and in some
other cases they are not. As inlinks are links that the
website receives from other websites, any link that is
pointing to the website from any of its child pages should
not be considered part of the inlinks. Many Search Engine
Optimization (SEO) techniques are actually injecting
many of their links internally to fool search engines and
increase their popularity by increasing their inlinks
unrealistically. Part of this research we developed a tool
to calculate inlinks and outlinks more realistically through
trying to eliminate all internal links from counting the
inlinks and outlinks.
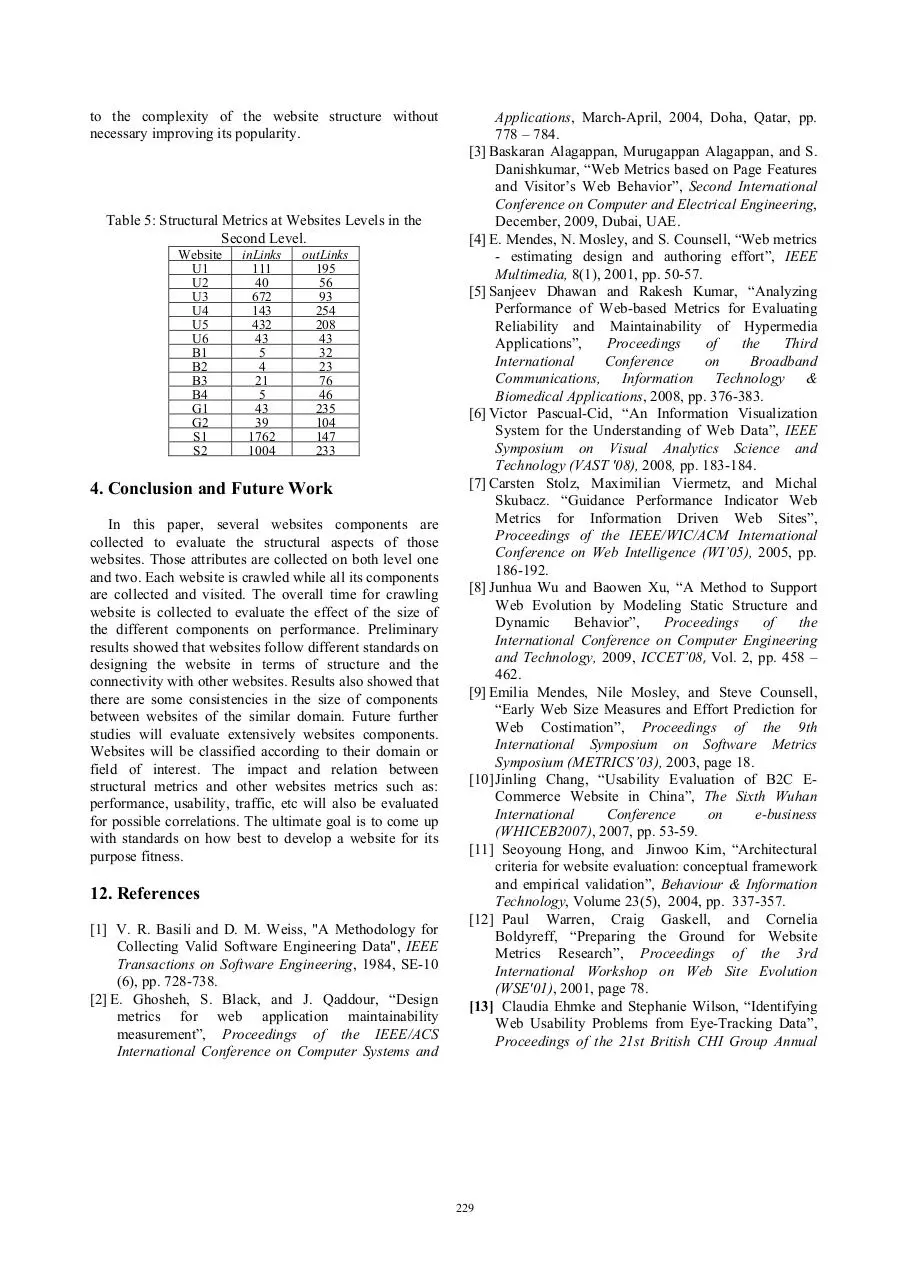
Table 5 shows inlinks and outlinks for the selected
websites. A lot of preprocessing is implanted to eliminate
many of the links that should be eliminated as they are
irrelevant, redundant, etc. The table shows that search
engines are very popular and this is indicated through the
number of the inlinks or those websites pointing to the
search engine. Results show also that outlinks contributes
228
to the complexity of the website structure without
necessary improving its popularity.
Table 5: Structural Metrics at Websites Levels in the
Second Level.
Website
U1
U2
U3
U4
U5
U6
B1
B2
B3
B4
G1
G2
S1
S2
inLinks
111
40
672
143
432
43
5
4
21
5
43
39
1762
1004
outLinks
195
56
93
254
208
43
32
23
76
46
235
104
147
233
4. Conclusion and Future Work
In this paper, several websites components are
collected to evaluate the structural aspects of those
websites. Those attributes are collected on both level one
and two. Each website is crawled while all its components
are collected and visited. The overall time for crawling
website is collected to evaluate the effect of the size of
the different components on performance. Preliminary
results showed that websites follow different standards on
designing the website in terms of structure and the
connectivity with other websites. Results also showed that
there are some consistencies in the size of components
between websites of the similar domain. Future further
studies will evaluate extensively websites components.
Websites will be classified according to their domain or
field of interest. The impact and relation between
structural metrics and other websites metrics such as:
performance, usability, traffic, etc will also be evaluated
for possible correlations. The ultimate goal is to come up
with standards on how best to develop a website for its
purpose fitness.
12. References
[1] V. R. Basili and D. M. Weiss, "A Methodology for
Collecting Valid Software Engineering Data", IEEE
Transactions on Software Engineering, 1984, SE-10
(6), pp. 728-738.
[2] E. Ghosheh, S. Black, and J. Qaddour, “Design
metrics for web application maintainability
measurement”, Proceedings of the IEEE/ACS
International Conference on Computer Systems and
Applications, March-April, 2004, Doha, Qatar, pp.
778 – 784.
[3] Baskaran Alagappan, Murugappan Alagappan, and S.
Danishkumar, “Web Metrics based on Page Features
and Visitor’s Web Behavior”, Second International
Conference on Computer and Electrical Engineering,
December, 2009, Dubai, UAE.
[4] E. Mendes, N. Mosley, and S. Counsell, “Web metrics
- estimating design and authoring effort”, IEEE
Multimedia, 8(1), 2001, pp. 50-57.
[5] Sanjeev Dhawan and Rakesh Kumar, “Analyzing
Performance of Web-based Metrics for Evaluating
Reliability and Maintainability of Hypermedia
Applications”,
Proceedings
of
the
Third
International
Conference
on
Broadband
Communications, Information Technology &
Biomedical Applications, 2008, pp. 376-383.
[6] Victor Pascual-Cid, “An Information Visualization
System for the Understanding of Web Data”, IEEE
Symposium on Visual Analytics Science and
Technology (VAST '08), 2008, pp. 183-184.
[7] Carsten Stolz, Maximilian Viermetz, and Michal
Skubacz. “Guidance Performance Indicator Web
Metrics for Information Driven Web Sites”,
Proceedings of the IEEE/WIC/ACM International
Conference on Web Intelligence (WI’05), 2005, pp.
186-192.
[8] Junhua Wu and Baowen Xu, “A Method to Support
Web Evolution by Modeling Static Structure and
Dynamic
Behavior”,
Proceedings
of
the
International Conference on Computer Engineering
and Technology, 2009, ICCET’08, Vol. 2, pp. 458 –
462.
[9] Emilia Mendes, Nile Mosley, and Steve Counsell,
“Early Web Size Measures and Effort Prediction for
Web Costimation”, Proceedings of the 9th
International Symposium on Software Metrics
Symposium (METRICS’03), 2003, page 18.
[10] Jinling Chang, “Usability Evaluation of B2C ECommerce Website in China”, The Sixth Wuhan
International
Conference
on
e-business
(WHICEB2007), 2007, pp. 53-59.
[11] Seoyoung Hong, and Jinwoo Kim, “Architectural
criteria for website evaluation: conceptual framework
and empirical validation”, Behaviour & Information
Technology, Volume 23(5), 2004, pp. 337-357.
[12] Paul Warren, Craig Gaskell, and Cornelia
Boldyreff, “Preparing the Ground for Website
Metrics Research”, Proceedings of the 3rd
International Workshop on Web Site Evolution
(WSE'01), 2001, page 78.
[13] Claudia Ehmke and Stephanie Wilson, “Identifying
Web Usability Problems from Eye-Tracking Data”,
Proceedings of the 21st British CHI Group Annual
229
Conference on HCI 2007: People and Computers
XXI: HCI, pp. 119-128.
[14] Chang Jinling and Xia Guoping, “Comprehensive
Evaluation of E-commerce Website Based on
Concordance Analysis”, Proceedings of the IEEE
International Conference on e-Business Engineering
(ICEBE’05), Beijing, China, October, 2005.
[15] J. Conallen, Building Web Applications with UML
(The Addison-Wesley Object Technology Series),
Addison Wesley, Second Edition, 2003.
[16] Yuming Zhou, Hareton Leung, and Pinata Winoto,
“MNav: A Markov Model-Based Web Site
Navigability Measure”, IEEE Transactions on
Software Engineering, 33(12), 2007, pp. 869 – 890.
230
Download 05633842
05633842.pdf (PDF, 209.91 KB)
Download PDF
Share this file on social networks
Link to this page
Permanent link
Use the permanent link to the download page to share your document on Facebook, Twitter, LinkedIn, or directly with a contact by e-Mail, Messenger, Whatsapp, Line..
Short link
Use the short link to share your document on Twitter or by text message (SMS)
HTML Code
Copy the following HTML code to share your document on a Website or Blog
QR Code to this page

This file has been shared publicly by a user of PDF Archive.
Document ID: 0000033547.