Reliability and Validity of Eye Movement Measures of Reading (PDF)
File information
This PDF 1.2 document has been sent on pdf-archive.com on 08/04/2012 at 04:55, from IP address 152.14.x.x.
The current document download page has been viewed 1321 times.
File size: 458.75 KB (11 pages).
Privacy: public file

File preview
RELIABILITY AND VALIDITY OF EYE-MOVEMENT
MEASURES OF READING*
BY MILES A. TINKER
University of Minnesota
Since the turn of the century eye-movement records have
been employed more and more as measures of reading performance. There are now several important laboratories
equipped for studying eye movements by the photographic
technique. In an earlier paper, Tinker * suggested that the
wide-spread use of eye-movement measures of reading ability
justifies an evaluation of the photographic technique. It is
time to inquire whether photographic records are reliable and
valid measures of reading.
Until quite recently investigators have apparently assumed
that the various measures of eye movements were sufficiently
reliable to justify rather definite conclusions from the data
collected. Recently published reliability coefficients are high.
Litterer 2 obtained coefficients of .91 and .92 for perception
time and fixation frequency on easy prose, and .91 and .78
for the same measures on scientific prose. Also using adult
subjects, Eurich's s reliability coefficients were: fixation frequency = .85; pause duration = .91; regression frequency
= .77. With children4 the three comparable reliability
coefficients for reading three short paragraphs were .91, .86,
and .91. For any single paragraph the coefficients ranged
* The expenses of this study were met by a research grant from the Graduate
School, University of Minnesota.
'Tinker, M. A., Use and limitations of eye-movement measures of reading.
Psychol. Rev., 1933, 40, 381-387.
'Litterer, 0 . F., An experimental analysis of reading performance. / . Exper.
Educ, 1932, 1, 28-33.
•Eurich, A. C , The reliability and validity of photographic eye-movement
records. / . Educ. Psychol., 1933, 24, 118-122.
4
Eurich, A. G, Additional data on the reliability and validity of photographic
eye-movement records. / . Educ. Psychol., 1933, 34, 380-384..
732
EYE-MOVEMENT MEASURES OF READING
•
733
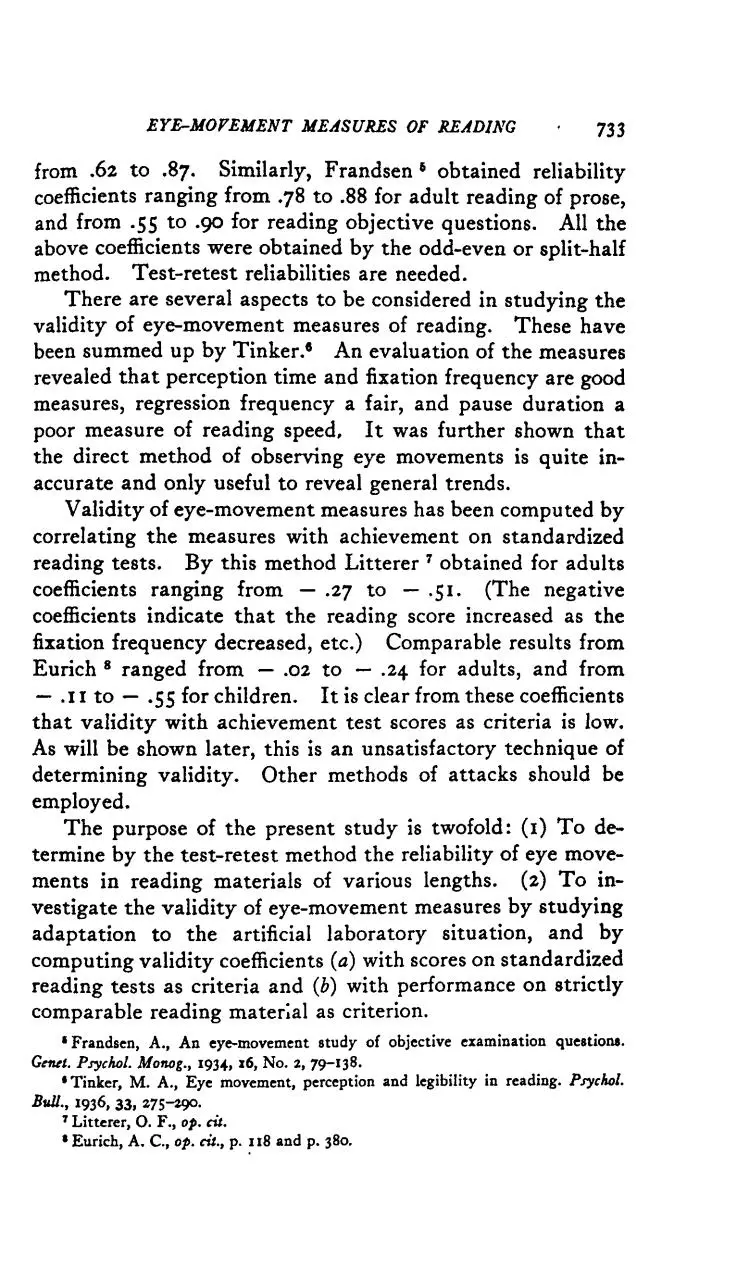
from .62 to .87. Similarly, Frandsen 6 obtained reliabilitycoefficients ranging from .78 to .88 for adult reading of prose,
and from .55 to .90 for reading objective questions. All the
above coefficients were obtained by the odd-even or split-half
method. Test-retest reliabilities are needed.
There are several aspects to be considered in studying the
validity of eye-movement measures of reading. These have
been summed up by Tinker.8 An evaluation of the measures
revealed that perception time and fixation frequency are good
measures, regression frequency a fair, and pause duration a
poor measure of reading speed. It was further shown that
the direct method of observing eye movements is quite inaccurate and only useful to reveal general trends.
Validity of eye-movement measures has been computed by
correlating the measures with achievement on standardized
reading tests. By this method Litterer 7 obtained for adults
coefficients ranging from — .27 to — .51. (The negative
coefficients indicate that the reading score increased as the
fixation frequency decreased, etc.) Comparable results from
Eurich 8 ranged from — .02 to — .24 for adults, and from
— .11 to — .55 for children. It is clear from these coefficients
that validity with achievement test scores as criteria is low.
As will be shown later, this is an unsatisfactory technique of
determining validity. Other methods of attacks should be
employed.
The purpose of the present study is twofold: (1) To determine by the test-retest method the reliability of eye movements in reading materials of various lengths. (2) To investigate the validity of eye-movement measures by studying
adaptation to the artificial laboratory situation, and by
computing validity coefficients (a) with scores on standardized
reading tests as criteria and (b) with performance on strictly
comparable reading material as criterion.
•Frandsen, A., An eye-movement study of objective examination questions.
Getul. Psycho!. Monog., 1934, x6, No. 2, 79-138.
•Tinker, M. A., Eye movement, perception and legibility in reading. Psychol.
Bull., 1936, 33, 275-490.
7
Litterer, O. F., op. dt.
* Eurich, A. C , op. cit., p. 118 and p. 380.
734
MILES A. TINKER
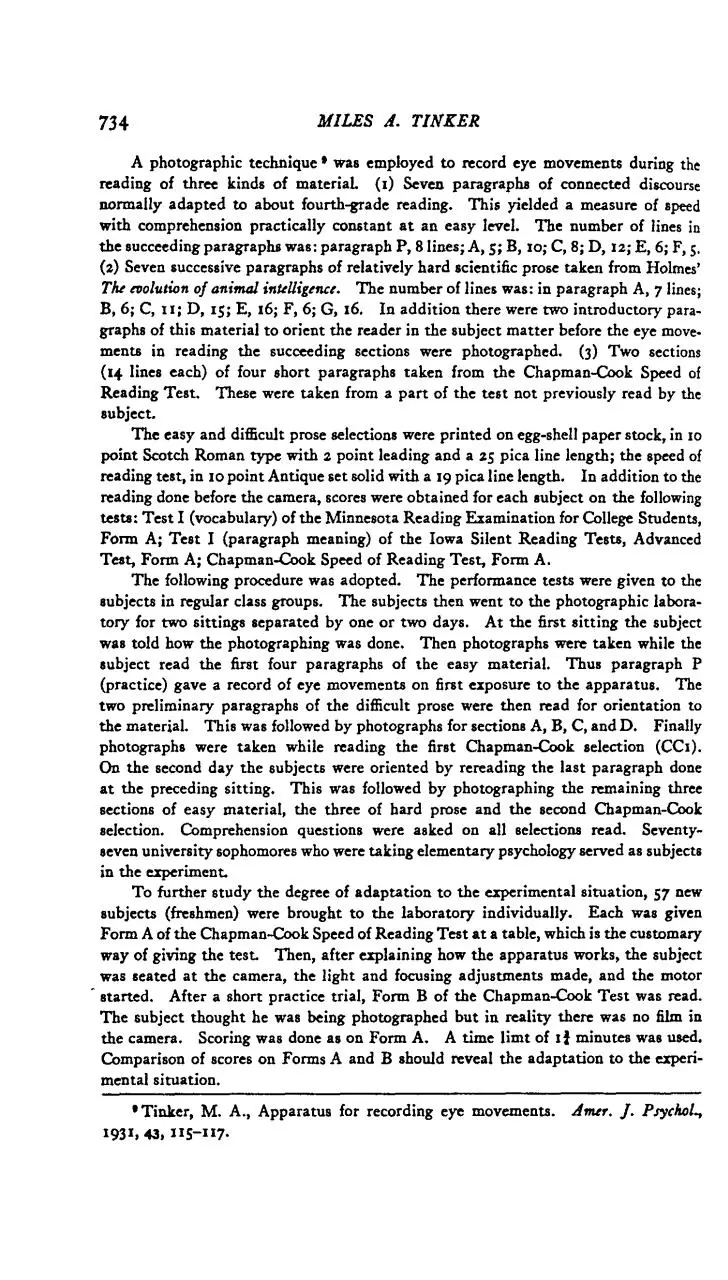
A photographic technique • was employed to record eye movements during the
reading of three kinds of material, (i) Seven paragraphs of connected discourse
normally adapted to about fourth-grade reading. This yielded a measure of speed
with comprehension practically constant at an easy level. The number of lines in
the succeeding paragraphs was: paragraph P, 8 lines; A, 5; B, 10; C, 8; D, 12; E, 6; F, 5.
(2) Seven successive paragraphs of relatively hard scientific prose taken from Holmes'
The evolution of animal intelligence. The number of lines was: in paragraph A, 7 lines;
B, 6; C, 11; D, 15; E, 16; F, 6; G, 16. In addition there were two introductory paragraphs of this material to orient the reader in the subject matter before the eye movements in reading the succeeding sections were photographed. (3) Two sections
(14 lines each) of four short paragraphs taken from the Chapman-Cook Speed of
Reading Test. These were taken from a part of the test not previously read by the
subject.
The easy and difficult prose selections were printed on egg-shell paper stock, in 10
point Scotch Roman type with 2 point leading and a 25 pica line length; the speed of
reading test, in 10 point Antique set solid with a 19 pica line length. In addition to the
reading done before the camera, scores were obtained for each subject on the following
tests: Test I (vocabulary) of the Minnesota Reading Examination for College Students,
Form A; Test I (paragraph meaning) of the Iowa Silent Reading Tests, Advanced
Test, Form A; Chapman-Cook Speed of Reading Test, Form A.
The following procedure was adopted. The performance tests were given to the
subjects in regular class groups. The subjects then went to the photographic laboratory for two sittings separated by one or two days. At the first sitting the subject
was told how the photographing was done. Then photographs were taken while the
subject read the first four paragraphs of the easy material. Thus paragraph P
(practice) gave a record of eye movements on first exposure to the apparatus. The
two preliminary paragraphs of the difficult prose were then read for orientation to
the material. This was followed by photographs for sections A, B, C, and D. Finally
photographs were taken while reading the first Chapman-Cook selection (CCi).
On the second day the subjects were oriented by rereading the last paragraph done
at the preceding sitting. This was followed by photographing the remaining three
sections of easy material, the three of hard prose and the second Chapman-Cook
selection. Comprehension questions were asked on all selections read. Seventyseven university sophomores who were taking elementary psychology served as subjects
in the experiment.
To further study the degree of adaptation to the experimental situation, 57 new
subjects (freshmen) were brought to the laboratory individually. Each was given
Form A of the Chapman-Cook Speed of Reading Test at a table, which is the customary
way of giving the test. Then, after explaining how the apparatus works, the subject
was seated at the camera, the light and focusing adjustments made, and the motor
started. After a short practice trial, Form B of the Chapman-Cook Test was read.
The subject thought he was being photographed but in reality there was no film in
the camera. Scoring was done as on Form A. A time limt of 1} minutes was used.
Comparison of scores on Forms A and B should reveal the adaptation to the experimental situation.
•Tinker, M. A., Apparatus for recording eye movements,
1931.43, "5-I17-
dmer. J. PsychoL,
EYE-MOVEMENT
MEASURES OF READING
735
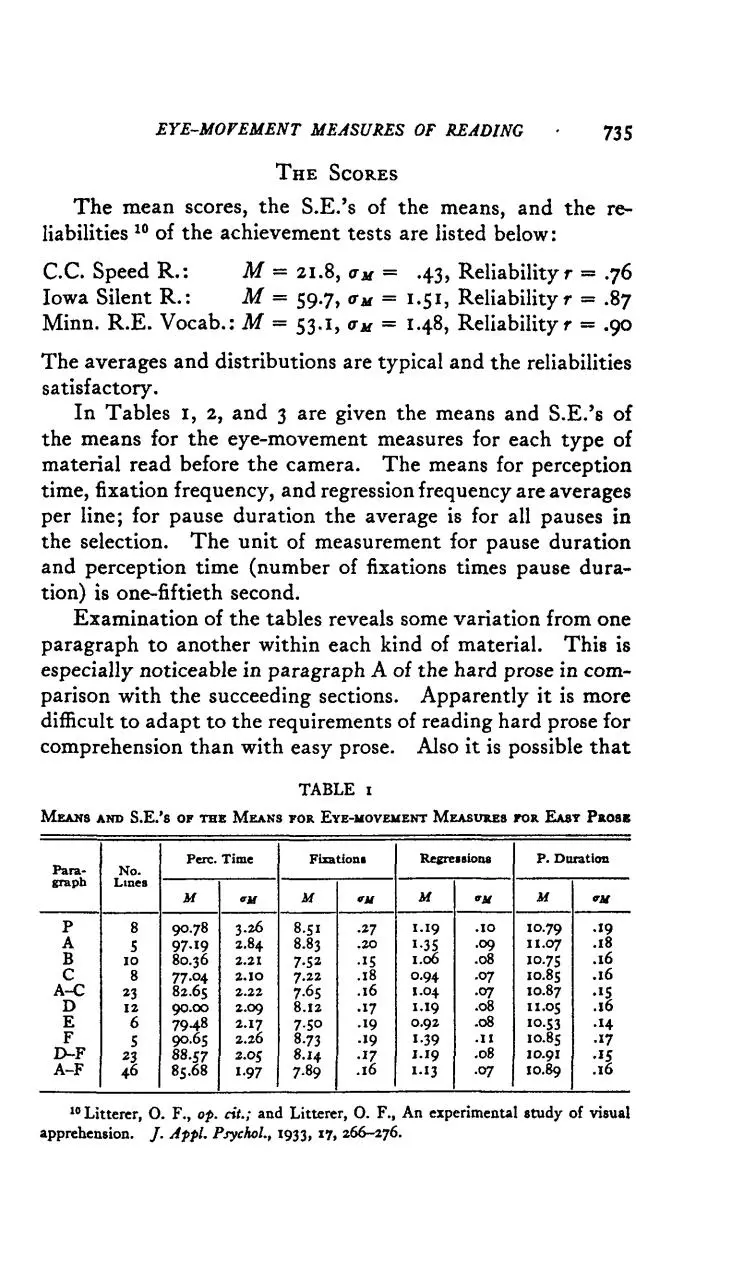
THE SCORES
The mean scores, the S.E.'s of the means, and the reliabilities 10 of the achievement tests are listed below:
C.C. Speed R.:
M = 21.8, <xu = 43, Reliabilityr = .76
Iowa Silent R.:
M = 59.7, au = 1.51, Reliabilityr = .87
Minn. R.E. Vocab.: M = 53.1, <m = 1.48, Reliability r = .90
The averages and distributions are typical and the reliabilities
satisfactory.
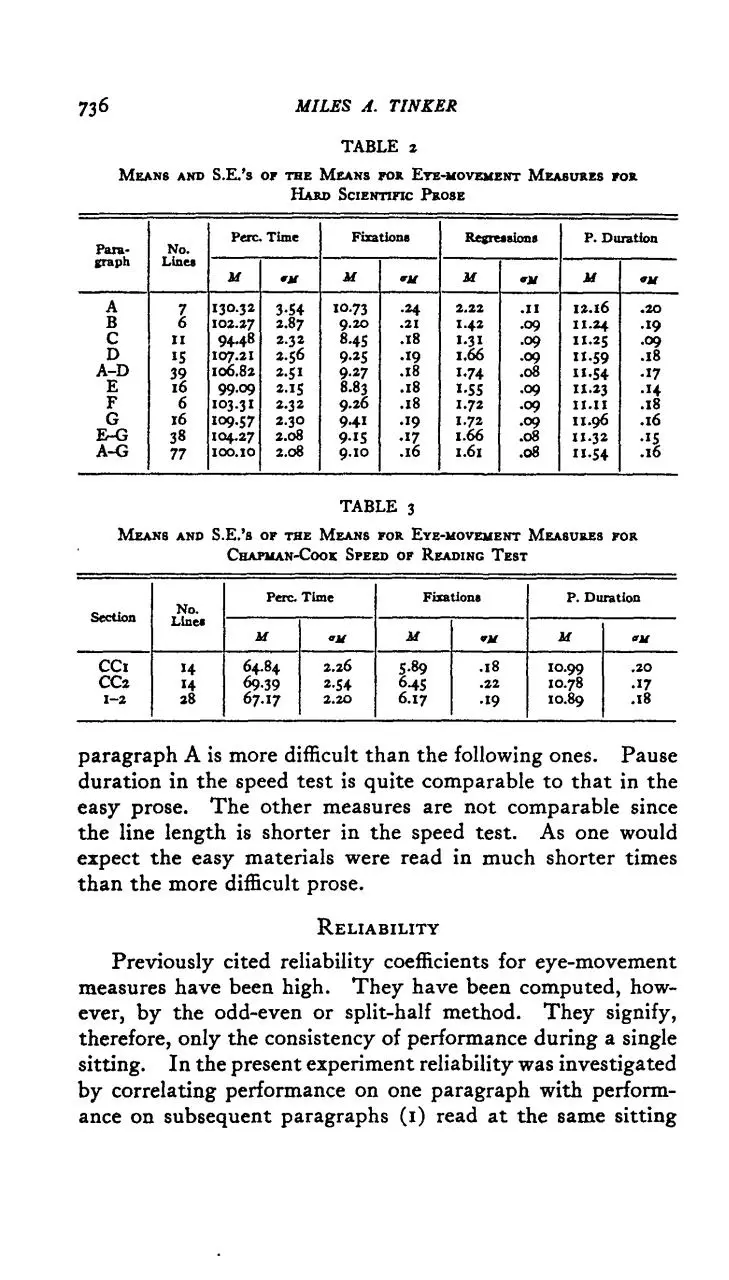
In Tables I, 2, and 3 are given the means and S.E.'s of
the means for the eye-movement measures for each type of
material read before the camera. The means for perception
time, fixation frequency, and regression frequency are averages
per line; for pause duration the average is for all pauses in
the selection. The unit of measurement for pause duration
and perception time (number of fixations times pause duration) is one-fiftieth second.
Examination of the tables reveals some variation from one
paragraph to another within each kind of material. This is
especially noticeable in paragraph A of the hard prose in comparison with the succeeding sections. Apparently it is more
difficult to adapt to the requirements of reading hard prose for
comprehension than with easy prose. Also it is possible that
TABLE 1
MEANS AND S.E.'S OF THE MEANS FOR EYE-MOVEMENT MEASURES FOR EAST PROSE
Paragraph
P
A
B
C
A-C
D
E
F
D-F
A-F
10
No.
Lines
8
5
10
8
23
12
6
5
23
46
Pere. Time
Fixation!
M
"it
M
90.78
3.26
2.84
8.51
97.19
80.36
77.04
82.65
90.00
7948
90.65
88.57
85.68
2.21
2.IO
2.22
2.09
2.17
2.26
2.05
1-97
8.83
7-52
7.22
7.65
8.12
7.50
8.73
8.14
7.89
•27
.20
•15
.18
.16
•17
•19
Regreisions
P. Duration
M
M
«M
10.79
II.07
IO.75
IO.85
IO.87
II.05
IO.53
IO.85
10.91
IO.89
•«9
1.19
i-35
1.06
0.94
1.04
1.19
0.92
•»9
1.39
•17
.16
1.19
1.13
.10
.09
.08
.07
.07
.08
.08
.11
.08
.07
.18
.16
.16
•'§
.16
.14
•17
.15
.16
Litterer, O. F., of. cit.; and Litterer, 0 . F., An experimental study of visual
apprehension. / . Appl. Psychol., 1933, 17, 266-276.
MIL£S A. TINKER
736
TABLE 2
M E A N S AND
S.E.'s or THE MEANS FOR EYE-MOVEMENT MEASURES POX.
HARD SCIENTIFIC PROSE
Paragraph
A
B
C
D
A-D
E
F
G
E-G
A-G
No.
Lines
Perc Time
if
7
6
II
9448
IS
39
16
107.21
106.82
99.09
103.31
109.57
104.27
6
it
or
130.32
102.27
16
38
77
Fixations
IOO.IO
3-54
2.87
2.32
2.56
2.51
2.15
2.32
2.30
2.08
2.08
IO.73
9.20
8-45
9.25
9.27
8.83
9.26
9-41
9-iS
9.10
Regressions
'it
.24
.21
.18
.19
.18
.18
.18
.19
•17
.16
M
«u
2.22
[.42
1.31
[.66
1-74
'•S5
.11
.72
.72
.66
1.6l
P. Duration
it
»M
I2.l6
II.24
II.25
11.59
11.54
11.23
.09
•09
.08
•09
•09
.09
.08
.08
.10
•19
.09
.18
•17
•14
.18
.16
11.11
11.96
11.32
11.54
•'5
.16
TABLE 3
MEANS AND S.E.'S OF THE MEANS FOR EYE-MOVEMENT MEASURES FOR
CHAPUAN-COOK SPEED OF READING TEST
Section
PercTime
No.
Lines
It
CCi
CC2
1-2
»4
14
28
64.84
6939
67.17
nl(
2.26
2.54
2.20
Fixations
P. Duration
it
m
M
CM
5.89
645
6.17
.18
.22
•19
IO.99
IO.78
IO.89
.2O
•17
.18
paragraph A is more difficult than the following ones. Pause
duration in the speed test is quite comparable to that in the
easy prose. The other measures are not comparable since
the line length is shorter in the speed test. As one would
expect the easy materials were read in much shorter times
than the more difficult prose.
RELIABILITY
Previously cited reliability coefficients for eye-movement
measures have been high. They have been computed, however, by the odd-even or split-half method. They signify,
therefore, only the consistency of performance during a single
sitting. In the present experiment reliability was investigated
by correlating performance on one paragraph with performance on subsequent paragraphs (1) read at the same sitting
EYE-MOVEMENT MEASURES OF READING
737
and (2) read at a second sitting. Analysis of the reliabilitycoefficients will give information on the following points:
(1) the effect of habituation to the reading situation and
reading materials upon reliability; (2) the consistency of
performance from one paragraph to another at the same
sitting, and consistency from one sitting to the other; (3) the
effect of length of reading copy upon reliability, and the
comparative reliability of the various measures.
The reliability coefficients are given in Tables 4, 5,6, and 7.
In addition the coefficients for the speed of reading test,
selection CCi versus CC2, are .72 for perception time, .65 for
fixation frequency, and .81 for pause duration.
In Table 4 we find that perception time for the first
paragraph read, the practice (P) selection, is nearly as reliable
as subsequent paragraphs. Evidently most readers, after the
experimenter has given a description of how the apparatus
TABLE 4
RELIABILITY OF PERCEPTION TIME AS A MEASURE OF READING PERFORMANCE
Selection
P
A
B
C
A-C
D
E
F
D-F
A
76
Easy Prose
N •• 7 7
First Sitting
Second Sitting
B
C
A-C
•71
.70
•74
.86
•77
•79
•91
•95
.92
D
E
F
D-F
A-F
•65
•Si
•77
•74
•79
.66
•78
•79
•77
•73
.69
.69
.65
.68
•83
•78
.78
.83
.70
.82
.70
•71
•79
Hard Prose
A
B
C
D
A-D
E
F
G
E-G
An
.82
.90
.88
J»5
•9S
•93
.88
•8<i
•91
•91
.88
.96
N -• 77
B
c
D
A-D
E
F
G
E-G
A-G
•73
•74
.69
.87
.87
•Si
.56
•77
.81
•91
.61
.61
.60
.70
.76
a
•5*
•71
.68
.63
.72
.91
.87
•93
.84
.81
.82
.88
.68
•63
•5*
•65
.67
it
•77
.66
•73
•74
.90
.81
.78
.88
.87
MILES A. TINKER
738
works, settle quickly into consistent and typical reading.
Observation revealed certain subjects, however, who were
disturbed by the bright light shining into their eyes and by
the rigid confinement in the headrest. They need practice as
well as explanations to bring adequate adaptation to the
artificial reading situation at the camera. It is probably best
to give all subjects a practice trial to promote adaptation to
the set-up.
TABLE s
RELIABILITY OF FIXATION FREQUENCY AS A MEASURE OP READING PERFORMANCE
Easy Prose
AT - 7 7
Fir«t Sitting
Second Sitting
An
Selection
A
B
C
A-C
D
E
F
D-F
A-F
P
A
B
C
.78
•79
.84
•73
.81
.76
.89
.98
.70
.80
•79
•75
•79
•78
•85
.90
•74
•59
•73
•75
•76
.82
.72
.80
.76
.81
.82
.80
.80
•75
•78
•73
.88
•95
.89
.96
A-C
D
E
F
D-F
Hard Prose
A
B
C
D
A-D
E
F
G
E-G
.86
.90
91
.87
.88
.88
•97
A-G
•89
N -• 77
B
C
D
A-D
E
F
G
E-C
•74
.68
•74
.80
.80
•85
.87
•58
•75
•57
.68
•73
.63
.72
.80
•57
•65
•59
•73
.76
.72
.78
•93
.87
•93
•91
•93
.70
.69
•65
•74
.68
.66
•71
•77
•75
•77
.82
.84
.84
.90
.84
.80
.86
.90
In general there is a slight tendency for the reliability
coefficients to increase with continued practice before the
camera. Part of the increase may be due, however, to
adaptation to the reading material itself. These trends are
discovered by examining the correlations of each selection
with the following selection. The variation of the coefficients
in progressing downward in columns 5, 9, and 10 also show the
EYE-MOVEMENT MEASURES OF READING
739
same trend. The spurious factors in these coefficients are
fairly constant (.07 to .10 points) and do not obscure the
trends due to practice. The coefficients in these three
columns show that the paragraph preceded by most practice
TABLE 6
RELIABILITY OF REGRESSION FREQUENCY AS A MEASURE OF READING PERFORMANCE
Easy Prose
N •• 7 7
First Sitting
Second Sitting
Selection
A
B
c
P
A
B
C
A-C
D
E
F
D-F
•71
.66
.76
t
.67
A-C
D
E
F
D-F
A-F
•71
•75
.72
.72
.78
•75
.86
•83
•93
.85
.90
.84
.50
.62
.69
.58
•75
.60
.65
•63
•73
.69
•77
•65
.65
•71
.80
•74
•94
.86
.88
•91
.82
Hard Prose
A
B
C
D
A-D
E
F
G
E-G
.66
c
D
.76
.81
.72
•71
B
An
.86
•96
N •• 77
A-D
E
F
G
E-G
A-G
•65
•75
.61
.66
.81
•71
.70
.70
•79
•87
.86
.86
.83
.76
.6*
•65
-73
•74
.64
.70
.83
.69
.67
.78
.81
.90
•93
.67
.81
.80
.81
.76
•74
•79
•79
.86
•93
.88
•94
•91
.89
.86
.91
•94
tends to be slightly more typical of performance in general.
These trends are seen in both easy and hard prose. Similar
trends are discovered in Tables 5, 6, and 7 which contain the
reliability coefficients for fixation frequency, regression frequency and pause duration. Practice in reading before the
camera brings, therefore, only a slight improvement in
consistency of performance. This change may be due to
adaptation to either the laboratory situation, or to the reading
material, or both.
As one would expect, test-retest reliability for material
read at the same sitting yielded slightly higher coefficients
MILES A. TINKER
74©
than the first sitting versus the second. For one paragraph
versus others read on the same day the average reliability
coefficient for perception time was on the average approximately .76 for easy prose and .74 for hard prose. When
performance on the first day is correlated against that on the
second, the average coefficients were .72 and .60 respectively
for easy and hard prose. Similar trends appear in Tables 5, 6,
and 7 for the other eye-movement measures. The range of
these coefficients is .65 to .81.
TABLE 7
RELIABILITY OF PAUSE DURATION AS A MEASURE or READING PERFORMANCE
Easy Prose
N '• 7 7
First Sitting
Second Sitting
Selection
A
B
c
A-C
D
E
F
D-F
A-F
P
A
B
C
A-C
D
E
F
D-F
.68
•78
.78
•73
.89
•87
.60
.67
.68
•77
•77
•65
.66
.76
.76
.61
.70
.80
.82
•79
•78
•77
.85
.88
•93
.88
•93
•93
•93
•95
•77
a
.94
.68
•74
.76
•79
.80
.82
.89
.87
.90
•94
Hard Prose
A
B
C
D
A-D
E
F
G
E-G
.80
N -• 7 7
B
C
D
A-D
.82
.84
.84
•73
.76
.84
•91
.89
•95
.90
E
F
G
E-G
A-G
.71
•71
•74
•77
.78
•83
.67
.68
•73
•75
•76
•77
.76
•75
•78
85
•87
.83
•85
.83
.82
•91
.90
•85
•96
•94
.90
.82
.90
•75
.80
.98
.89
•94
The coefficients cited indicate that single short paragraphs
of reading yield eye-movement measures that are adequate for
group comparisons. To obtain coefficients which indicate
that the reading measure is satisfactory for individual diagnosis it is necessary to read more material. When paragraphs
A—C of the easy material are correlated with D-F (23 versus
EYE-MOFEMENT MEASURES OF READING
741
23 lines), and A-D with E-G (39 versus 38 lines) of the
difficult prose, an average coefficient of .82 is obtained. Onlyone coefficient, .72 for perception time on hard prose, is low
(Tables 4-7). If individual diagnosis is planned, therefore,
about 25 lines of material should be read. Results from less
than approximately 20 lines probably should never be used
for individual diagnosis unless a reliability of .80 or above has
been established for the particular selection to be employed.
While 10 to 15 lines sometimes yields a reliability of .80 or
above, this is far from common.
It is interesting to note in Tables 4-7 that even with a very
small sample of 5 or 6 lines of reading, as selection A versus F
in easy prose and B versus F in difficult prose, the eye-movements are remarkably consistent from paragraph to paragraph
(r = about .70). Doubling the number of lines raises the
coefficients somewhat, but not as high as predicted by the
Brown-Spearman formula.
Consistency of performance is little affected by variation in
difficulty of material when a single sitting is considered. For
one sitting versus a second, however, perception time,
fixation frequency and pause duration are slightly more
reliable and regression frequency slightly less reliable in easy
than in difficult reading. The increased reliability of regression frequency in the difficult reading is undoubtedly due
to the fact that relatively many more regressions are made in
reading this material.
Fixation frequency, in general, had about the same
reliabilities as perception time. Regression frequency was
slightly less reliable than perception time and fixation frequency, and pause duration slightly more reliable than the
same measures.
Our results indicate that eye-movement records have
satisfactory reliability as measures of reading performance.
This is true for even very small samples (5 lines) where group
comparisons are to be made. It should be noted that our
reliability coefficients are smaller than those obtained by oddeven correlations in previous investigations.
MILES A. TINKER
742
VALIDITY
In the customary set-up for photographing eye movements
a strong light shines into the reader's eye and the head is
firmly clasped in a headrest. In addition, the whole experimental room usually presents a decidedly strange environment. Is the subject able to give a typical reading
performance under these conditions? It is true that some of
the subjects complain of the bright light and others appear a
little bewildered at first by the unfamiliar situation.
To study the adaptation of the subjects to the laboratory
situation, reading in the regular manner at a table was
compared with reading before the camera as described in
procedure. Form A of the Chapman-Cook test was read in
the regular manner, and Form B before the camera. Form
B is equivalent to Form A when Form B is given second and
the testing conditions are identical. The scoring was the
same in both situations. Any effect of the camera situation
should appear as a difference between the two scores. The
results are given in Table 8. The comparison of scores
shows that, on the average, the subjects read as well before the
TABLE 8
SHOWING ADAPTATION TO THE LABORATORY SITUATION.
Test and Condition
Mean
°u
CC Form A: Regular
16.08
•51
CC Form B: At camera
16.13
•55
N »• 57 FRESHMEN
r: Avs. B
Diff.
D
•Diff.
•94
•OS
O.28
camera as when reading in the customary manner. Although
some subjects did better and some poorer before the camera,
the group as a whole gave an entirely typical performance in
the photographic situation.
These data do not mean that no attempt should be made to
help the subject adjust to the artificial situation. As noted
in our procedure, care was taken to explain the operation of
the apparatus and a practice trial was given before the main
experimental trial. This always tends to remove much of
Download Reliability and Validity of Eye-Movement Measures of Reading
Reliability and Validity of Eye-Movement Measures of Reading.pdf (PDF, 458.75 KB)
Download PDF
Share this file on social networks
Link to this page
Permanent link
Use the permanent link to the download page to share your document on Facebook, Twitter, LinkedIn, or directly with a contact by e-Mail, Messenger, Whatsapp, Line..
Short link
Use the short link to share your document on Twitter or by text message (SMS)
HTML Code
Copy the following HTML code to share your document on a Website or Blog
QR Code to this page

This file has been shared publicly by a user of PDF Archive.
Document ID: 0000038155.