lamour jbmr a 2011 supp info (PDF)
File information
This PDF 1.4 document has been generated by TeX / MiKTeX pdfTeX-1.40.10, and has been sent on pdf-archive.com on 28/08/2012 at 23:24, from IP address 137.82.x.x.
The current document download page has been viewed 1297 times.
File size: 4.03 MB (9 pages).
Privacy: public file


File preview
SUPPORTING INFORMATION
Interplay between long- and short-range interactions drives neuritogenesis on
stiff surfaces.
Guillaume Lamour, Sylvie Souès, and Ahmed Hamraoui.
Contents:
Table S1: Values of the surface tension (γ, mN m−1 ) of test liquids at 20◦ C.
2
Table S2: Contact angles: measured values (θm. ) and fitted values (θf. ).
3
Figure S1: Schematics of molecules used as test liquids for contact angle measurements.
4
Figure S2: SFE components γ d and γ nd of solid substrates according to the combination of
of test liquids chosen to apply the Owens–Wendt model.
5
Figure S3: Localization of neuronal marker Tau in PC12 cells, 24 h after seeding: neurites are
generated in response to surface characteristics.
6
Note S1: Interpretation of the data obtained for γc versus theoretical expectations from NH2 terminated molecules structures.
7
Note S2: Correlating SFE components with surface nanostructure.
8
Supplementary references
9
Journal of Biomedical Materials Research Part A
1
Lamour et al.
Supporting Information
Supplementary Table S1:
Liquid
γ
γd
γ nd
Water
Formamide
Diiodomethane
α-Bromonaphthalene
72.8
58
50.8
44.4
21.8
39
50.8
44.4
51
19
∼0
∼0
TABLE S1: Values of the surface tension (γ, mN m−1 ) of test liquids at 20◦ C.1 γ d and
γ nd are respectively the dispersive and the non-dispersive components of the surface tension.
Journal of Biomedical Materials Research Part A
2
Lamour et al.
Supporting Information
Supplementary Table S2:
θH2 O
θFA
θDIM
θαBrN
deg
deg
deg
deg
adms
θm.
θf.
aptms
θm.
θf.
deta
θm.
θf.
eda
θm.
θf.
θm.
56.8
45.1
41.6
33.6
54.3
41.4
38.5
32.2
61.9
50.4
36.3
24.8
67.7
47.3
31.9
20.5
69.8
48.0
27.3
18.5
56.7
46.1
40.2
34.3
53.7
43.4
37.6
31.7
63.1
47.0
37.4
26.7
67.5
47.1
34.4
17.5
peda
θf.
69.4
47.2
32.9
11.1
TABLE S2: Contact angles: measured values (θm. ) and fitted values (θf . ). Contact
angles were measured using water, formamide (FA), diiodomethane (DIM) and α-Bromonaphthalene
(αBrN), as test liquids. The fitted values were extracted from the Zisman plot fitted data (Fig. 3)
and used to calculate the surface free-energy components with the Owens–Wendt model (Fig. 5,
Fig. S2, and Table 2).
Journal of Biomedical Materials Research Part A
3
Lamour et al.
Supporting Information
Supplementary Figure S1:
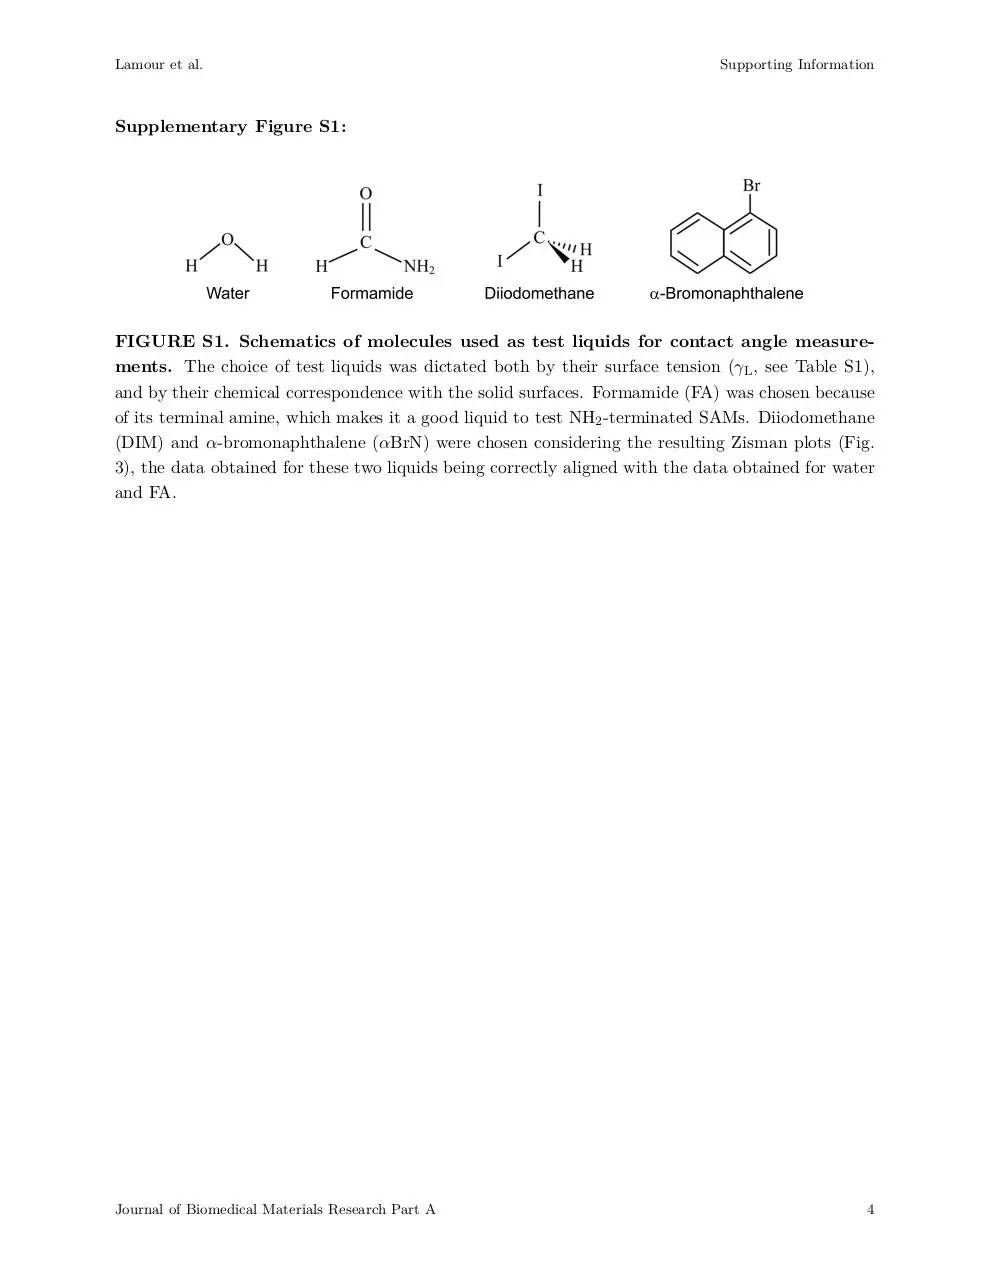
FIGURE S1. Schematics of molecules used as test liquids for contact angle measurements. The choice of test liquids was dictated both by their surface tension (γL , see Table S1),
and by their chemical correspondence with the solid surfaces. Formamide (FA) was chosen because
of its terminal amine, which makes it a good liquid to test NH2 -terminated SAMs. Diiodomethane
(DIM) and α-bromonaphthalene (αBrN) were chosen considering the resulting Zisman plots (Fig.
3), the data obtained for these two liquids being correctly aligned with the data obtained for water
and FA.
Journal of Biomedical Materials Research Part A
4
Lamour et al.
Supporting Information
Supplementary Figure S2:
FIGURE S2. SFE components γ d and γ nd of solid substrates according to the combination of test liquids chosen to apply the Owens–Wendt model. The total SFE γs were
similar for all substrates, whatever couple of test liquids. For instance, using the couple of test
liquids (H2 O, αBrN), we obtained 50.2 ± 1.0 mN m−1 (eda and peda) ≤ γs ≤ 54.7 ± 1.6 mN m−1
(aptms). Using (FA, αBrN), we obtained 43.5 ± 1.3 mN m−1 (adms) ≤ γs ≤ 46.5 ± 0.9 mN m−1
(peda). In addition, the relative distributions of γ d and γ nd are maintained from one couple of test
liquids to another, although that the absolute values of SFE components can vary (especially the
value of γ nd ). Consequently, it appears that all couples of test liquids are suitable to analyze the
respective distributions of γ d and γ nd for each substrate. Nevertheless the combination water with
α-bromonaphthalene (Fig. 5) was chosen for the higher values of γ nd .
Journal of Biomedical Materials Research Part A
5
Lamour et al.
Supporting Information
Supplementary Figure S3:
FIGURE S3. Localization of neuronal marker Tau in PC12 cells, 24 h after seeding:
neurites are generated in response to surface characteristics. Cells were cultured on a
peda substrate without NGF treatment and observed using a Nikon Eclipse E600 epifluorescence
microscope (×50 objective) coupled to a high resolution color camera (Nikon DXM 1200). Full
details of the procedure used to stain cells with fluorescent antibodies are available in a previous
work.2 Arrows point local higher concentrations of Tau in growth cones (plain arrows) and at
branching/turning points (broken arrows). Similar Tau localization was previously observed in
PC12 cells differentiated under a NGF treatment,2 therefore indicating here that the substrate can
mimic NGF effects by only 24 h of culture (as opposed to 6 days in our previous study). Scale bar:
20 µm, applies for all images.
Journal of Biomedical Materials Research Part A
6
Lamour et al.
Supporting Information
Supplemental Note S1: Interpretation of the data obtained for γc versus theoretical
expectations from NH2 -terminated molecules structures.
Zisman plots indicate that the surface organization established by a given aminosilane does not depend as much on the number of methoxy groups attached to the Si element, than on the aminoalkyl
chain length, together with the number of amine groups contained by this chain. For instance,
ADMS and APTMS, which lateral aminoalkyl chains are identical, appear to form almost the same
surfaces, though the two molecules are chemically different (Fig. 1). In a sense, it is surprising,
as APTMS undergo chaotic polymerization in the solvent solution used here, which should theoretically mostly result in vertical (i.e. “disordered”) polymerization. Therefore, one hypothesis
that could explain the relatively ordered surface organization of the aptms substrate is to consider the possibility that, given the “small” dimensions of the APTMS monomer (compared to
other trimethoxysilanes considered), the resulting oligomers would be flexible enough to spread in a
parallelly-oriented manner onto the glass surface, thus mimicking the adms substrate nanostructure.
This interpretation of the data (the main influence of each distinct lateral chain’s number of amine
groups on the surface ordering) is strengthen by the γc values determined for eda, peda and deta
substrates. Indeed, both EDA and PEDA molecules formed the same class of surfaces, whether or
not a phenyl group was present in the lateral chain of these molecules. Conversely, DETA formed
a surface in which the ordered organization of monomers seemed more pronounced than in eda or
peda substrates. From this result, it might be inferred that, because DETA lateral chain contains
one more amine group than EDA and PEDA it helps to stabilize the ordered organization during
substrate formation. Such stabilization could be the result of increased mutual H-bonding between
amine groups of side-by-side monomers,3 together with increased Van der Waals attractive forces
between alkyl chains, the intensity of these latter forces being expected to level up with the alkyl
chain length. Altogether, the results indicate that the “optimally disordered” surface organization
(i.e. class 3) is obtained using diamine-alkylsiloxanes (e.g., EDA or PEDA) to coat bare glass.
Journal of Biomedical Materials Research Part A
7
Lamour et al.
Supporting Information
Supplemental Note S2: Correlating SFE components with surface nanostructure.
The analysis of SFE components of NH2 /OH-terminated substrates is complicated by the fact that
both NH2 and OH groups provide dispersive and non-dispersive contributions to the overall SFE
values (i.e., γs ). Comparing water and formamide in terms of structure (Fig. S1) and of SFE γ d and
γ nd values (Table S1) leads to the following estimation: the NH2 group provides a contribution to
SFE that is rather dispersive than non-dispersive, whereas the OH group provides a non-dispersive
contribution that is more than 2 times higher than its dispersive contribution to SFE. “Ordered”
(class 2) substrates such as adms and aptms, that supposedly exhibit a higher quantity of NH2
groups, compared to OH groups, should therefore have a higher γ d and a smaller γ nd than those of
“disordered” (class 3) substrates (i.e., eda and peda). Though all substrates verify the relation γ d
> γ nd (Fig. S2), which is coherent with surfaces covered by NH2 rather than by OH groups, the γ d
and γ nd values of eda and peda substrates are respectively higher and smaller than those of adms
and aptms. Here are potential explanations of such results:
i) It is possible that the higher number of amine groups contained in EDA and PEDA lateral
chains (compared to ADMS and APTMS, Fig. 1) leads to a parallel increase in the dispersive
component of SFE in both eda and peda substrates.
ii) Considering Zisman plots (Fig. 3), eda and peda surfaces are believed to exhibit non-negligible
amounts of OH groups, as sketched in Fig. 2 (class 3 structure). The dispersive contributions
provided by these OH groups would consequently add to those of NH2 -groups, and then γ d
would be higher for class 3 surfaces. It is to be noted that the same result was observed for
mixed CH3 /OH-terminated SAMs,4 where the γ d was higher for class 3 than for both class 1
and 2 surfaces, though the number of grafted molecules was proven to be more important in
class 1 or 2 than in class 3 SAMs.
iii) In addition, it is of interest to consider the sizes of molecules used as test liquids to hypothesize
their potential influence in calculated values of γ d and γ nd . For example, water is small enough
to diffuse into closely packed SAMs5 and thereby to probe the non-dispersive character of the
OH groups that are “hidden” in a region close to the surface (and possibly not accessible to
the cells), contrary to larger molecules such as αBrN and, possibly, formamide. Therefore, OH
groups coming from the glass surface would be more easily accessible to water test liquid for
“small” grafted molecules such as ADMS and APTMS. This could also explain the fact that,
for all substrates, the values determined for γ nd are more important using H2 O and αBrN as
test liquids than using FA and αBrN (Fig. S2), though this could be attributed to the weak
polar sensitivity of formamide (Table S1).
Journal of Biomedical Materials Research Part A
8
Lamour et al.
Supporting Information
Supplementary references
1. Kwok DY, Li D, Neumann AW. Evaluation of the Lifshitz-Van der Waals acid-base approach to
determine interfacial-tensions. Langmuir 1994;10:1323-1328.
2. Lamour G, Journiac N, Souès S, Bonneau S, Nassoy P, Hamraoui A. Influence of surface energy
distribution on neuritogenesis. Colloids Surf B 2009;72:208-218.
3. Song SY, Chu RQ, Zhou JF, Yang SG, Zhang JY. Formation and tribology study of amidecontaining stratified self-assembled monolayers: Influences of the underlayer structure. J Phys
Chem C 2008;112:3805-3810.
4. Lamour G, Eftekhari-Bafrooei A, Borguet E, Souès S, Hamraoui A. Neuronal adhesion and
differentiation driven by nanoscale surface free-energy gradients. Biomaterials 2010;31:37623771.
5. Zisman WA. Influence of constitution on adhesion. Ind Eng Chem 1963;55:19-38.
Journal of Biomedical Materials Research Part A
9
Download lamour-jbmr-a-2011 supp-info
lamour-jbmr-a-2011_supp-info.pdf (PDF, 4.03 MB)
Download PDF
Share this file on social networks
Link to this page
Permanent link
Use the permanent link to the download page to share your document on Facebook, Twitter, LinkedIn, or directly with a contact by e-Mail, Messenger, Whatsapp, Line..
Short link
Use the short link to share your document on Twitter or by text message (SMS)
HTML Code
Copy the following HTML code to share your document on a Website or Blog
QR Code to this page

This file has been shared publicly by a user of PDF Archive.
Document ID: 0000045528.