20121129 PrésentationAREVA PremiumReviewSG (PDF)
File information
Title: 20121129 - Présentation AREVA - Premium Review SG_vDEF en ligne
Author: aramon
This PDF 1.4 document has been generated by PDFCreator Version 1.4.0 / GPL Ghostscript 9.05, and has been sent on pdf-archive.com on 16/10/2013 at 22:28, from IP address 217.5.x.x.
The current document download page has been viewed 1087 times.
File size: 2.88 MB (27 pages).
Privacy: public file


File preview
AREVA: Global leader
in low-carbon power generation
Premium Review – Société Générale
Paris, November 29th, 2012
Agenda
►AREVA overview
►Strategy & performance
►Financial Outlook
AREVA Presentation – November 29, 2012
p.2
Energy market:
continued growth announced
Macroeconomics
Energy demand: x2 by 2050
Geopolitics
Energy independence and
security of supply imperative
Resources
Increasing difficulties in
extracting resources leading to
higher prices
Demand in
nuclear energy*
+1.9%
/ year
Environment
GHG emissions reduction goal of
50% by 2050
Demand in
renewable
energies*
+2.5%**
/ year
WEO 2012
2010 – 2035
New Policies Scenario
* Billions of toe
** Including hydraulic energy
Economics
Need of mastered, stable and
predictable energy costs
AREVA Presentation – November 29, 2012
p.3
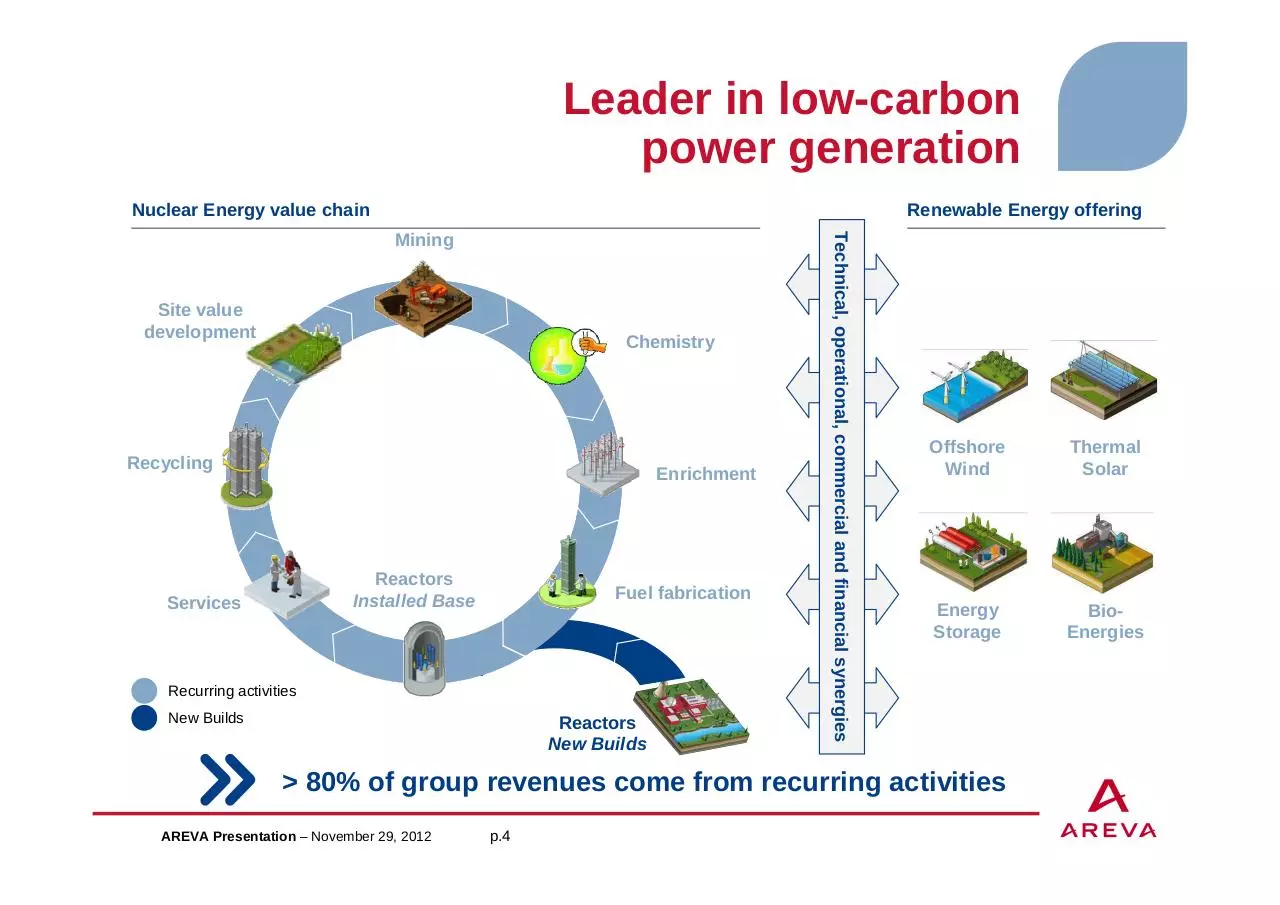
Leader in low-carbon
power generation
Nuclear Energy value chain
Renewable Energy offering
Site value
development
Chemistry
Recycling
Enrichment
Reactors
Installed Base
Services
Fuel fabrication
Recurring activities
New Builds
Reactors
New Builds
Technical, operational, commercial and financial synergies
Mining
Offshore
Wind
Thermal
Solar
Energy
Storage
BioEnergies
> 80% of group revenues come from recurring activities
AREVA Presentation – November 29, 2012
p.4
Nuclear scenario:
differed but confirmed growth
AREVA 2011 scenario
Change in global installed base
(GWe)
GWe)
(GWe)
GWe)
Reassessed at end-June 2011
o.w
47 GWe in Japan
20 GWe in Germany
AREVA’s business model allows it to capture market
opportunities in all segments
AREVA Presentation – November 29, 2012
p.5
AREVA is present on the full
nuclear value chain
Nuclear Reactor lifecycle
Construction
Operations
End of life
Mining
Front End
Reactors and
Services
Back End
AREVA covers all phases of nuclear reactors’ lifecycle
AREVA Presentation – November 29, 2012
p.6
Construction
AREVA benefits from strong
competitive edge in new constructions
A competitive value proposition
► Highest safety standards
Air plane crash protection
Core meltdown protection systems
Avoidance of nuclear materials discharge
Resistance to earthquakes and flooding
► Amongst lowest levelized cost
of electricity
Investment cost per MW close
to other technologies in recent bids
Up to 25% lower operations cost
► Excellent operational performance
Optimized outage strategy with fuel
cycle flexibility
Increased closed cycle profitability
with 100% MOX compatibility
► EPR: most advanced technology in
terms of construction worldwide
All AREVA reactors meet generation III nuclear safety criteria
AREVA Presentation – November 29, 2012
p.7
Construction
AREVA is involved in major
tenders for new nuclear worldwide
Ongoing negotiations
(bilateral)
Ongoing bids
Upcoming bids
(in 3-5 years)
ESKOM
Hinkley Point
C-D
JAEC
EDF
PGE
Saudi Arabia
Pyhäjoki
Taishan 3-4
CGNPC
(GDF Suez – Iberdrola JV)
Temelin 3-4
Jaitapur 1-2
NPCIL
EDF
PPL
Duke Energy
NuGen
Fennovoima
CEZ *
Calvert Cliff 3
Bell Bend
Piketon
Delta
New Brunswick Power
OL 4
Vattenfall
TVO
MVM
MNPC
NA-SA
* Suspended, waiting for arbitration of Czech national competition body UOHS
AREVA Presentation – November 29, 2012
p.8
Operations
AREVA’s recurring activities allow
utilities to operate nuclear reactors
Utility
Fuel
assemblies
Used fuel
External services & maintenance
Outages
Replacement of
components
Upgrades
Uprates
AREVA seizes opportunities in all segments of nuclear operations
irrespective of reactors technology
AREVA Presentation – November 29, 2012
p.9
Operations
95% of all nuclear utilities are
AREVA customers
AREVA references:
Europe, CIS and Africa
98 reactors built
188 reactors in operation
~140 reactors
4 reactors under construction
served by AREVA
114 for services
135 for fuel
North and
South Americas
Asia
119 reactors in operation
~90 reactors
130 reactors in
operation
~130 reactors
served by AREVA
17 for services
90 for fuel
served by AREVA
126 for services
100 for fuel
AREVA provides products and services to 360 reactors worldwide
AREVA Presentation – November 29, 2012
p.10
Operations
Forecasted growth in
worldwide nuclear installed capacity
2030
2011
377 GW
583 GW
Europe
- 13%
North America
+ 11%
Japan & Korea
+ 31%
Russia & CIS
+ 19%
China (including
Taiwan) & India
x8
Rest of world
x3
Source: AREVA 2011 scenario
+ 54% installed base capacity by 2030 will drive market opportunities
across all regions for AREVA
AREVA Presentation – November 29, 2012
p.11
An organization designed to seize
opportunities all over the world
AREVA worldwide presence
Regional headquarters
America regional offices
Europe regional offices
Asia-Pacific regional offices
AREVA Presentation – November 29, 2012
p.12
End of life
Dismantling: broad expertise in
managing customer projects
Reactor vessel / internals: decontamination and dismantling (D&D)
Stade, Würgassen,
Obrigheim
Dismantling of the reactor vessel and internals
Decontamination of primary and auxiliary circuits
Millstone, Rancho Seco,
Yankee Rowe
Dismantling of the reactor vessel and internals
Used fuel, effluent / radioactive waste management
Fukushima
Design and implementation of a full water treatment system
Dounreay
Special equipment to retrieve damaged fuel in research reactor
Assistance to the project owner / Design and engineering
Creys-Superphénix
Support to the sodium retrieval and D&D preparation
M&O (maintenance and operations) for D&D projects
Hanford
High level waste treatment (customer: DOE)
Savannah
Vitrification of high level waste (customer: DOE)
Marcoule
D&D of a large fuel treatment facility (customer: CEA)
Sellafield
Member of the site's M&O consortium
Creation of an expertise center for decommissioning and dismantling in Germany
AREVA Presentation – November 29, 2012
p.13
AREVA Renewables currently
operates in 4 market segments
Offshore Wind
More electricity output
than onshore turbines
More Wind hours
Higher wind levels
Larger turbine
sizes
Concentrated Solar
Power
Enables steam
production for hybrid
fossil/solar plants and
industrial applications
Possibility of thermal
storage increasing
production hours
AREVA Presentation – November 29, 2012
p.14
Bioenergy
Energy production
from biomass sources
AREVA also active in
upstream biomass
treatment market
through its torrefaction
technology
Energy Storage
Hydrogen production
through electrolysis
technology
Power production from
hydrogen in fuel cells
Other energy storage
technologies
considered for largescale applications
Renewable Energies market:
accelerated growth expected
Estimated average annual market size in volume
Sources: IEA World Energy Outlook for CSP and Bioenergy, AREVA forecasts for Offshore Wind (WEO does not distinguish onshore/offshore)
Offshore wind market (Europe)
Solar CSP market (World)
Bioenergy market (World)
(MW)
(MW)
(MW)
7,317
Other Asia / Oceania
Other Asia / Oceania
India
Middle-East / Africa
China
India
Europe
4,700
Latin America
5,160
North America
Europe
Middle-East and Africa
North America
Other Europe
France
2,340
Germany
1,561
China
1,010
UK
2011-2015
2016-2020
2011-2015
2016-2020
2011-2015
2016-2020
AREVA’s positioning on renewable market: selected growing activities
AREVA Presentation – November 29, 2012
p.15
Agenda
►AREVA overview
►Strategy & performance
►Financial Outlook
AREVA Presentation – November 29, 2012
p.16
“Action 2016” Strategic Action Plan
Safety Security Transparency
Commercial
priority given
to value
creation
Selectivity
in capital
spending
• Installed Base:
doubling profitability
by 2016
• New Builds:
becoming the reference
technology
• €7.7bn over the
2012-2016 period,
i.e. -34% vs. 2007-2011
• Several projects on
hold
Debt
management
• Disposal plan
> €1.2bn over the
2012-2013 period
• Fully self-financed
Capex on a cumulative
basis over the 2012-2016
period
Improving our performance
-€1bn on annual operating costs base and -€500m in WCR by 2015
Concrete progress in all strategic orientations
AREVA Presentation – November 29, 2012
p.17
Safety
Commercial
priority given
to value
creation
Security Transparency
Selectivity
in capital
spending
Debt
management
Improving our performance
Improvement
of AREVA’s financial structure
Asset disposals program
ahead of schedule
Strengthening our
balance sheet
2 bond issues:
December 14, 2011: 01dB-Metravib
March 8, 2012: €400m bond issue (maturity:
October 5, 2017)
January 30, 2012: Sofradir
March 21, 2012: €200m private placement
maturing in 10 years
May 16, 2012: ERAMET
c.€1.2bn
June 1, 2012: AREVA Lesedi
June 11, 2012: Millennium
No major debt refinancing required before
2016
Average debt maturity: 7 years
August 28, 2012: La Mancha
Liquidity: €1.9bn in net cash
available at 6/30/2012 (+€462m
vs end of 2011)
2012-2013 objective for
disposals has been reached
AREVA Presentation – November 29, 2012
p.18
Safety
Commercial
priority given
to value
creation
Security Transparency
Selectivity
in capital
spending
Debt
management
65% of the operating cost
reduction goal secured
Improving our performance
OBJECTIVE of improving performance
€1bn reduction in annual operating costs by 2015
€1.0bn
Objective
Achieved(1)
Secured(2)
Identified(3)
~€450m
(1) Contribution to savings by actions
completed at end-June 2012, based on
annual costs excluding technology
transition in Front End
(2) Contribution to savings by actions
secured at end-June 2012, based on
annual costs excluding technology
transition in Front End
(3) Contribution to savings by actions
identified at end-June 2012, based on
annual costs
45% of the 2015 goal
is secured
~€150m
2015
objective
~€200m
~€200m
2011-2012
actions
2011-2015
actions
20% of the 2015
objective has been
achieved
€350m secured at the end of 2012 65% of the €1bn secured by 2015
AREVA Presentation – November 29, 2012
p.19
€47bn of backlog:
5 years of revenue secured
Backlog at September 30, 2012
In value
Number of years
Approximate coverage of 2012
of 2011 revenue in backlog
revenue by BG (rounded)
Mining
€12.8bn
Front End
€18.5bn
Reactors
& Services
€8.5bn
Back End
€5.8bn
4
~100%
Renewable
Energies
€1.3bn
4
~75%
AREVA Presentation – November 29, 2012
p.20
10
8
3
~100%
~95%
~90%
Commercial dynamism and
improved profitability
Backlog (€bn)
Revenue (€m)
+10.1%
7,589
42.5
43.3
44.2
8,089
8,529 9,104 8,872
5,950
47.0
45.6
+10.0%
6,542
42.7
34.9
2007
2008
2009
2010
2011
Sept.
2011
Sept.
2012
Restated EBITDA* (€m)
2007
2008
2009
2010
2011
9M
2011
9M
2012
H1
2011
H1
2012
Restated FCF before tax*(€m)
2007
2008
2009
-900
-919
2010
2011
+€508m
908
725
684
-591
421
402
262
2008
2009
2010
2011
H1
H1
2011
2012
*Restated for Siemens impacts in 2011and capital gains on disposal of stakes in Mining and Enrichment projects
AREVA Presentation – November 29, 2012
p.21
-1,090
-1,366
217
-2,218
2007
-919
+€328m
Agenda
►AREVA overview
►Strategy & performance
►Financial Outlook
AREVA Presentation – November 29, 2012
p.22
Financial outlook
Action 2016:
2012-2013 outlook
Upward revision
for 2012
Action 2016:
2015-2016 outlook
Nuclear: +3 to 6% per year
Nuclear: +4 to 6%
Nuclear: +5 to 8% p.a
Renewables
> €750m
Renewables: ~€600m
Renewables: >€1.25bn
Revenue
EBITDA
> €750m
> €1.25bn
> €950m
Free operating
cash flow
excl. disposals
> -€1.5bn
Break-even
> -€1.25bn
> +€1.0bn p.a
from 2015
At constant consolidation scope
2012 outlook revised upward at the occasion of H1 2012 results
AREVA Presentation – November 29, 2012
p.23
Appendix
2012 half-year results – AREVA – July 27, 2012 - p.24
AREVA in figures
€47bn
backlog at 09/30/2012
Seizing growth opportunities on the worldwide existing
fleet and on new markets
Geographic distribution of 2011 revenue
€8.872bn
in revenue in 2011
Europe
61%
47,541 employees
in 25 countries
900 experts
8,000 patents
Incl. France 36%
Incl. Germany 9%
North & South
America
20%
2%
devoted to R&D
p.25
Incl. Japan 8%
Asia – Pacific
Africa &
Middle East
4% of sales
AREVA Presentation – November 29, 2012
17%
Download 20121129-PrésentationAREVA-PremiumReviewSG
20121129-PrésentationAREVA-PremiumReviewSG.pdf (PDF, 2.88 MB)
Download PDF
Share this file on social networks
Link to this page
Permanent link
Use the permanent link to the download page to share your document on Facebook, Twitter, LinkedIn, or directly with a contact by e-Mail, Messenger, Whatsapp, Line..
Short link
Use the short link to share your document on Twitter or by text message (SMS)
HTML Code
Copy the following HTML code to share your document on a Website or Blog
QR Code to this page

This file has been shared publicly by a user of PDF Archive.
Document ID: 0000128900.