document (PDF)
File information
Title: The Buzz: SPX skew hits a 3y high
Author: The Goldman Sachs Group, Inc.
This PDF 1.4 document has been generated by PScript5.dll Version 5.2.2 / Acrobat Distiller 9.3.0 (Windows); modified using iText 2.1.7 by 1T3XT, and has been sent on pdf-archive.com on 17/03/2014 at 16:01, from IP address 71.201.x.x.
The current document download page has been viewed 1319 times.
File size: 590.9 KB (14 pages).
Privacy: public file


File preview
March 17, 2014
The Buzz: SPX skew hits a 3y high
Options Research
The VXST (9-day VIX index) was up 62% last week
SPX skew highest since October 2011
VIX market
The VXST ended last week at 20.6, up 7.9 vol
points (+62%) week-over-week but it still remains
well off its early February high of 24. Although
VIX option 1m implied volatility also spiked, 1m
call skew remains near average levels relative to
the last year vs. S&P 500 skew at highs.
SPX 1m implied vol was up 3.4 pts last week,
the most among global indices. 1m implieds
are 15 vs. 1m realized vol at 9.3, 10d at 11.6.
Increased hedging demand drove S&P 500
skew to its highest level since October 2011.
The bid for shorter-dated options pushed
implied vol for options expiring this Friday
above 17, causing a checkmark pattern in the
term structure.
S&P 500 1m skew hits a multi-year high
We analyze the performance of VIX calls and
SPX puts across all listed strikes and
expirations from Wednesday March 12 market
close through Friday March 14.
A top 10 list shows payouts of $3.6 to $4-to-1
for investors who used near-the-money SPX
weekly puts expiring March 14.
March 17 and 18 strike calls were the two top
performers in VIX space; with payouts of
$3.7:1 and $3.8:1 respectively, just behind the
SPX weeklies. Those VIX options were 11%
and 18% otm versus the closing March futures
level last Wednesday.
0.30
0.25
0.20
Jan-13
Jul-13
Jan-14
Source: Goldman Sachs Global Investment Research.
(212) 357-3770 krag.gregory@gs.com
Goldman, Sachs & Co.
SPX puts vs. VIX calls last week
0.40
0.35
Krag Gregory, Ph.D.
Goldman Sachs does and seeks to do business with companies covered in its research reports. As a result, investors should be aware that the firm may have a
conflict of interest that could affect the objectivity of this report. Investors should consider this report as only a single factor in making their investment decision.
For Reg AC certification and other important disclosures, see the Disclosure Appendix, or go to www.gs.com/research/hedge.html. Analysts employed by non-US
affiliates are not registered/qualified as research analysts with FINRA in the U.S. This report is intended for distribution to GS institutional clients only.
The Goldman Sachs Group, Inc.
Global Investment Research
March 17, 2014
Global Snapshot: S&P 500 saw the largest shift in 1m vol last week among global indices
Exhibit 1: S&P 500 1m implieds jumped 3.4 vol points last week, the most among global indices. XLI vol was up the most across U.S. sectors.
Top Exhibit: Level of 1m 50 delta implied volatility as of March 14 market close. Bottom exhibit: Change in 1m implied volatility level from March 7 to March 14, 2014.
Level of 1m implied volatility March 14
50
45
Country ETFs
Global Equity Indices
42
US Sector ETFs
40
35
31
30
30
26 26
25
20
23 23 22
20 20 19
19 18
15
26
24 24
21 20
16 16 15 14
14 13
12 11
18
16 15
17 17 17 17 17 16
16
13 12
10
5
0
5
4
3
1 week change in 1m implied volatility
3.4 3.2
4.2
3.4
3.0 2.9 2.9 2.9
2.5
2
2.3
2.4
2.1 2.0 1.9
1.9 1.9
1.7 1.6 1.6
1.2
1
3.2 3.2
2.7
2.5
2.0
1.7 1.6
1.5
1.1 0.9
0.9
3.0
0.7
1.1
0.3
0
-1
0.0
-0.3 -0.5
Source: Goldman Sachs Global Investment Research.
Goldman Sachs Global Investment Research
2
March 17, 2014
SPX 1m skew is now at its highest level since October 2011
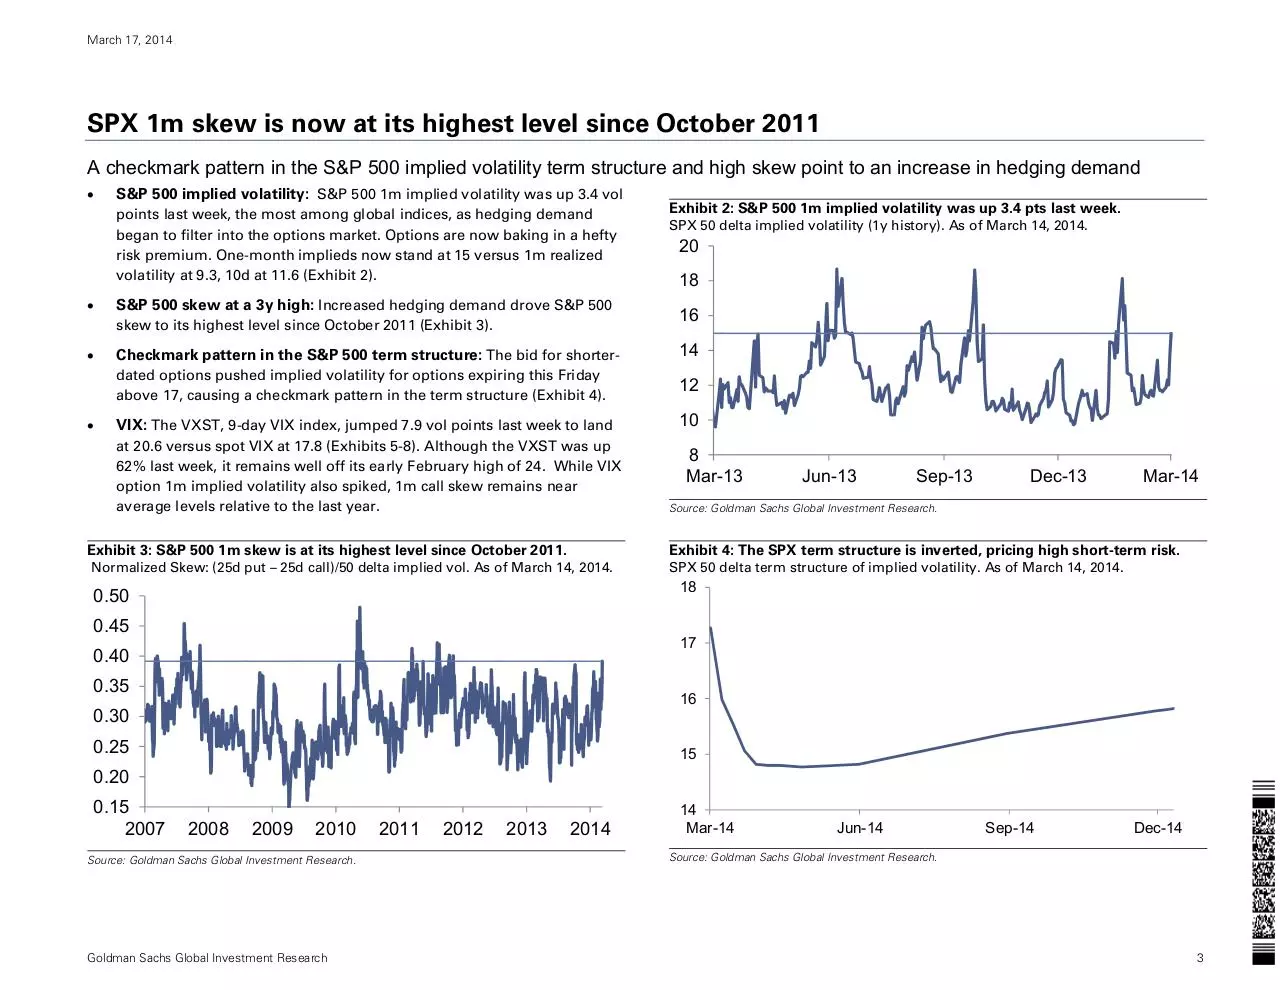
A checkmark pattern in the S&P 500 implied volatility term structure and high skew point to an increase in hedging demand
S&P 500 implied volatility: S&P 500 1m implied volatility was up 3.4 vol
points last week, the most among global indices, as hedging demand
began to filter into the options market. Options are now baking in a hefty
risk premium. One-month implieds now stand at 15 versus 1m realized
volatility at 9.3, 10d at 11.6 (Exhibit 2).
S&P 500 skew at a 3y high: Increased hedging demand drove S&P 500
skew to its highest level since October 2011 (Exhibit 3).
Exhibit 2: S&P 500 1m implied volatility was up 3.4 pts last week.
SPX 50 delta implied volatility (1y history). As of March 14, 2014.
20
18
16
Checkmark pattern in the S&P 500 term structure: The bid for shorter-
14
dated options pushed implied volatility for options expiring this Friday
above 17, causing a checkmark pattern in the term structure (Exhibit 4).
12
VIX: The VXST, 9-day VIX index, jumped 7.9 vol points last week to land
10
at 20.6 versus spot VIX at 17.8 (Exhibits 5-8). Although the VXST was up
62% last week, it remains well off its early February high of 24. While VIX
option 1m implied volatility also spiked, 1m call skew remains near
average levels relative to the last year.
8
Mar-13
Jun-13
Sep-13
Dec-13
Mar-14
Source: Goldman Sachs Global Investment Research.
Exhibit 3: S&P 500 1m skew is at its highest level since October 2011.
Exhibit 4: The SPX term structure is inverted, pricing high short-term risk.
Normalized Skew: (25d put – 25d call)/50 delta implied vol. As of March 14, 2014.
SPX 50 delta term structure of implied volatility. As of March 14, 2014.
18
0.50
0.45
17
0.40
0.35
16
0.30
0.25
15
0.20
0.15
2007
2008
2009
2010
Source: Goldman Sachs Global Investment Research.
Goldman Sachs Global Investment Research
2011
2012
2013
2014
14
Mar-14
Jun-14
Sep-14
Dec-14
Source: Goldman Sachs Global Investment Research.
3
March 17, 2014
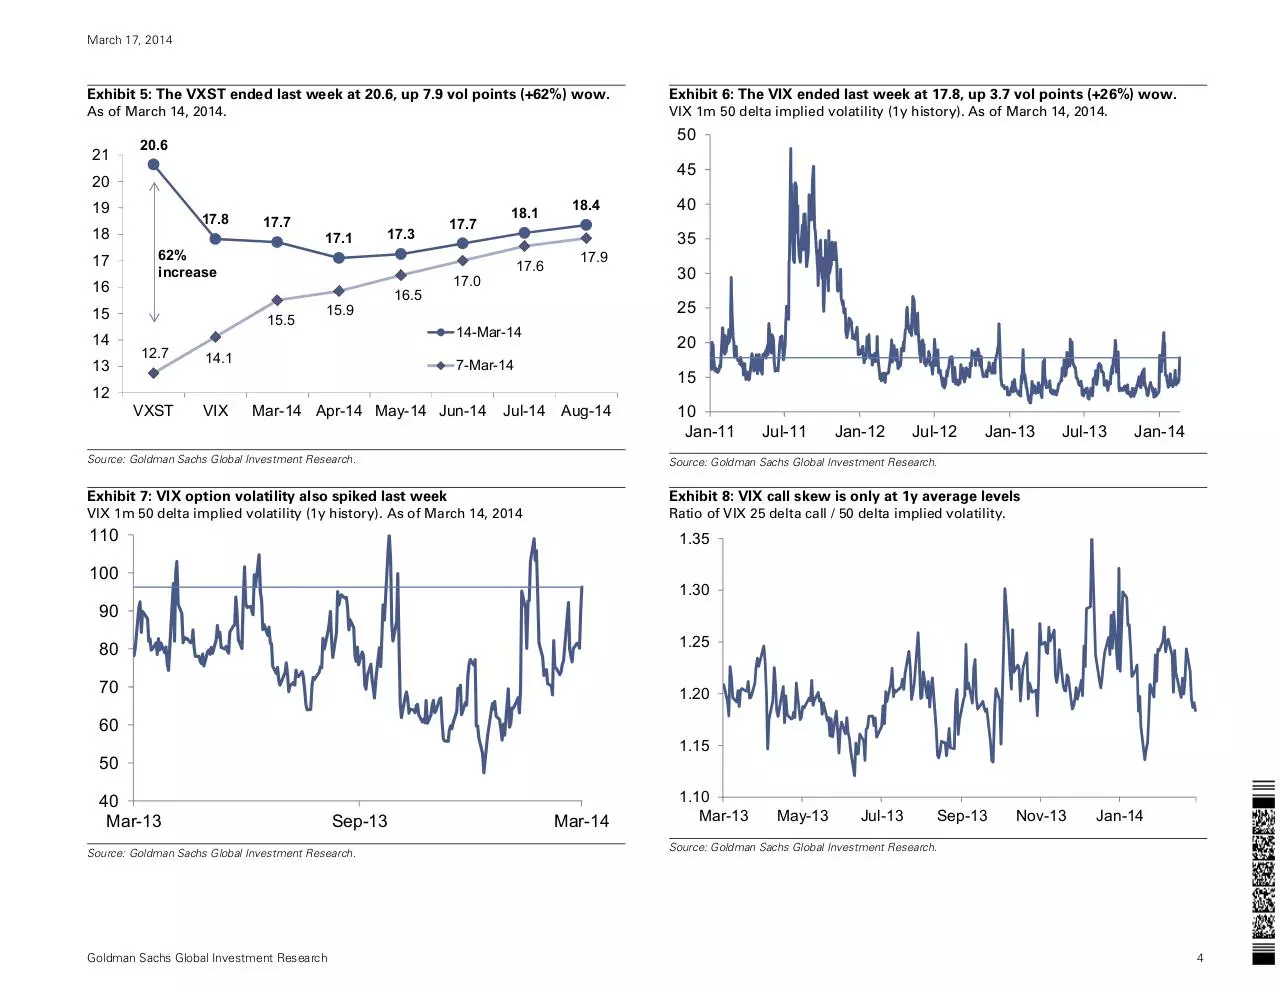
Exhibit 5: The VXST ended last week at 20.6, up 7.9 vol points (+62%) wow.
Exhibit 6: The VIX ended last week at 17.8, up 3.7 vol points (+26%) wow.
As of March 14, 2014.
VIX 1m 50 delta implied volatility (1y history). As of March 14, 2014.
21
50
20.6
45
20
19
17.8
18
17
16
13
17.1
17.3
62%
increase
15
14
17.7
15.5
12.7
15.9
16.5
17.7
18.1
18.4
35
17.6
17.0
17.9
20
7-Mar-14
15
12
VXST
VIX
30
25
14-Mar-14
14.1
40
Mar-14 Apr-14 May-14 Jun-14
Jul-14 Aug-14
10
Jan-11
Jul-11
Jan-12
Jul-12
Jan-13
Source: Goldman Sachs Global Investment Research.
Source: Goldman Sachs Global Investment Research.
Exhibit 7: VIX option volatility also spiked last week
Exhibit 8: VIX call skew is only at 1y average levels
VIX 1m 50 delta implied volatility (1y history). As of March 14, 2014
Ratio of VIX 25 delta call / 50 delta implied volatility.
110
Jul-13
Jan-14
1.35
100
1.30
90
80
1.25
70
1.20
60
1.15
50
40
Mar-13
Sep-13
Source: Goldman Sachs Global Investment Research.
Goldman Sachs Global Investment Research
Mar-14
1.10
Mar-13
May-13
Jul-13
Sep-13
Nov-13
Jan-14
Source: Goldman Sachs Global Investment Research.
4
March 17, 2014
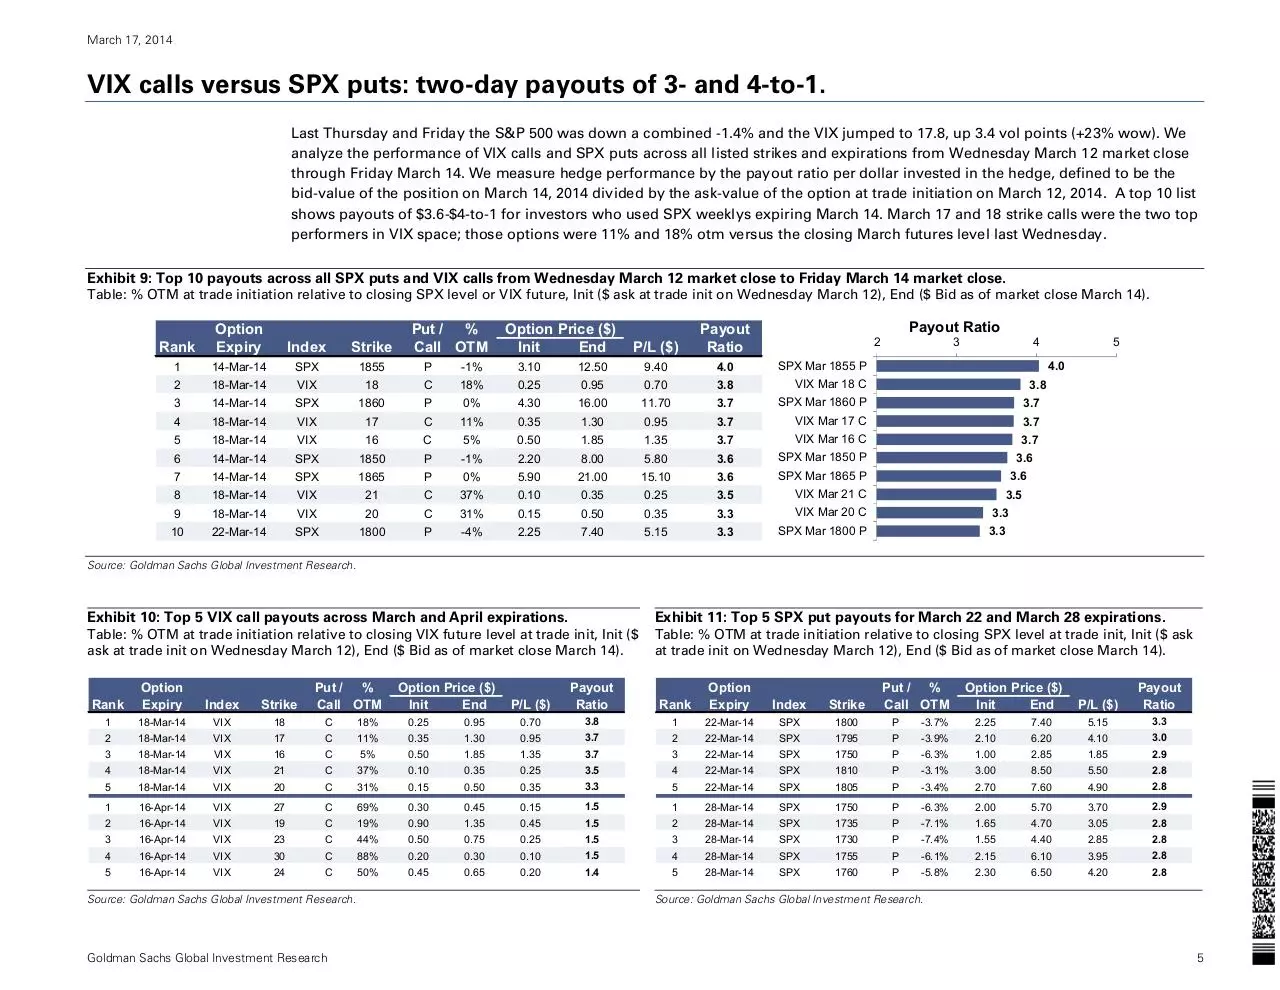
VIX calls versus SPX puts: two-day payouts of 3- and 4-to-1.
Last Thursday and Friday the S&P 500 was down a combined -1.4% and the VIX jumped to 17.8, up 3.4 vol points (+23% wow). We
analyze the performance of VIX calls and SPX puts across all listed strikes and expirations from Wednesday March 12 market close
through Friday March 14. We measure hedge performance by the payout ratio per dollar invested in the hedge, defined to be the
bid-value of the position on March 14, 2014 divided by the ask-value of the option at trade initiation on March 12, 2014. A top 10 list
shows payouts of $3.6-$4-to-1 for investors who used SPX weeklys expiring March 14. March 17 and 18 strike calls were the two top
performers in VIX space; those options were 11% and 18% otm versus the closing March futures level last Wednesday.
Exhibit 9: Top 10 payouts across all SPX puts and VIX calls from Wednesday March 12 market close to Friday March 14 market close.
Table: % OTM at trade initiation relative to closing SPX level or VIX future, Init ($ ask at trade init on Wednesday March 12), End ($ Bid as of market close March 14).
Rank
Option
Expiry
Index
Strike
Put / %
Call OTM
Option Price ($)
Init
End
1
14-Mar-14
SPX
1855
P
-1%
3.10
2
18-Mar-14
VIX
18
C
18%
0.25
3
14-Mar-14
SPX
1860
P
0%
4
18-Mar-14
VIX
17
C
11%
5
18-Mar-14
VIX
16
C
6
14-Mar-14
SPX
1850
P
7
14-Mar-14
SPX
1865
P
8
18-Mar-14
VIX
21
C
Payout Ratio
P/L ($)
Payout
Ratio
12.50
9.40
4.0
SPX Mar 1855 P
0.95
0.70
3.8
VIX Mar 18 C
4.30
16.00
11.70
3.7
SPX Mar 1860 P
3.7
0.35
1.30
0.95
3.7
VIX Mar 17 C
3.7
5%
0.50
1.85
1.35
3.7
VIX Mar 16 C
-1%
2.20
8.00
5.80
3.6
SPX Mar 1850 P
0%
5.90
21.00
15.10
3.6
SPX Mar 1865 P
37%
0.10
0.35
0.25
3.5
VIX Mar 21 C
2
9
18-Mar-14
VIX
20
C
31%
0.15
0.50
0.35
3.3
VIX Mar 20 C
10
22-Mar-14
SPX
1800
P
-4%
2.25
7.40
5.15
3.3
SPX Mar 1800 P
3
4
5
4.0
3.8
3.7
3.6
3.6
3.5
3.3
3.3
Source: Goldman Sachs Global Investment Research.
Exhibit 10: Top 5 VIX call payouts across March and April expirations.
Exhibit 11: Top 5 SPX put payouts for March 22 and March 28 expirations.
Table: % OTM at trade initiation relative to closing VIX future level at trade init, Init ($
ask at trade init on Wednesday March 12), End ($ Bid as of market close March 14).
Table: % OTM at trade initiation relative to closing SPX level at trade init, Init ($ ask
at trade init on Wednesday March 12), End ($ Bid as of market close March 14).
Rank
Option
Expiry
Index
Strike
Put / %
Call OTM
P/L ($)
Payout
Ratio
Rank
Option
Expiry
Index
Strike
1
18-Mar-14
VIX
18
C
18%
0.25
2
18-Mar-14
VIX
17
C
11%
0.35
0.95
0.70
3.8
1
22-Mar-14
SPX
1800
P
-3.7%
2.25
1.30
0.95
3.7
2
22-Mar-14
SPX
1795
P
-3.9%
2.10
3
18-Mar-14
VIX
16
C
5%
0.50
1.85
1.35
3.7
3
22-Mar-14
SPX
1750
P
-6.3%
4
18-Mar-14
VIX
21
C
37%
0.10
0.35
0.25
3.5
4
22-Mar-14
SPX
1810
P
5
18-Mar-14
VIX
20
C
31%
0.15
0.50
0.35
3.3
5
22-Mar-14
SPX
1805
1
16-Apr-14
VIX
27
C
69%
0.30
0.45
0.15
1.5
1
28-Mar-14
SPX
2
16-Apr-14
VIX
19
C
19%
0.90
1.35
0.45
1.5
2
28-Mar-14
3
16-Apr-14
VIX
23
C
44%
0.50
0.75
0.25
1.5
3
4
16-Apr-14
VIX
30
C
88%
0.20
0.30
0.10
1.5
5
16-Apr-14
VIX
24
C
50%
0.45
0.65
0.20
1.4
Source: Goldman Sachs Global Investment Research.
Goldman Sachs Global Investment Research
Option Price ($)
Init
End
Put / %
Call OTM
Option Price ($)
Init
End
P/L ($)
Payout
Ratio
7.40
5.15
3.3
6.20
4.10
3.0
1.00
2.85
1.85
2.9
-3.1%
3.00
8.50
5.50
2.8
P
-3.4%
2.70
7.60
4.90
2.8
1750
P
-6.3%
2.00
5.70
3.70
2.9
SPX
1735
P
-7.1%
1.65
4.70
3.05
2.8
28-Mar-14
SPX
1730
P
-7.4%
1.55
4.40
2.85
2.8
4
28-Mar-14
SPX
1755
P
-6.1%
2.15
6.10
3.95
2.8
5
28-Mar-14
SPX
1760
P
-5.8%
2.30
6.50
4.20
2.8
Source: Goldman Sachs Global Investment Research.
5
March 17, 2014
Exhibit 12: Euro Stoxx 50 1m implied volatility.
Exhibit 13: DAX 1m implied volatility.
Exhibit 14: EEM 1m implied volatility.
1m 50 delta implied volatility. As of March 13, 2014.
1m 50 delta implied volatility. As of March 13, 2014.
1m 50 delta implied volatility. As of March 13, 2014.
25
25
35
30
20
20
15
15
25
20
15
10
Mar-13
Sep-13
Mar-14
10
Mar-13
Sep-13
Mar-14
10
Mar-13
Sep-13
Mar-14
Source: Goldman Sachs Global Investment Research.
Source: Goldman Sachs Global Investment Research.
Exhibit 15: RDXUSD 1m implied volatility.
Exhibit 16: HSCEI 1m implied volatility.
Exhibit 17: KOSPI 200 1m implied volatility.
1m 50 delta implied volatility. As of March 13, 2014.
50 delta implied term structure. As of March 13,
1m 50 delta implied volatility. As of March 13, 2014.
50
36
22
Source: Goldman Sachs Global Investment Research.
34
45
20
32
40
30
18
28
35
26
30
16
24
22
25
14
20
20
18
15
Mar-13
16
Mar-13
Sep-13
Source: Goldman Sachs Global Investment Research.
Goldman Sachs Global Investment Research
Mar-14
Sep-13
Source: Goldman Sachs Global Investment Research.
Mar-14
12
Mar-13
Sep-13
Mar-14
Source: Goldman Sachs Global Investment Research.
6
March 17, 2014
Skew View: Highest in S&P 500, Russell 2000 and Euro Stoxx 50. EWH near a high.
Exhibit 18: S&P 500 and Russell 2000 skew are near 7 year highs, Euro Stoxx 50 skew is 77th %-ile relative to a 7y history. EWH skew highest among country
ETFs.
Normalized skew: (25 delta put – 25 delta call) / 50 delta implied volatility. Percentiles are calculated using data from January 2, 2007 – March 14, 2014.
Global
Indices
Option Volatility
(1m Implied)
1m Skew: Current %-ile
(Since Jan. 2007)
Option Skew
(Norm. 1m 25 delta)
1m Imp Chg Curr Skew Curr Overall Peak
% to
Current (1w) %-ile Current %-ile Peak
Date
Peak
S&P 500
15.0
3.4
34
0.39
96
0.48
5/21/10
23
Russell 2000
19.2
2.9
28
0.32
86
0.41
8/11/11
30
EuroStoxx 50
20.3
2.9
43
0.27
77
0.39 10/16/08 44
Taiwan
11.2
1.2
3
0.18
75
0.55
8/16/07 215
UK (FTSE 100)
14.2
1.7
27
0.29
75
0.46
8/10/11
57
Russia
41.9
-0.5
75
0.22
73
0.32 11/17/11 47
France (CAC)
19.0
3.4
37
0.27
68
0.40 10/17/08 50
KOSPI 200
13.9
1.6
6
0.19
66
0.48
8/19/11 147
Australia
12.7
2.3
17
0.26
63
0.53
12/1/08 108
Switzerland
14.9
2.4
42
0.23
52
0.38 10/17/08 66
Hang Seng
17.5
1.6
27
0.14
51
0.38
8/8/11
169
China (HSCEI)
22.7
0.9
27
0.11
48
0.37
8/9/11
234
NDX
16.4
3.2
31
0.25
48
0.43
5/21/10
77
TOPIX
24.8
1.9
68
0.15
47
0.50
3/17/11 228
Nikkei 225
26.4
2.1
74
0.15
46
0.55
3/17/11 259
Germany (DAX)
19.7
2.5
50
0.23
45
0.39
8/15/07
67
Spain (IBEX)
22.6
3.0
38
0.20
29
0.42 11/13/08 113
Canada
11.7
0.0
10
0.21
21
0.46
11/8/11 120
India (NIFTY)
15.5
0.3
13
0.13
12
0.40
2/21/07 207
Italy (MIB)
21.5
2.0
40
0.14
10
0.40 10/17/08 182
Bovespa
26.3
1.9
57
0.11
5
0.42 10/30/08 299
Average
19.4
1.9 35.6
0.21
52
0.43
131
Low - Risk Aversion - High
US Sector
ETFs
Option Volatility
(1m Implied)
1m Skew: Current %-ile
(Since Jan. 2007)
Option Skew
(Norm. 1m 25 delta)
1m Imp Chg Curr Skew Curr Overall Peak % to
Index
Current (1w) %-ile Current %-ile Peak
Date Peak
XXLE (Energy)
17.3
2.7
15
0.23
76
0.44 12/11/07 90
XXLF (Financials)
17.5
3.2
20
0.23
74
0.44 08/11/11 92
XXLI (Industrials)
17.5
4.2
32
0.28
68
0.53 08/16/07 91
XXLY (Discretionary) 16.1
3.0
29
0.26
55
0.50 08/01/07 92
XXLB (Materials)
16.6
2.5
13
0.22
49
0.41 08/24/07 83
XXLP (Staples)
12.1
1.5
38
0.25
38
0.46 08/24/07 83
XXLV (Healthcare)
16.8
2.0
63
0.23
34
0.45 05/17/07 93
XXLK (Tech)
15.5
3.2
26
0.22
27
0.44 10/29/08 100
XXLU (Utilities)
12.8
1.1
29
0.16
14
0.68 04/26/07 326
Average
15.8
2.6
29
0.23
48
0.48
117
0
25
50
75
100
EEWH (Hong Kong)
EEWC (Canada)
EEEM (Emer. Mkts.)
EEWZ (Brazil )
FFXI (China)
EEWY (Korea)
EEWJ (Japan)
EEWT (Taiwan)
Average
0
25
50
75
100
Low - Risk Aversion - High
International ETFs
0
25
50
Vol %-ile
16.2
15.4
23.7
30.4
25.6
20.8
20.0
17.9
21.2
0.7
3.4
1.9
0.9
2.4
1.9
1.6
1.7
1.8
16
17
31
47
39
19
50
13
29
0.34
0.28
0.26
0.22
0.14
0.16
0.13
0.13
0.21
98
90
70
59
38
28
25
13
53
0.46
0.46
0.42
0.44
0.34
0.45
0.58
0.55
0.46
8/15/12
6/19/12
8/11/11
8/11/11
5/21/10
12/11/07
7/17/09
2/16/07
36
67
64
103
139
182
361
332
161
Vol %-ile
75
100
Skew %-ile
Skew %-ile
1m Normalized Skew
0.50
0.45
0.40
Global Indices
Country ETFs
0.39
0.35
0.32
0.30
Sectors
0.34
0.29
0.25
0.20
0.27 0.27
0.26 0.25
0.23 0.23
0.22 0.21
0.20 0.19
0.28 0.26
0.25 0.23
0.23 0.23 0.22
0.22
0.28 0.26
0.22
0.18
0.15
0.15 0.15 0.14 0.14
0.13
0.16
0.11 0.11
0.16
0.14 0.13
0.13
0.10
0.05
XLU (Utilities)
XLK (Tech)
XLB (Materials)
XLF (Financials)
XLE (Energy)
XLV (Healthcare)
XLP (Staples)
XLY (Discretionary)
XLI (Industrials)
EWJ (Japan)
EWT (Taiwan)
FXI (China)
EWY (Korea)
EWZ (Brazil )
EEM (Emer. Mkts.)
EWC (Canada)
EWH (Hong Kong)
Bovespa
China (HSCEI)
India (NIFTY)
Italy (MIB)
Hang Seng
Nikkei 225
TOPIX
Taiwan
KOSPI 200
Spain (IBEX)
Canada
Russia
Switzerland
Germany (DAX)
NDX
Australia
France (CAC)
EuroStoxx 50
UK (FTSE 100)
S&P 500
Russell 2000
0.00
Source: Goldman Sachs Global Investment Research.
Goldman Sachs Global Investment Research
7
March 17, 2014
Exhibit 1: EEM normalized skew (1m)
Exhibit 2: IWM normalized skew (1m)
Exhibit 3: QQQ normalized skew (1m)
As of March 14, 2014 market close. Normalized skew:
(25 delta put–25 delta call) / 50 delta implied vol.
As of March 13, 2014 market close. Normalized skew:
(25 delta put–25 delta call) / 50 delta implied vol.
As of March 13, 2014 market close. Normalized skew:
(25 delta put–25 delta call) / 50 delta implied vol.
0.35
0.30
0.35
0.30
0.25
0.30
0.25
0.20
0.20
0.25
0.15
0.15
0.10
Jan-13 Apr-13
Jul-13
Oct-13 Jan-14
Source: Goldman Sachs Global Investment Research.
0.20
Jan-13 Apr-13
Jul-13
Oct-13 Jan-14
Source: Goldman Sachs Global Investment Research.
0.10
Jan-13 Apr-13
Jul-13
Oct-13 Jan-14
Source: Goldman Sachs Global Investment Research.
Exhibit 4: Euro Stoxx 50 normalized skew (1m)
Exhibit 5: FTSE 100 normalized skew (1m)
Exhibit 6: HSCEI normalized skew (1m)
As of March 13, 2014 market close. Normalized skew:
(25 delta put–25 delta call) / 50 delta implied vol.
As of March 13, 2014 market close. Normalized skew:
(25 delta put–25 delta call) / 50 delta implied vol.
As of March 13, 2014 market close. Normalized skew:
(25 delta put–25 delta call) / 50 delta implied vol.
0.35
0.35
0.30
0.30
0.25
0.25
0.25
0.20
0.15
0.10
0.20
0.20
0.15
0.15
0.10
Jan-13 Apr-13
Jul-13
Oct-13 Jan-14
Source: Goldman Sachs Global Investment Research.
Goldman Sachs Global Investment Research
0.10
Jan-13 Apr-13
0.05
0.00
Jul-13
Oct-13 Jan-14
Source: Goldman Sachs Global Investment Research.
-0.05
Jan-13 Apr-13
Jul-13
Oct-13 Jan-14
Source: Goldman Sachs Global Investment Research.
8
March 17, 2014
Cross Asset Risk Barometer: RDXUSD implieds remain elevated
Exhibit 7: RDXUSD 1m implied vol remains elevated. S&P 500 1m implieds are up +29% in March, copper implieds are up 26%.
Data: January 2, 2007 – March 14, 2014. Spanish and Italian 10y bond spreads in the table below refer to the spreads versus 10y German bonds. In the bar graph below we
benchmark changes relative to February 28, 2014.
Overall % to
Curr
Peak
Peak Peak Date %-ile
1022
212 23-Oct-08
84
552
182 9-Nov-11
62
633
246 24-Jul-12
52
650
401 24-Oct-08
49
361
284 25-Nov-11 32
217
179 5-Dec-08
20
283
319 20-Nov-08 12
1674
399 9-Mar-09
9
1158
317 5-Mar-09
8
387
701 25-Nov-11
1
0.1
0.5
-0.1
0.9
-0.1
0.3
0.4
0.3
0.9
0.3
18.7
13.3
17.6
15.2
20.1
17.5
12.5
9.7
15.8
9.8
75.0
75.4
74.9
47.8
70.0
37.3
25.3
28.8
42.8
30.8
541 23-Oct-08
872 24-Oct-08
725 22-Oct-08
403 27-Oct-08
420 23-Oct-08
341 27-Oct-08
232 18-Dec-08
333 30-Oct-08
357 27-Oct-08
389 27-Oct-08
33
32
30
23
20
18
14
11
10
10
30.0
27.2
31.9
60.0
83.6
117.4
269
318
459
31
13
9
25
50
75
100
0
25
50
75
100
50
75
Curr %-ile
100
0
25
WTI
Gold
BRL
JPY
US HY CDX 5y
EU XO CDX 5y
EU IG CDX 5y
iTraxx Senior Fin.
RDXUSD
S&P/TSE 60
NIFTY
HSCEI
Bovespa
TOPIX
Nikkei 225
0
FX and Commodity Implied Volatility (1m)
Credit
EEM
29-Oct-08
31-Oct-08
14-Jan-09
CHF
50
75
Curr %-ile
1.8
4.1
2.1
EUR
25
16.3
20.0
21.0
KRW
0
Gold
100 Copper
WTI
Low - Risk Aversion - High
Copper
11.7
7.8
9.1
9.5
13.5
8.5
7.6
6.6
9.4
6.3
Commodity Vol (1m Implied)
Hang Seng
MIB
TWSE
KOSPI 200
FTSE 100
DAX
IBEX
EuroStoxx 50
Russell 2000
SMI
CAC40
ASX 200
Nasdaq 100
VIX
S&P 500
1y
Peak
378
348
379
171
200
133
98
478
528
107
FX Vol vs. USD (1m Implied)
BBRL
KKRW
MMXN
uAUD
ZZAR
JJPY
CCHF
uEUR
uNZD
uGBP
Equity Implied Volatility (1m)
% Change since February 28, 2014
Chg
(1w)
17.4
9.6
9.0
-2.3
8.3
6.0
4.0
20.6
19.5
1.8
MXN
Index
Current
328
EEMCDS
I Italy 10y Bond Spr.
196
183
SSpain 10y Bond Spr.
I iTraxx Asia ex Jap.
130
I iTraxx Senior Fin.
94
77
EEU IG CDX 5y
I US IG CDX 5y
68
US
HY
CDX
5y
336
H
EEU XO CDX 5y
278
48
SSovX WE 5y
ZAR
Low - Risk Aversion - High
AUD
Curr
Peak Date %-ile
26-Nov-08 75
27-Oct-08
74
27-Oct-08
68
27-Oct-08
57
10-Oct-08
50
16-Oct-08
43
16-Oct-08
43
16-Oct-08
40
27-Oct-08
38
20-Nov-08 38
16-Oct-08
37
20-Nov-08 34
20-Nov-08 31
24-Oct-08
31
20-Nov-08 28
16-Oct-08
27
27-Oct-08
27
27-Oct-08
27
28-Oct-08
17
27-Oct-08
13
13-Oct-08
10
29-Oct-08
6
28-Oct-08
3
36
iTraxx Asia ex Jap.
% to
Peak
286
236
273
263
314
273
356
225
242
354
286
382
353
358
308
434
529
402
425
548
607
522
496
368
SovX WE 5y
Overall
Peak
161.7
88.8
92.3
95.4
81.5
75.8
68.0
70.1
77.3
80.9
73.4
72.2
74.1
108.6
78.4
75.9
110.2
113.8
66.9
100.7
83.0
86.6
67.0
87.1
Italy 10y Bond Spr.
1y
Peak
46.7
39.0
39.0
33.6
22.2
23.4
20.1
26.2
26.2
21.4
21.9
18.7
19.7
32.1
23.0
19.6
25.7
34.7
19.2
29.4
16.9
20.7
17.5
26.0
Current %-ile
(Since Jan. 2007)
Since January 2007
Spain 10y Bond Spr.
Chg
(1w)
-0.5
2.1
1.9
1.9
2.5
2.9
2.4
2.0
3.0
3.7
3.4
3.4
3.2
1.9
2.9
1.7
1.6
0.9
2.3
0.3
0.0
1.6
1.2
2.0
Credit Metrics (Levels)
EMCDS
Index
Current
Russia
41.9
Nikkei 225
26.4
TOPIX
24.8
Bovespa
26.3
Germany (DAX)
19.7
Euro Stoxx 50
20.3
Switzerland
14.9
Italy (MIB)
21.5
Spain (IBEX)
22.6
VIX
17.8
France (CAC)
19.0
S&P 500
15.0
NDX
16.4
Em. Mkts. (EEM) 23.7
Russell 2000
19.2
UK (FTSE 100)
14.2
Hang Seng
17.5
China (HSCEI)
22.7
Australia
12.7
India (NIFTY)
15.5
Canada
11.7
KOSPI 200
13.9
Taiwan
11.2
Average
19.5
Current %-ile
(Since Jan. 2007)
Since January 2007
US IG CDX 5y
Equity Vol (1m Implied)
35
30
25
20
29
26
26
24
22 21
19
18 17
15
10
5
0
-5
15 15
13 13 12
11 10
9
8
8
10
8
4
2
0
-1
8
8
12 11
10
7
6
6
5
5
6
4
-2
5
5
3
1
0
-1
Source: Goldman Sachs Global Investment Research.
Goldman Sachs Global Investment Research
9
Download document
document.pdf (PDF, 590.9 KB)
Download PDF
Share this file on social networks
Link to this page
Permanent link
Use the permanent link to the download page to share your document on Facebook, Twitter, LinkedIn, or directly with a contact by e-Mail, Messenger, Whatsapp, Line..
Short link
Use the short link to share your document on Twitter or by text message (SMS)
HTML Code
Copy the following HTML code to share your document on a Website or Blog
QR Code to this page

This file has been shared publicly by a user of PDF Archive.
Document ID: 0000152374.