30 248 1 PB (PDF)
File information
Author: Harrington
This PDF 1.5 document has been generated by Microsoft® Word 2010, and has been sent on pdf-archive.com on 03/02/2015 at 21:09, from IP address 78.105.x.x.
The current document download page has been viewed 1027 times.
File size: 705.62 KB (10 pages).
Privacy: public file


File preview
Journal of Student Research (2012) 1: 23-32
Harmala Alkaloids as Bee Signaling Chemicals
Natalie Harringtona
Harmala alkaloids are pharmaceutically active molecules that can be found in various plants. 1, 7 These alkaloids are
fluorescent molecules in the range of 300-700nm.7 Coincidently, bees have a similar visible range of 300-600nm. 4, 5, 6 This study
takes these observations and interweaves them into a hypothesis: since bees use their sight to find flowers to pollinate, 5 then these
flowers contain harmala alkaloids that would be visible to bees. It can then be inferred harmala alkaloids attract bees. In other
words, harmala alkaloids are functional components of plants. In order to determine harmala alkaloids content, standard solutions
of harmine, harmaline, harmane, harmol, and harmalol will be compared with extractions from plant samples using high
performance liquid chromatography and fluorescence.
A variety of plants were chosen to represent three categories. The first is plants that are found to be insect pollinated,
these include lemon balm (Melissa officinali), common rue (Ruta graveolens), meadow rue (Thalictrum aquilegifolium),
hydrangea (Hydrangea arborescens), spirea (Spirea japonica), forget-me-not (Myosotis scorpioides), blue star grass
(Sisyrinchium augustifolium),6 common rue (Ruta graveolens) and meadow rue (Thalictrum aquilegifolium). The second
category represents wind pollinated plants, including sugar maple (Acer saccharum), white velvet (Tradescantia sillamontana),
meadow rue (Thalictrum ichangense), rhoeo (Rhoeo spathacea).16, 17 Finally, a control was also analyzed. The lady fern
(Athyrium felix-femina) was chosen because it is not genetically related to the plants in categories one or two and is not insect or
wind pollinated.
Following chemical analysis, each of the insect pollinated plants was found to contain harmala alkaloids. The lady fern
(Athyrium felix-femina) contained no harmala alkaloids, as well as the wind pollinated plants. Due to these results as well as a
study of bee behavior, we were able to conclude that harmala alkaloids are present in plants that attract bees. This study both
contributes to an understanding of factors involved in pollination and can be used as a guide for further investigation into a
natural source of harmala alkaloids.
Keywords: Harmala alkaloids, Bee signaling chemicals
Introduction
Harmala alkaloids are found in a number of
plants throughout the world.1, 7 The most abundant source
of these harmala alkaloids is found in the seeds of Syrian
rue (Penganum harmala).The most abundant harmala
alkaloids found in this particular seed are harmaline and
harmine. 1, 7 The potential clinical uses of the harmala
alkaloids found in these seeds range from a monoamine
oxidase inhibitors to cures for Parkinson’s disease.9
Harmala alkaloids can induce tremors in order to study
Parkinson’s disease; in fact, people diagnosed with
Essential Tremor, a mild form of Parkinson’s, have harmala
alkaloids present in their blood naturally.9 Essential tremor
is a disorder of the nervous system, in which small shaking
movements happen during everyday tasks. 19 Using this
property of harmala alkaloids in blood, they can be injected
into laboratory animals to induce tremors for study on their
properties and possible cures.
When an alkaloid is present in a plant, the plant
will taste bitter to insects; therefore, the alkaloids will
sometimes repel insect pests.12 However, observation of
plants known to contain them, such as passion flowers,
demonstrates that not all insects are deterred from the
plant.3 Moths, butterflies, flies, bees can be found on plants
that contain
harmala alkaloids; in fact, bees and
hummingbirds pollinate the passionflower, which is the
most concentrated with harmala alkaloids.20 This leads us
to wonder if there is another purpose for the harmala
alkaloids that are found in plants, other than deterring pest
insects.
Specifically, bees seem be attracted to plants that
contain harmala alkaloids. Bees use their sight and smell to
detect flowers, although only in ultra violet and visible light
spectrum, in which they can detect around 300nm to
600nm.4, 5, 6 It has been determined that the harmala
alkaloids fluoresce in the same range of the spectrum that
the bees can see.3, 7 Harmala alkaloids do not volatize at
ambient temperatures, which means that the bees must be
attracted only by sight to the alkaloids. Due to this and the
correlation between the visible range of bees and the
fluorescence of harmala alkaloids, we expected that the
bees would be attracted to the plants that require insect
pollination and that many of these will contain harmala
alkaloids.
From casual observation of these plants, it has
been observed that bees are attracted to the lemon balm
(Melissa officinali), common rue (Ruta graveolens),
hydrangea (Hydrangea arborescens), spirea (Spirea
japonica), forget-me-not (Myosotis scorpioides) and blue
star grass (Sisyrinchium augustifolium)6; whereas, bees are
not attracted to the sugar maple (Acer saccharum), white
velvet (Tradescantia sillamontana), meadow rue
23
a.
Central College in Pella, IA
Journal of Student Research (2012) 1: 23-32
(Thalictrum ichangense), rhoeo (Rhoeo spathacea) and
lady fern (Athyrium felix-femina). 16, 17 Therefore, it was
hypothesized plants that do not attract bees will not contain
harmala alkaloids or emit light in bees visible range of 300600nm.
form a calibration curve. A fluorescence scan of the
meadow rue (Thalictrum aquilegifolium) gave the intensity
of the signal, which was plotted as a calibration curve to
yield the concentration of each of the harmala alkaloids in
the plant material.
The plants were dived into three categories to
promote a varied data collection. The first was plants that
are found to be insect pollinated, these included lemon
balm (Melissa officinali), common rue (Ruta graveolens),
meadow rue (Thalictrum aquilegifolium), hydrangea
(Hydrangea arborescens), spirea (Spirea japonica), forgetme-not (Myosotis scorpioides), blue star grass
(Sisyrinchium augustifolium),6 common rue (Ruta
graveolens) and meadow rue (Thalictrum aquilegifolium).
The second category represents wind pollinated plants,
including sugar maple (Acer saccharum), white velvet
(Tradescantia sillamontana), meadow rue (Thalictrum
ichangense), rhoeo (Rhoeo spathacea).16, 17 The two
meadow rue plants are from the same genus; however, the
meadow rue (Thalictrum aquilegifolium) is insect
pollinated and the meadow rue (Thalictrum ichangense)
contains spores that make it wind pollinated. The role of
these two taxonomically related plants is to determine if
harmala alkaloid content is based on genetics. They were
also included in the study because Syrian rue (Penganum
harmala) is a rich source of harmala alkaloids. Finally the
third category, a control, was also analyzed. The lady fern
(Athyrium felix-femina) was chosen because it is not
genetically related to the plants in categories one or two
and is not insect or wind pollinated.
Methods
In order to begin the procedure, the harmala
alkaloids were extracted from the plant material. This was
done by the low environmental impact method described in
previous research by Dr. Haustein and her students.3 The
extraction process took us from plant material to a useable
solid containing harmala alkaloids. In order to determine
which specific harmala alkaloids were in the sample, the
HPLC (high performance liquid chromatography) was
conducted using standard procedures established by
previous studies at Central College.3 The molecules
traveled through a chromatography column, where each
molecule exited the column according to its non polar
interactions with the stationary phase C18 inside the column
(the time it takes the molecule to travel the length of the
column is called the retention time). By comparing the
retention times of the standards of harmala alkaloids, the
content of an each plant species was observed. This
determined if there were harmala alkaloids (or related
alkaloids) in the plant. From here, fluorescence scan of the
plant’s alkaloid content determined if these harmala
alkaloids are visible to the bees.
A quantitative analysis of harmala alkaloid
content for each of the species in the plant was helpful. A
quantitative analysis on the meadow rue (Thalictrum
aquilegifolium) plant, that is known to contain harmala
alkaloids, was conducted. This was done by performing
several fluorescence scans of standards of harmala
alkaloids found in meadow rue (Thalictrum aquilegifolium)
at various concentrations. These were plotted together to
Each of the plant samples were grown
organically, without the use of compound altering
chemicals. The meadow rue (Thalictrum aquilegifolium),
lady fern (Athyrium felix-femina), hydrangea (Hydrangea
arborescens), sugar maple (Acer saccharum), lemon balm
(Melissa officinali), blue star grass (Sisyrinchium
augustifolium) and forget-me-not (Myosotis scorpioides)
were from the garden of Dr. Haustein. The meadow rue
(Thalictrum ichangense), white velvet (Tradescantia
sillamontana), and rhoeo (Rhoeo spathacea) were from Dr.
Mary Stark's greenhouse. The spirea (Spirea japonica) was
from Natalie Harrington’s garden, and finally the common
rue (Ruta graveolens) came from Mountain Rose Herbs.
The standards for the quantitative and qualitative
analysis were obtained from Sigma-Aldrich. A HP 1110
High Performance Liquid Chromatography using a 250mm
by 4.6mm Phenomenex C-18 Luna column and a 20 µL
injection loop was used in accordance with an ultravioletvisible detection at a wavelength of 340nm. The column
had constant temperature of 30 °C. Flow rate was 1
mL/min. Each analyte’s retention time varied depending on
the strength of its interactions with the stationary phase, the
ratio of solvents used, and the flow rate of the mobile
phase. For this experiment, the mobile phase was set to a
gradient of DI water and methanol to optimize the retention
times. This gradient was a 1:3 mixture of DI water and pure
methanol respectively for 2 minutes; followed by methanol
for the remaining 8 minutes. To confirm the qualitative
analysis and provide quantitative analysis, the Cary Eclipse
Fluorescence Spectrometer was used. This was conducted
at varying excitation and emission wavelengths for each
harmala alkaloid.
The extraction process can be viewed as a flow
chart in Appendix I . For each sample, the extraction
process began by grinding the plant material in a coffee
grinder until finely grated. The plant material was massed;
then, transferred into a 100 mL beaker. To the beaker, 5
times the mass of the ground plant in mL of a 30% acetic
acid was added. For example, if the mass was 2.42g, the
amount added was approximately 23 mL. This was stirred
for 5 minutes on a stir plate. After the 5 minutes, the
solution was vacuum filtered with a Buchner funnel and the
plant material was discarded. At this point, the desired
harmala alkaloids have now been acidified. This causes the
chemical species to be protonated into a positively charged
salt. A salt can be dissolved into an aqueous layer which is
important for the next step of separation. To the species, a
solution of 50 mL of hexanes and 50 mL of ethyl acetate
were added to wash the species through separation a total
of 3 times. The solutions were mixed in the separatory
funnel by way of inversion. The organic layer rose to the
top and separate from the aqueous layer. The harmalas
24
Journal of Student Research (2012) 1: 23-32
were present in the aqueous layer, so it was separated from
the bottom layer into a separate beaker from the organic
layer.
The next part of purification was to alter the
alkaloids in the aqueous layer to make it dissolve in the
organic layer to remove any other impurities. This was
done by basification. In order to make the solution neutral
again, saturated sodium bicarbonate was added drop wise
until the solution showed basic (green, pH≈8) on pH paper.
The neutral harmala alkaloids were then dissolved in the
organic layer. Another separation was conducted using
100mL of ethyl acetate as an extracting solution. The
organic layer was collected and dried using sodium sulfate,
until it stops to clump, to remove any extra water. The
harmala alkaloids were in the organic layer with all
impurities removed. Next, clumps of sodium sulfate in the
solution were removed by filtering it into a pre-weighed
round bottom flask with a glass funnel with a cotton ball.
This was washed with the hexanes to ensure that all of the
harmalas make it into the round bottom flask. In order to
get the harmalas from the solvent, the solution was placed
on a rotary evaporation aspirator. Once the solvent was
removed, the flask contained only a small amount of solid.
In order to use this material for testing, it was dissolved in
10mL of methanol.
The standards were obtained from SigmaAldrich. Solutions were made by diluting each alkaloid (
harmine, harmaline, harmane, harmol, and harmalol) with
methanol. The solutions for the HPLC were created by
dissolving .0125 g of each harmala alkaloid with methanol
in a 100mL volumetric flask. This created a total of 5
different solutions that are approximately equal to the
concentration previously found in a plant sample. The other
concentrations for the fluorescence analysis were using this
solution and making further dilutions.
The extraction process took us from plant
material to analyzable solid containing harmala alkaloids.
In order to determine which specific harmala alkaloids
were in the sample, the HPLC was used. By comparing the
retention times of the standards of harmala alkaloids, the
content of an unknown can be observed. Once the content
of the plant sample was predicted, each plant extract was
tested with fluorescence to confirm its harmala alkaloid
content. In order to do this, fluorescence emission
intensities were observed for each extract. Once each
sample has been qualitatively analyzed for its harmala
alkaloid content, it is important to know how much of the
alkaloid is present in a given sample. This quantitative
analysis was done for the meadow rue (Thalictrum
aquilegifolium). The emission intensity was related to
concentrations via a calibration curve. In order to do the
analysis, a slit width of 2.5nm and an excitation wavelength
were used. The emission wavelengths that were used were
374 nm for harmaline and 420 for harmine. Once the
coordinates were plotted, a calibration line was made. By
substituting the intensities of the unknown meadow rue
sample with the same constraints into the equation, the
concentration of harmala alkaloid in meadow rue
(Thalictrum aquilegifolium) was determined.
Results and Discussion
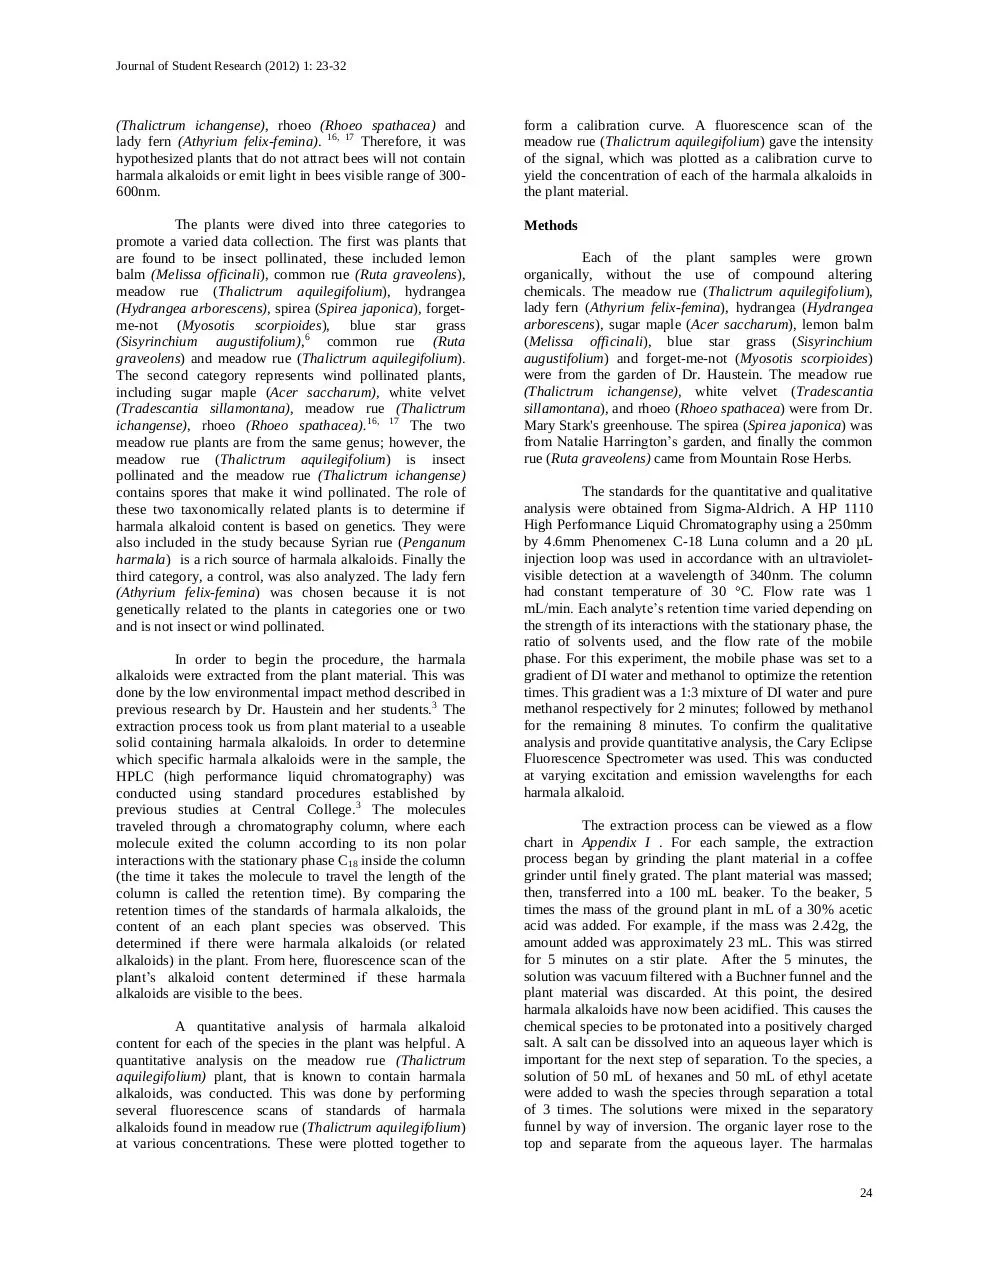
For the HPLC analysis, each standard was
injected onto the chromatography column. Depending on
the polarity of the molecule, it took a specific time for the
molecule to travel the column. This time is called the
retention time. A sample chromatogram for harmane is
shown below in Figure 1.
Figure 1: Harmane Sample HPLC Chromatogram
Each of the standard harmala alkaloids has a similar
chromatogram; the retention times from these standards are
shown in Table 1.
Table 1: Harmala Alkaloid Standard Retention Times
Standard
TR (min)
Harmalol
3.2297
Standard
Deviation (min)
.021
Harmane
4.135
.042
Harmine
3.929, 4.48
.033, .026
Harmaline
3.465
.050
Harmol
3.493
.029
Where N=6 for all standards
In order to qualitatively determine the molecules
present in our plant samples, we must compare the
retention times of our plant chromatograms to these
standards shown in Figure 1. This is done in the following
manner for the meadow rue (Thalictrum aquilegifolium)
plant. The following is Figure 2, showing the HPLC
chromatogram and the retention times for the peaks of the
unknown meadow rue (Thalictrum aquilegifolium) sample.
25
Journal of Student Research (2012) 1: 23-32
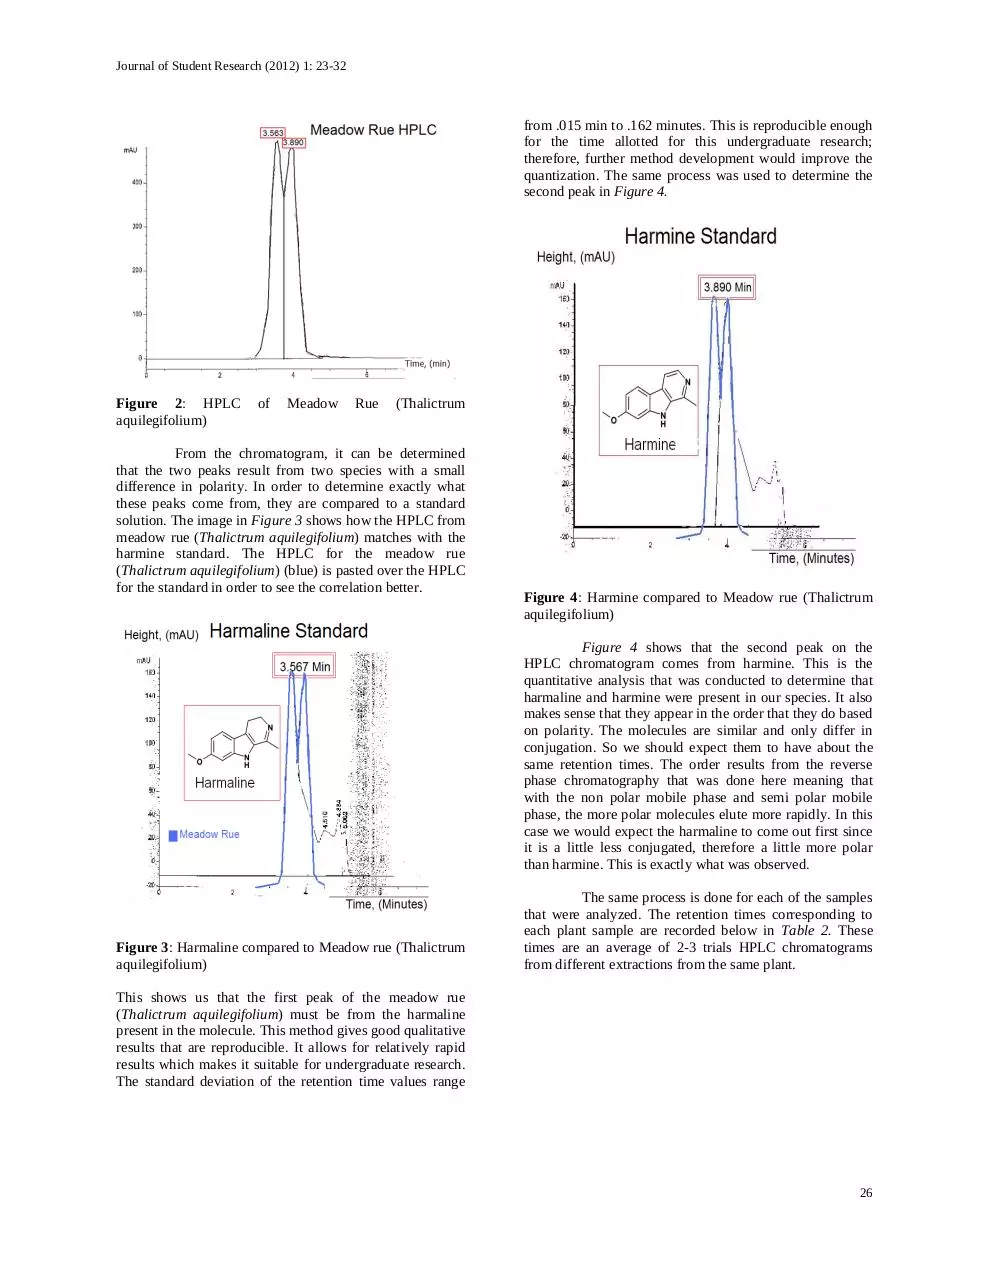
from .015 min to .162 minutes. This is reproducible enough
for the time allotted for this undergraduate research;
therefore, further method development would improve the
quantization. The same process was used to determine the
second peak in Figure 4.
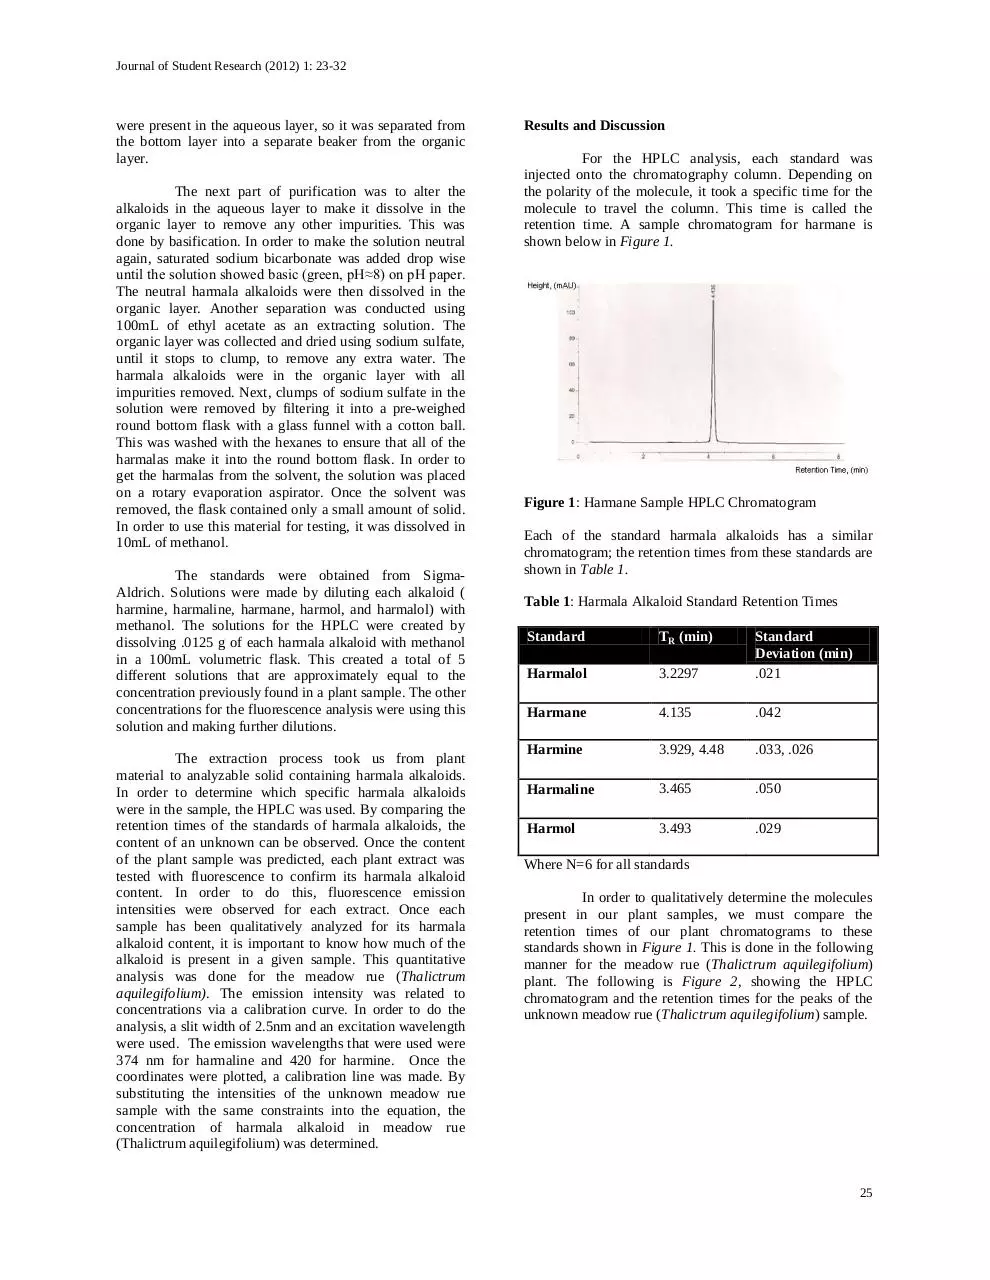
Figure 2: HPLC
aquilegifolium)
of
Meadow
Rue
(Thalictrum
From the chromatogram, it can be determined
that the two peaks result from two species with a small
difference in polarity. In order to determine exactly what
these peaks come from, they are compared to a standard
solution. The image in Figure 3 shows how the HPLC from
meadow rue (Thalictrum aquilegifolium) matches with the
harmine standard. The HPLC for the meadow rue
(Thalictrum aquilegifolium) (blue) is pasted over the HPLC
for the standard in order to see the correlation better.
Figure 4: Harmine compared to Meadow rue (Thalictrum
aquilegifolium)
Figure 4 shows that the second peak on the
HPLC chromatogram comes from harmine. This is the
quantitative analysis that was conducted to determine that
harmaline and harmine were present in our species. It also
makes sense that they appear in the order that they do based
on polarity. The molecules are similar and only differ in
conjugation. So we should expect them to have about the
same retention times. The order results from the reverse
phase chromatography that was done here meaning that
with the non polar mobile phase and semi polar mobile
phase, the more polar molecules elute more rapidly. In this
case we would expect the harmaline to come out first since
it is a little less conjugated, therefore a little more polar
than harmine. This is exactly what was observed.
Figure 3: Harmaline compared to Meadow rue (Thalictrum
aquilegifolium)
The same process is done for each of the samples
that were analyzed. The retention times corresponding to
each plant sample are recorded below in Table 2. These
times are an average of 2-3 trials HPLC chromatograms
from different extractions from the same plant.
This shows us that the first peak of the meadow rue
(Thalictrum aquilegifolium) must be from the harmaline
present in the molecule. This method gives good qualitative
results that are reproducible. It allows for relatively rapid
results which makes it suitable for undergraduate research.
The standard deviation of the retention time values range
26
Journal of Student Research (2012) 1: 23-32
Table 2: HPLC Retention Times of Plant Samples (For each plant, N=3)
1
2
3
Plant Sample
TR (min)
StDev (min)
Lemon balm (Melissa officinali)
3.131
3.938
.020
.033
Hydrangea (Hydrangea arborescens)
3.233
3.476
.015
.067
Spirea (Spirea japonica)
3.074
3.311
.102
.082
Blue star grass (Sisyrinchium augustifolium)
3.132
3.230
.125
.056
Forget-me-not (Myosotis scorpioides)
3.291
3.752
.232
.325
Common Rue (Ruta graveolens)
3.474
Meadow Rue (Thalictrum aquilegifolium)
3.563
3.890
.105
Meadow Rue (Thalictrum ichangense)
3.121
3.604
.153
. 129
Sugar maple (Acer saccharum)
3.089
3.227
.086
.111
White velvet (Tradescantia sillamontana)
3.260
3.668
.096
.099
Rhoeo (Rhoeo spathacea)
3.115
3.331
.102
.103
Lady fern (Athyrium felix-femina)
4.105
.085
.126
.162
Key: 1-Insect Pollinated, 2-Wind pollinated, 3-Control
Now that we have all of the sample retention times, these times can be matched to the standards with very similar
retention times from Table 1. They may all seem to match the standards, but they are confirmed using fluorescence. Each of the
standards will emit light at a specific wavelength. This is found using the fluorescence emission spectra. The average emission
wavelengths are shown below in Table 3, based on the excitation wavelength of 340nm.
Table 3: Standard Emission Wavelengths of Harmala Alkaloids (Where N=6, for each standard)
Standard
λemission (nm)
StDev (nm)
Harmine
375
1.04
Harmaline
490
1.22
Harmalol
475
1.32
Harmane
380
1.41
Harmol
410
.99
The emission of each plant sample was recorded and compared to the standards above. In some cases, the plant was found to
have no fluorescent molecules in it; if this is the case, then none is recorded in the table. The results can be seen in Table 4.
Table 4: Emission Wavelengths of Plant Samples (Where N=3 for each plant sample)
1
2
3
Plant Sample
Lemon balm (Melissa officinali)
Hydrangea (Hydrangea arborescens)
Spirea (Spirea japonica)
Blue star grass (Sisyrinchium augustifolium)
λem (nm)
381.84
426.96
410.00
670.00
StDev (nm)
2.22
2.12
1.41
.500
Insect Pollinated
Yes
Yes
Yes
Yes
Forget-me-not (Myosotis scorpioides)
418.93
1.98
Yes
Common Rue (Ruta graveolens)
458.93
1.12
Yes
Meadow Rue (Thalictrum aquilegifolium)
365, 483
1.00, .98
Yes
Meadow Rue (Thalictrum ichangense)
None
None
No
Sugar maple (Acer saccharum)
None
None
No
White velvet (Tradescantia sillamontana)
Rhoeo (Rhoeo spathacea)
None
None
None
None
No
No
Lady fern (Athyrium felix-femina)
None
None
No
Key: 1-Insect Pollinated, 2-Wind pollinated, 3-Control
27
Journal of Student Research (2012) 1: 23-32
The plant samples that are shown to fluoresce were expected to have harmala alkaloids in them according to the
hypothesis that these plants attract bees. This means that the plants in the first category that are insect pollinated all contained
harmala alkaloids. In the opposite manner, the wind pollinated did not fluoresce. Similarly, the lady fern contained no fluorescent
molecules. Each of the plants that contained fluorescent components was compared with the standards in the areas of retention
time and emission wavelength in order to make a qualitative analysis. By comparing the retention time closest to the standard and
the fluorescence, the standard that is present in the sample can be noted. This comparison and determination is shown in Table 5.
Table 5: Qualitative Analysis of Plants Containing Harmala Alkaloids
λem (nm)
Standard
Lemon balm (Melissa officinali)
TR
(min)
3.938
Harmine
Std TR
(min)
3.929
Std λem
(nm)
375
381.84
Hydrangea (Hydrangea arborescens)
3.476
426.96
Harmol
3.493
410
Spirea (Spirea japonica)
3.311
410
Harmol
3.493
410
Blue star grass (Sisyrinchium augustifolium)
3.23
670
Outside range
Forget-me-not (Myosotis scorpioides)
3.291
418.93
Harmol
3.493
410
Common Rue (Ruta graveolens)
3.474
458.93
Harmaline
3.465
490
Meadow Rue (Thalictrum
3.89
365
Harmine
3.929
375
aquilegifolium)
3.563
483
Harmaline
3.465
490
Meadow Rue (Thalictrum ichangense)
3.604
None
None
None
None
Sugar maple (Acer saccharum)
3.227
None
None
None
None
White velvet (Tradescantia sillamontana)
3.668
None
None
None
None
Rhoeo (Rhoeo spathacea)
3.331
None
None
None
None
Lady fern (Athyrium felix-femina)
4.105
None
None
None
None
#
Plant Sample
1
2
3
Key: 1-Insect Pollinated, 2-Wind pollinated, 3-Control
As previously discussed, columbine meadow rue
(Thalictrum aquilegifolium) contains both harmaline and
harmine. As shown in Table 5, harmol is present in the
hydrangea (Hydrangea arborescens), spirea (Spirea
japonica), and forget-me-not (Myosotis scorpioides).
Lemon balm (Melissa officinali) contains harmine and the
common rue (Ruta graveolens) has harmaline. The
fluorescence that was observed for the blue star grass
(Sisyrinchium augustifolium) was outside of the range that
harmala alkaloids are present. This simply means that
something else is contained in the plant species that is
fluorescent. When something emits a wavelength that is in
the visible range, a color with corresponding intensity is
displayed. In the case of the blue star grass (Sisyrinchium
augustifolium), its emission does not lie where bees can
see, but it is bright blue to the eye. These emissions in this
study lie in the visible light spectrum, so each of these
emissions corresponds with a color as shown in Table 6.
Table 6: Visible Light Spectrum
Color
Wavelength (nm)
Red
635-700
Orange
590-635
Yellow
560-590
Green
490-560
Blue
450-490
Violet
380-450
28
Journal of Student Research (2012) 1: 23-32
Table 7: Corresponding Color Based on Emission
Wavelength
Harmine
λem
(nm)
381.84
Color of
Emission
Violet
Harmol
426.96
Violet
Harmol
410
Violet
Harmaline
458.93
Blue
Plant
Standard
Lemon
balm
(Melissa
officinali)
Hydrangea
(Hydrangea
arborescens)
Spirea (Spirea
japonica)
Common
Rue
(Ruta
graveolens)
Blue star grass
(Sisyrinchium
augustifolium)
Forget-me-not
(Myosotis
scorpioides)
Meadow
Rue
(Thalictrum
aquilegifolium)
None
670
Blue
Harmol
418.93
Violet
Harmaline
483
Blue
In order to understand how close these
observations are to determining the harmala alkaloid
present in the plant, the percent errors have been calculated
below in Table 8. This is the percentage that the actual
value that was achieved in the lab deviates from the
theoretical value of the standard.
Table 8: Percent Error Calculation
%error=((Actual-Theoretical)/Theoretical)*100%
Plant Sample
Lemon
balm
(Melissa
officinali)
Hydrangea
(Hydrangea
arborescens)
Spirea (Spirea japonica)
Common
rue
(Ruta
graveolens)
Blue
star
grass
(Sisyrinchium augustifolium)
Forget-me-not
(Myosotis
scorpioides)
Meadow Rue (Thalictrum
aquilegifolium)
Percent
Error
TR (%)
0.23%
Percent
Error
λem (%)
6.07%
0.49%
4.14%
5.21%
0
0.26%
6.34%
N/A
N/A
5.78%
2.18%
2.83%
1.43%
.99%
1.39%
The calculations above show that all results are
within 6.5% or less of the accepted value. In the case of the
spirea (Spirea japonica), the emission wavelengths
observed from the plant sample were the exact same as the
standard. This shows a 0% error. This means that if spirea
(Spirea japonica) contains a harmala alkaloid, it is 100%
certain, that it is harmol.
In each of the plants, there may also be other
unknown chemical components that have a similar polarity
to harmala alkaloids. This is why the HPLC of some
species show peaks on the HPLC, but the plants did not
contain harmala alkaloids. This is why the fluorescence is
done to confirm that the resultant peaks on the HPLC are
actually harmala alkaloids that are present in the plant
sample. In fact, there are over 110 chemicals in the
meadow rue (Thalictrum aquilegifolium) alone. 11
In order to derive an idea if pollinating insects are
attracted to harmala alkaloids, other external factors, such
as competing fragrances and other unknown alkaloids,
should be eliminated. In a brief study of bee behavior, two
test tubes containing apricot nectar (to attract bees by sense
of smell) were placed in a test tube rack. These tubes were
fitted with two circles of paper the same size on their necks.
These were the exact same size and pattern to eliminate
other external factors that would cause the bees to favor
one over the other. On one circle, methanol was painted in
an asterisk pattern. The other test tube, containing the
second circle, was painted in the same pattern; however,
this time the methanol had harmaline and harmine
dissolved in it.
The one painted with only methanol was the
control, whereas the one with harmala alkaloids was to
attract pollinating insects. Two parties that did not know
which test tube contained harmala alkaloids were asked to
observe what happened, as to avoid prejudices. A total of 6
bees came to the area of this trial within two hours. Of the
6, 5 landed on the one with the harmala alkaloids. The
other bee seemed only to circle around the one with the
alkaloids, but did not land on either test tube. In this two
hour time frame, no bee landed on the one with only
methanol. This study was conducted in the sun on a day
where the temperature was approximately 20°C. This
demonstrates, in a control case, with all outside factors
eliminated, bees seem to prefer harmala alkaloids.
Another study under similar conditions repeated.
A set of two test tubes in a rack were done with the same
size of paper and asterisk pattern painted on them. Instead
of using apricot nectar, this trial used sugar water. The
sugar water will not draw the insects based on sight, and
has no fluorescence to eliminate the chance that this would
affect their vision. Like the first trial, tube 1’s collar was
marked with only methanol as the control. The second was
painted with harmala alkaloids dissolved in methanol. The
study was conducted on a warm, end of summer day;
therefore, bees were easily found in a nearby garden.
In twenty minutes of observation, the observer
counted 11 bees to land on the paper containing harmala
alkaloids. Three landed on the one with only methanol. The
methanol was just a control to ensure that the same pattern
was painted on the paper, as well as to know that only the
29
Journal of Student Research (2012) 1: 23-32
harmala alkaloids were the factor differing from one tube to
the next. Since bees still seemed to land on the methanol, it
shows that methanol is not a deterrent. When the positions
of the tubes were exchanged, the bees seemed to visit each
one about 50% of the time. Since in this case, there was no
preference, this study must be revisited. For the purpose of
this preliminary experiment, it seems as though there is a
connection between harmala alkaloids and pollinating
insects. This does not necessarily prove that bees are
attracted to harmala alkaloids; it shows that this is a pattern
that should be further explored.
Table 9: Building the Calibration Curve
Now qualitatively, the contents of the plant have
been determined within a reasonable amount of error. Next,
the columbine meadow rue (Thalictrum aquilegifolium),
was analyzed quantitatively. This way the exact amount of
harmine and harmaline can be determined for the common
rue. Meadow rue was chosen because it was readily
available and contained two harmala alkaloids with small
deviations. This quantitative analysis is done by observing
the intensity for a specific concentration of a standard. An
example of the spectrum used in the fluorescence analysis
is shown below in Figure 5.
Emission Spectra Calibration Curve Conc vs Intensity of
Standards
HARMINE
HARMALINE
Standard
Intensity,
(a,u)
30.74
Standard
1
Conc.,
(ppm)
1.27
1
Conc.,
(ppm)
1.25
Intensity,
(a,u)
92
2
5.08
141
2
2.5
129
3
6.35
270
3
3.75
256
4
7.62
305.2
4
5
342
5
12.7
589
5
6.25
409.5
6
12.5
721
This data shows how the calibration curves below in Figure
6 for harmaline and Figure 7 for harmine were modeled.
Intensity, (a,u)
Calibration Curve for Harmaline
y = 56.98x + 28.148
R² = 0.9853
800
600
400
200
0
0
5
10
15
Concentration, (ppm)
Figure 6: Calibration Curve for Harmaline
Figure 5: Sample Fluorescence Spectrum
Calibration Curve for Harmine
y = 50.023x - 63.164
R² = 0.9768
800
Intensity, (a,u)
From this spectrum, it can be determined that for this
concentration of 125ppm, an intensity of 483 is observed.
This means that in the calibration curve, a data point of
(125ppm concentration, 483 a.u. intensity) can be added.
The data for the calibration curve for both harmine and
harmaline is shown below in Table 9.
600
400
200
0
0
5
10
15
Conc., (ppm)
Figure 7: Calibration Curve for Harmine
30
Journal of Student Research (2012) 1: 23-32
These calibration curves have fairly high
correlation for raw data. This means that the data is stable
enough to use the line equations to determine a
concentration of the harmine and harmaline in the sample.
This calculation is done in Table 10.
Table 10: Concentration Calculation
Harmaline
Harmine
Intensity=56.98
(Conc) +28.148
Data for Meadow rue
Intensity, (a,u) = 654 a.u.
654=57.0 (Conc) +28.1
Concentration= 11.0 ppm
Intensity=50.023
(Conc)-63.164
Data for Meadow rue
Intensity, (a,u) = 483 a.u.
483=50.0 (Conc)-63.2
Concentration= 10.9 ppm
From these calculations, the meadow rue
(Thalictrum aquilegifolium), contained a concentration of
11ppm harmaline and 11 ppm harmine. This was possible
through the calibration curve. These numbers have an error
of .1ppm associated with them due to this calculation.
Another extraction of meadow rue (Thalictrum
aquilegifolium) was done to confirm this data; however, the
sample size was only .05g so it was hard to get the sample
to achieve the same results. The harmine was found in the
second sample in similar concentrations of 8ppm; however,
the second trial did not contain harmaline in any
concentration. All of the other plant samples containing
harmala alkaloids were highly reproducible. In fact, for
each of the plants, the average of 3 plant samples is what is
shown in the data tables.
Conclusions
Harmala alkaloid standards harmine, harmaline,
harmane, harmol, and harmalol were compared with the
plant
sample
using
high
performance
liquid
chromatography and fluorescence. The following plants
contained harmala alkaloids: lemon balm (Melissa
officinali), hydrangea (Hydrangea arborescens), spirea
(Spirea japonica), common rue (Ruta graveolens), forgetme-not (Myosotis scorpioides), and meadow rue
(Thalictrum aquilegifolium). Of these, hydrangea
(Hydrangea arborescens), spirea (Spirea japonica), and
forget-me-not (Myosotis scorpioides) contained harmol.
Lemon balm (Melissa officinali) contains harmine and the
common rue (Ruta graveolens) has harmaline.
The meadow rue (Thalictrum aquilegifolium
)contained both harmaline and harmine. Calibration curves
were constructed to find the concentration of the each of
the harmala alkaloids in this plant species. This showed that
about 11ppm of harmaline and 11ppm of harmine are
present in a sample of meadow rue (Thalictrum
aquilegifolium). This is helpful to know if there was ever
an increased need for harmala alkaloids in pharmaceuticals
or other areas.
The second category containing the wind
pollinated sugar maple (Acer saccharum), white velvet
(Tradescantia sillamontana), meadow rue (Thalictrum
ichangense), and rhoeo (Rhoeo spathacea) did not contain
harmala alkaloids. The genetic relationship between the
wind pollinated meadow rue and the columbine insect
pollinated rue was also analyzed. This study showed that
genetics do not play a role in harmala alkaloid content. The
pattern observed was strictly based on insect pollinated and
wind pollinated. The insect pollinated contained harmala
alkaloids and wind pollinated did not contain them.
Bees use sight in the range of 300-600nm and
smell to find flowers. The plants in this study that are insect
pollinated were found to fluoresce in the region of 380480nm. This falls directly into the sight range of the bees.
The insect pollinated plants lemon balm (Melissa
officinali), hydrangea (Hydrangea arborescens), spirea
(Spirea japonica), common rue (Ruta graveolens), forgetme-not (Myosotis scorpioides), and meadow rue
(Thalictrum aquilegifolium) all contain harmala alkaloids in
the visual region of the bees. Finally, a control that is not
insect pollinated is the lady fern (Athyrium felix-femina)
was analyzed. No harmala alkaloids were found in this
plant.
Bees are not attracted to the lady fern, so it fits in
with our hypothesis. In the bee observation experiment, it
appeared that bees went to the test tube with the paper
containing harmala alkaloids; they did not visit the control
methanol as frequently. Given the evidence that we have
proposed, it seems that bees are attracted to plants that
contain harmala alkaloids. Further investigation should be
conducted, but at this point there is no evidence to support
the opposite.
This study has implications in the
understanding of pollination. It is also important in
identifying which plants contain the pharmaceutically
interesting harmala alkaloids.
Acknowledgements
I would like to thank the Monticello College
Foundation for their generous funding for our research
project, as well as Central College for their resources. I
would also like to thank Ashley Cruikshank who assisted
me with all of my data collection.
Bibliography
1.
2.
3.
Bergner, Paul. "Passiflora: Passion flower."
Medical Herbalism. N.p., n.d. Web. 22 Oct.
2010.<medherb.com/materia_Medica/passiflora_
-_Passion fllower_.htm>.
Bielawski, Melissa. "How Do Bees Find
Flowers? | eHow.com." eHow | How to Videos,
Articles & More - Trusted Advice for the Curious
Life | eHow.com. N.p., n.d. Web. 8 July 2011.
<http://www.ehow.com/about_6505858_do-beesflowers_.html>.
Brobst, Alyssa, Jeremy Lewis, Brian Klett,
Cathy Haustein, and James Shriver. "The Free
Base Extraction of Harmaline from Penganum
31
Download 30-248-1-PB
30-248-1-PB.pdf (PDF, 705.62 KB)
Download PDF
Share this file on social networks
Link to this page
Permanent link
Use the permanent link to the download page to share your document on Facebook, Twitter, LinkedIn, or directly with a contact by e-Mail, Messenger, Whatsapp, Line..
Short link
Use the short link to share your document on Twitter or by text message (SMS)
HTML Code
Copy the following HTML code to share your document on a Website or Blog
QR Code to this page

This file has been shared publicly by a user of PDF Archive.
Document ID: 0000207320.