FINAL RPS North Carolina (PDF)
File information
Title: Microsoft Word - Final Text.docx
This PDF 1.6 document has been generated by Word / Mac OS X 10.10.1 Quartz PDFContext, and has been sent on pdf-archive.com on 17/03/2015 at 18:16, from IP address 73.20.x.x.
The current document download page has been viewed 824 times.
File size: 1.56 MB (30 pages).
Privacy: public file


File preview
RANDY T SIMMONS PH.D
Utah State University
RYAN M. YONK PH.D
Utah State University
TYLER BROUGH PH.D
Utah State University
KEN SIM
Strata Policy
JACOB FISHBECK
Strata Policy
RENEWABLE PORTFOLIO STANDARDS:
NORTH CAROLINA
FINAL REPORT | FEBRUARY 2015
RENEWABLE PORTFOLIO STANDARDS:
NORTH CAROLINA
PRIMARY INVESTIGATORS:
Randy T Simmons, PhD
Utah State University
Ryan M. Yonk, PhD
Utah State University
Tyler Brough, PhD
Utah State University
Ken Sim, MS
Strata Policy
Jacob Fishbeck
Strata Policy
STRATA POLICY
255 South Main Street
Logan, Utah 84332
www.strata.org
Institute of Political Economy, Utah State University
|
1
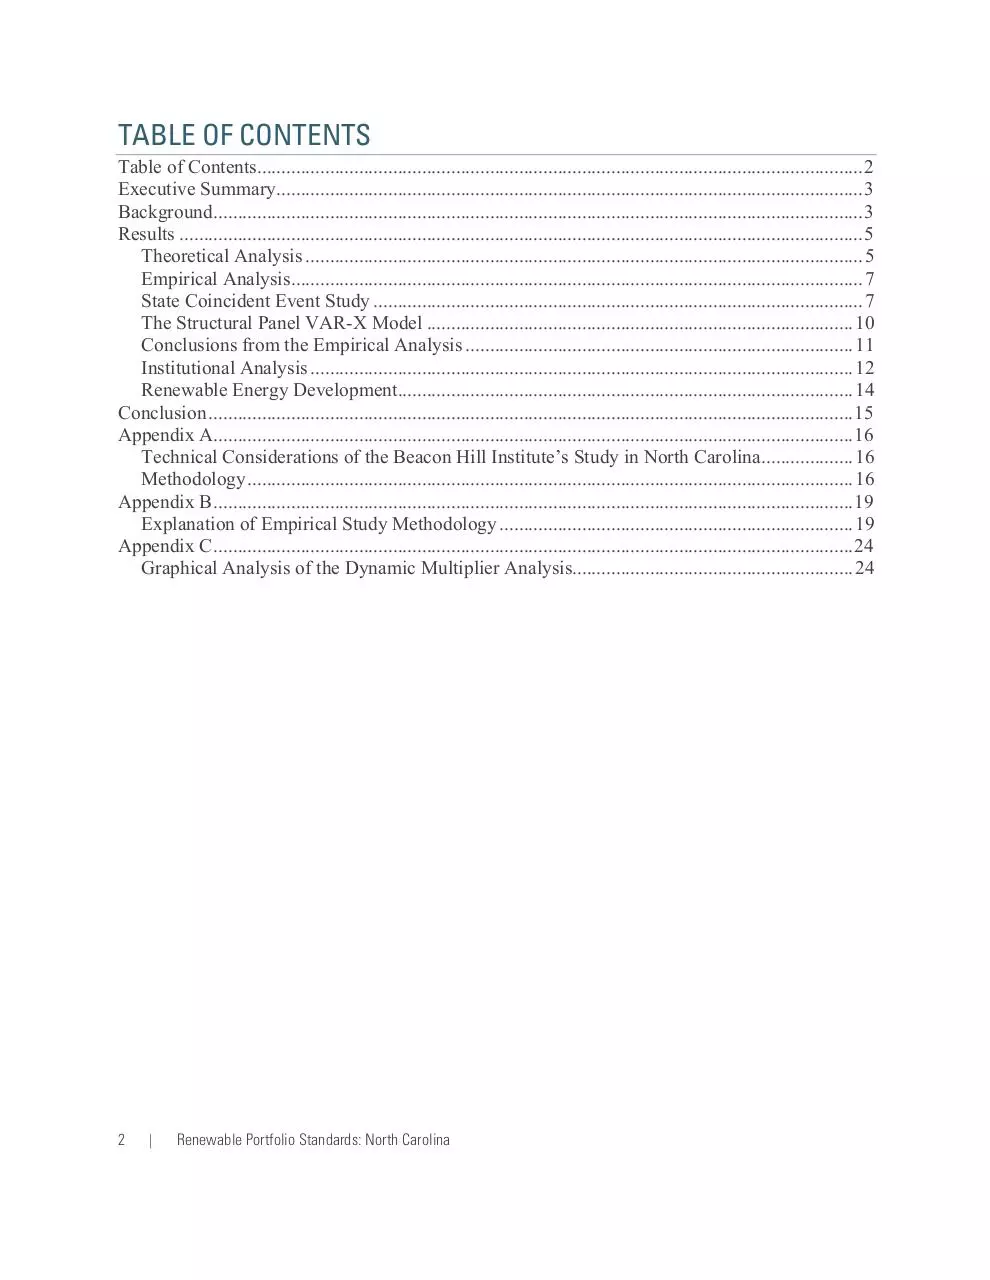
TABLE OF CONTENTS
Table of Contents............................................................................................................................. 2
Executive Summary ......................................................................................................................... 3
Background ...................................................................................................................................... 3
Results ............................................................................................................................................. 5
Theoretical Analysis ................................................................................................................... 5
Empirical Analysis...................................................................................................................... 7
State Coincident Event Study ..................................................................................................... 7
The Structural Panel VAR-X Model ........................................................................................ 10
Conclusions from the Empirical Analysis ................................................................................ 11
Institutional Analysis ................................................................................................................ 12
Renewable Energy Development.............................................................................................. 14
Conclusion ..................................................................................................................................... 15
Appendix A.................................................................................................................................... 16
Technical Considerations of the Beacon Hill Institute’s Study in North Carolina................... 16
Methodology ............................................................................................................................. 16
Appendix B .................................................................................................................................... 19
Explanation of Empirical Study Methodology ......................................................................... 19
Appendix C .................................................................................................................................... 24
Graphical Analysis of the Dynamic Multiplier Analysis.......................................................... 24
2
|
Renewable Portfolio Standards: North Carolina
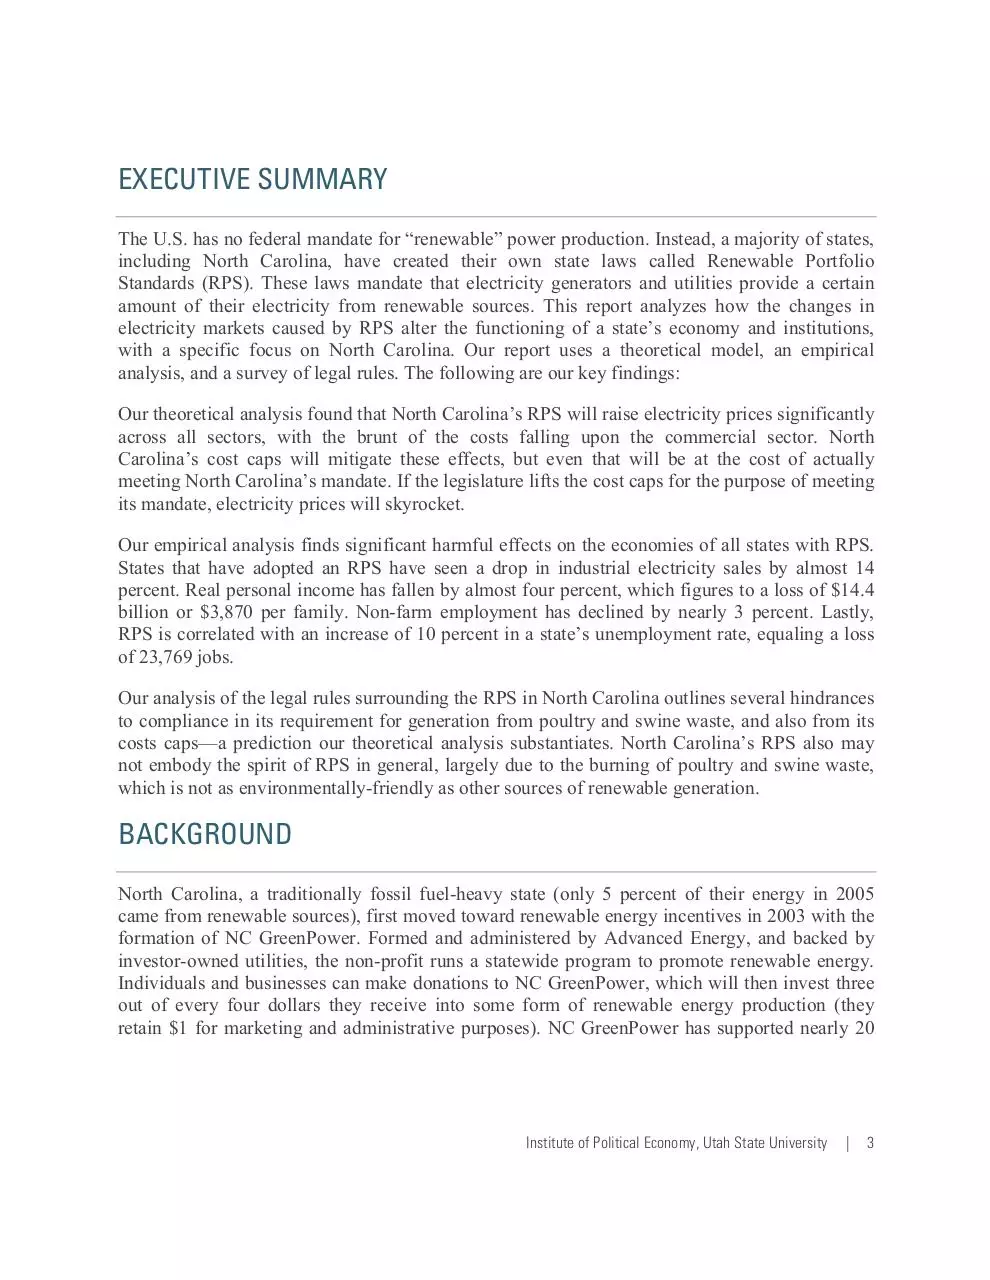
EXECUTIVE SUMMARY
The U.S. has no federal mandate for “renewable” power production. Instead, a majority of states,
including North Carolina, have created their own state laws called Renewable Portfolio
Standards (RPS). These laws mandate that electricity generators and utilities provide a certain
amount of their electricity from renewable sources. This report analyzes how the changes in
electricity markets caused by RPS alter the functioning of a state’s economy and institutions,
with a specific focus on North Carolina. Our report uses a theoretical model, an empirical
analysis, and a survey of legal rules. The following are our key findings:
Our theoretical analysis found that North Carolina’s RPS will raise electricity prices significantly
across all sectors, with the brunt of the costs falling upon the commercial sector. North
Carolina’s cost caps will mitigate these effects, but even that will be at the cost of actually
meeting North Carolina’s mandate. If the legislature lifts the cost caps for the purpose of meeting
its mandate, electricity prices will skyrocket.
Our empirical analysis finds significant harmful effects on the economies of all states with RPS.
States that have adopted an RPS have seen a drop in industrial electricity sales by almost 14
percent. Real personal income has fallen by almost four percent, which figures to a loss of $14.4
billion or $3,870 per family. Non-farm employment has declined by nearly 3 percent. Lastly,
RPS is correlated with an increase of 10 percent in a state’s unemployment rate, equaling a loss
of 23,769 jobs.
Our analysis of the legal rules surrounding the RPS in North Carolina outlines several hindrances
to compliance in its requirement for generation from poultry and swine waste, and also from its
costs caps—a prediction our theoretical analysis substantiates. North Carolina’s RPS also may
not embody the spirit of RPS in general, largely due to the burning of poultry and swine waste,
which is not as environmentally-friendly as other sources of renewable generation.
BACKGROUND
North Carolina, a traditionally fossil fuel-heavy state (only 5 percent of their energy in 2005
came from renewable sources), first moved toward renewable energy incentives in 2003 with the
formation of NC GreenPower. Formed and administered by Advanced Energy, and backed by
investor-owned utilities, the non-profit runs a statewide program to promote renewable energy.
Individuals and businesses can make donations to NC GreenPower, which will then invest three
out of every four dollars they receive into some form of renewable energy production (they
retain $1 for marketing and administrative purposes). NC GreenPower has supported nearly 20
Institute of Political Economy, Utah State University
|
3
million kWh of renewable production per year since its creation, an earnest effort but a meager
result when compared to conventional energy sources.1
When Governor Mike Easley signed Session Law 2007-397 (SB 3) in 2007, North Carolina
became the first state in the southeast to implement a Renewable Portfolio Standard. Before the
bill was signed, the Environmental Review Commission of the North Carolina General
Assembly requested that the North Carolina Utilities Commission (NCUC) undertake a costbenefit analysis of the program. The NCUC contacted La Capra Associates to perform the
analysis.
La Capra presented their findings to the Renewable Energy Committee in December of 2006.
Their analysis outlined multiple benefits to the state such as augmented job creation, increased
revenue from property taxes, and a reduction in the social costs of electricity from coal power
plants.2 The bill was passed the following August and implemented in February of 2008 after the
NCUC issued its Order Adopting Final Rules.3
North Carolina’s RPS, named the Renewable Energy and Efficiency Portfolio Standard (REPS),
is not the most extreme in the nation—it requires investor owned utilities to produce a relatively
scant 12.5 percent of 2020 retail electricity sales from eligible renewable resources in 2021. The
requirements are even lower for municipal utilities and electrical cooperatives—they only have
to meet a target of 10 percent by 2018, and they obey slightly different rules. The fact that
utilities may use energy efficiency technologies to meet up to 25 percent of target production,
and that they may use energy demand reduction technologies to meet up to 100 percent of target
production, may also soften the blow.4 The following technologies have been approved as
appropriate renewable resources: solar-electric, solar thermal, wind, hydropower up to 10
megawatts (MW), ocean current or wave energy, biomass that uses Best Available Control
Technology (BACT) for air emissions, landfill gas, combined heat and power (CHP) using waste
heat from renewables, and hydrogen derived from renewables. Municipalities and cooperatives
may produce up to 30 percent of their required renewable production using hydropower.
North Carolina policy makers have a unique approach to how they would like to see renewable
energy produced. The RPS explicitly mandates specific amounts of production from the
following resources by 2021: solar, swine waste, and poultry waste (the last two count as
“biomass”). 0.02 percent production from solar is required beginning in 2010 and increasing to
1 Cherry, D., Saha, S. (2008). Renewable energy in North Carolina. Popular Government, 73(3), p. 12-23. Retrieved
from http://iei.ncsu.edu/wp-content/uploads/2013/01/renewableenergync.pdf
2 La Capra Associates (2006). Analysis of a Renewable Portfolio Standard for the State of North Carolina.
Retrieved from http://www.ncuc.commerce.state.nc.us/reps/NCRPSReport12-06.pdf
3 North Carolina Utilities Commission. (2014). Renewable energy and energy efficiency portfolio standard.
Retrieved from http://www.ncuc.commerce.state.nc.us/reps/reps.htm
4 American Council on Renewable Energy. (2014). Renewable energy in the 50 states: Southeastern region.
Retrieved from http://www.acore.org/images/documents/Southeastern_Region.pdf
4
|
Renewable Portfolio Standards: North Carolina
0.02 by 2021; 0.07 percent production from swine waste is required beginning in 2014 and
increasing to 0.2 percent by 2021. Mandatory poultry waste use begins in 2014 as well, starting
with a requirement of 170,000 MWh and increasing to 900,000 MWh by 2021.5 As with most
other RPS, North Carolina utilities may trade or stockpile RECs.
The RPS in North Carolina has also faced opposition since its creation, most recently—and
vociferously—from the American Legislative Exchange Council. They have targeted North
Carolina as part of a nationwide campaign to rid consumers of RPS and the economic burdens
they create. In 2013, with the support of ALEC, House Majority Whip Mike Hager introduced
HB 298, the “Affordable and Reliable Energy Act,” but the bill was eventually killed.6
The fight over RPS in North Carolina is likely not over. The analyses in following sections of
this report will be indispensable for predicting the effects of future bills that would either repeal
or strengthen the RPS.
RESULTS
THEORETICAL ANALYSIS
Analysis Performed by the Beacon Hill Institute at Suffolk University
The North Carolina REPS requires that investor-owned utilities produce a total of 12.5 percent of
their electricity from renewable energy, or reduce consumption through energy efficiency
measures. Municipal owned utilities must meet at target of 10 percent by 2021.7 As part of these
mandates, specific “carve-outs” are included which require that specific percentages of
electricity be generated from swine and poultry waste as well as solar power.
The REPS law contains provisions that enable electric utility companies to recoup these costs
from customers by implementing a Cost Recovery Rider (CRR). The cost recovery rider is
subject to a cap that peaks at annual cost of $34 for residential customers, $150 for commercial
customers and $1,000 for industrial customers.
5 United States Department of Energy. (2014). Database of State Incentives for Renewables & Efficiency. Retrieved
from http://www.dsireusa.org/
6 Voters Legislative Transparency Project. (2013). Bill to repeal North Carolina’s RPS passes House committee.
Retrieved from http://vltp.net/bill-to-repeal-north-carolinas-rps-passes-house-committee/
7 North Carolina Utilities Commission. (2006, December 13). Renewable Energy and Energy Efficiency Portfolio
Standard. Retrieved from http://www.ncuc.commerce.state.nc.us/r eps/reps.htm
Institute of Political Economy, Utah State University | 5
Renewable energy such as wind and solar power cost more than conventional energy. Energy
efficiency measures necessitate large investments that produce a return that is realized in small
increments spread out over many years.
The return on energy efficiency investments also are subject to several factors that will diminish
their effectiveness in reducing future electricity rate increases. First, energy efficiency
investments are subject to diminishing marginal returns. After consumers exhaust the cheapest
and most effective measures (e.g., efficient light bulbs), subsequent energy efficiency
investments will be less effective and more costly. Second, energy efficiency investments are
susceptible to the “rebound effect” and “free riders.” The rebound effect occurs when consumers
see their electricity bill decrease and, in response, increase their electricity consumption as
supply and demand models predict. An example of a free rider would be a consumer who would
have made the energy efficiency investments in the absence of any energy efficiency incentives,
but now reaps the reward anyway. Finally, energy efficiency incentives simply transfer a portion
of the investment cost from one electricity consumer who does not make the investment—maybe
for financial reasons—to another consumer who does.
Table 1 displays the cost of the REPS for the years 2010 through 2014. The total for all six years
is $276 million dollars. However, this is with a REPS mandate that only reaches three percent of
total electricity sales in 2012. Moreover, the costs are concentrated on the industrial customer.
For example, in 2013, industrial customers paid $38.8 million for the CRR, or $390 per
customer, while residential customers paid $19.6 million, or $4.62 per customer. The cost
increases will surge under the 2021 mandate of 12.5 percent, and as a result electricity prices will
likely follow.
TABLE 1: THE COST OF THE NORTH CAROLINA REPS LEGISLATION TO DATE (MILLIONS OF
DOLLARS).
Customer type
Residential
Industrial
Commercial
Total
2010
15.8
12.1
2.1
30.0
2011
23.2
17.6
2.9
43.7
2012
27.2
20.9
3.5
51.6
2013
19.6
38.8
4.0
62.4
2014
9.7
33.4
2.5
45.6
Total
118
140
18
276
Table 2 displays our cost estimates of the REPS legislation through its effect on retail electricity
prices and, thus electricity consumers under two scenarios. The first assumes that the cost
recover rider reaches the annual caps established by the legislation. In this case, electricity prices
would rise by 2.3 percent for residential customers, 2.1 percent for commercial customers and
0.41 percent for industrial customers.
The second scenario assumes that policymakers raise the caps in order to reach the REPS
mandates. In this case, electricity prices would rise by 2.2 percent for residential customers, 12.1
percent for commercial customers and 1.1 percent for industrial customers. Under this scenario,
the residential CRR comes in under the price cap, while commercial and industrial CRRs would
be well above their respective price caps. If policymakers were to strictly enforce the current cost
caps for all customer types, the cost cap for commercial customers would effectively, though
6
|
Renewable Portfolio Standards: North Carolina
inadvertently, freeze the amount of renewable electricity produced at 6.75 percent in 2017, short
of the 10 percent required by the following year.
TABLE 2: THE EFFECT OF THE REPS ON NORTH CAROLINA ON ELECTRICITY PRICES AND
CONSUMERS.
Cost Cap
total annual cost ($ million)
Per customer ($)
Cents per kWh
Percentage increase
No Cost Cap
Total annual cost ($ million)
Per customer ($)
Cents per kWh
Percentage increase
Residential
149
34
0.27
2.3
142
32
0.26
2.2
Commercial
94
150
0.19
2.1
533
847
1.10
12.1
Industrial
9
1,000
0.03
0.41
25
2,679
0.08
1.1
In each situation, the commercial electricity customer bears the brunt of the REPS costs and
increase in electricity price increases, posing potential threat to the competitiveness of North
Carolina's commercial business base. These results portend dire consequences for the state, and
so we prudently turn to our empirical analysis to verify their validity.
EMPIRICAL ANALYSIS
Analysis Performed by Tyler Brough, Ph.D., at Utah State University
STATE COINCIDENT EVENT STUDY
In this section, we present the results of an event study for state coincident indices—a
methodology first fashioned by the Federal Reserve Bank of Philadelphia.8 The event study
indexes the economic conditions of all states across multiple points in time, and assigns as “point
zero” each state’s economic conditions on the dates of their respective RPS implementations.
The study then compares said economic conditions over a span of 48 months before to 48
months after that enactment date. We then average the results across the different states, which,
given that RPS have been implemented in states over a long period, should minimize the effects
of anomalies such as recessions and the enactment of other energy-related laws. The indices of
8 Federal Reserve Bank of Philadelphia. (2015, January 29). State coincident indexes. Retrieved from
http://www.philadelphiafed.org/research-and-data/regional-economy/indexes/coincident/
Institute of Political Economy, Utah State University
|
7
each state RPS policy, while enacted in a different calendar month and year, can thus be lined up
in this so-called “event time” and averaged. For these reasons, the event study has become a
time-honored empirical methodology in finance and economics and a standard course of analysis
for the Philadelphia Fed. It is a simple but powerful method for measuring the effect of an
exogenous shock to an economic variable of interest. See Mackinlay for a more in-depth
discussion of the event study methodology.9 Table 3 presents the dates of 31 different states that
have enacted an RPS policy.
9 MacKinlay, A.C. (1997). Event studies in economics and finance. Journal of Economic Literature, 35(1), 13-39.
8
|
Renewable Portfolio Standards: North Carolina
Download FINAL RPS North Carolina
FINAL RPS North Carolina.pdf (PDF, 1.56 MB)
Download PDF
Share this file on social networks
Link to this page
Permanent link
Use the permanent link to the download page to share your document on Facebook, Twitter, LinkedIn, or directly with a contact by e-Mail, Messenger, Whatsapp, Line..
Short link
Use the short link to share your document on Twitter or by text message (SMS)
HTML Code
Copy the following HTML code to share your document on a Website or Blog
QR Code to this page

This file has been shared publicly by a user of PDF Archive.
Document ID: 0000215719.