Pupil Lumens and their impact on the choice of lighting (PDF)
File information
Title: 11-Pupil Lumens and their impact on the choice of lighting
Author: Mike Foody
This PDF 1.3 document has been generated by Word / Mac OS X 10.7.5 Quartz PDFContext, and has been sent on pdf-archive.com on 25/04/2015 at 04:54, from IP address 74.102.x.x.
The current document download page has been viewed 377 times.
File size: 483.97 KB (5 pages).
Privacy: public file


File preview
Pupil Lumens and their impact on the choice of lighting
A warehouse facility recently upgraded its lighting. Before the lighting improvement project it was illuminated by low
CRI HPS lamps which were replaced with higher CRI lights. The luminous intensity before the retrofit was 35 foot
candles which fell to only 25 foot candles after the retrofit project! A reduction of 28% in light intensity. Yet most users
of the facility rated the new lights as being significantly brighter than the older lamps.
•
•
•
This defies common sense and begs that a few questions should be answered. Why is it called a lighting
upgrade project when the light intensity is actually falling?
Why would a company pay to reduce the light intensity in its facilities where security and safety are very
important?
How can a setting that has lower light intensity appear brighter?
The answers stem from the term ‘Pupil Lumens’.
Before delving further it will help to clarify a few concepts
1) Luminous flux / Light output – it is the amount of light produced by a lamp. It does not take into consideration
the direction in which the light is sent. Most lighting devices produce light in a 360 degree sphere. This light must then
be redirected by a set of optics to the area where it is needed. Light output is measured in lumens.
2) Illuminance / Light level – It is the amount of light incident on a surface. It is measured in foot candles (FC) or
lumens / square foot.
3)
Luminance / Brightness – It is the amount of light reflected by a surface. It is measured in foot lamberts.
The diagram below is meant to demonstrate each one of these terms.
The human eye sees Luminance. It is NOT concerned with Luminous flux or illuminance. Thus, a dark colored surface
absorbs most of the light and has a low luminance while a lighter colored surface reflects more of the light rays incident
on it and has better luminance.
How can LED lights help improve luminance?
All the light output of an LED light is directed downward resulting in better Luminous Flux. This is only half the story.
Compared to High Pressure Sodium (HPS) and Low Pressure Sodium (LPS) LED lights have a far higher Color
Rendering Index (CRI). A higher CRI is achieved because light produced by LED bulbs is not monochromatic but has a
richer palette of wavelengths of light.
The incandescent bulb has a CRI of 100. However CRI values between 75 – 100 are considered to be excellent for
general purpose lighting, 65 – 75 is considered good while anything less than 55 is considered to be poor. When
illuminated by a high CRI source surface colors of an object appear brighter thus resulting in a perception of higher
Luminance.
From physics to biology – understanding the eyes’ response to Light
Cones and Photopic vision- The central part of the eye is the fovea that is rich in a type of cells called ‘cones’. Cones
are responsible for color vision and are involved in vision during bright light. This is called Photopic vision.
Rods and Scotopic vision-Rods are sensitive to dim light and are active during low light intensity conditions. Rods
cannot perceive color. Vision due to rods is ‘black and white.’
Light measuring instruments measure Light intensity in Lumens – considering only the response of the cones.
Thus, the Lumens measured by a light meter are also called Photopic Lumens.
In conditions of low light intensity entire vision is due to rod cells (scotopic vision). In medium light intensity
(conditions as are often found under street lights and in homes) vision is called Mesopic vision and is due to both rods
and cones. Using ‘Photopic Lumens’ to describe light intensity in such an area grossly underestimates the light
intensity as it totally ignores the contribution of rod cells to vision.
Scientists at the Lawrence Berkley Laboratory (LBL) developed the concept of scotopic lumens. They developed a
factor called P/S ratio. This ratio helps convert traditional Lumens into actual lumens perceived by the eye under
mesopic light conditions and gives a more accurate estimate of the amount of light.
Pupil Lumens = Photopic Lumens * [S/P] 0.78
Here are some types of lights with their traditional and pupil lumens
250 32500
365 37000
455 36000
Lumens/Watt (Photopic
Lumens)
130
101
79
S/P Ratio (correction
factor)
0.2
0.62
1.49
Pupil
Lumens
9250
25530
48960
Pupil
Lumens/Watt
37
70
108
36
2800
78
1.13
3080
85
15
1500
100
1.9
2475
165
Source of Light
Watt Lumens
Low Pressure Sodium
High Pressure Sodium
Metal Halide
T8 Fluorescent (3000
K)
LED Light
Factoring in the S/P ratios reveals why Low Pressure Sodium lamps that are apparently the most efficient with a
photopic lumen output of 130 Lumens/ Watt appear so dull. They just don’t have the spectrum of light needed to
illuminate objects properly and elicit the optimum response from the human retina in mesopic lighting conditions.
This improvement in lumen perception is the reason why people and cities are opting for full spectrum lights. The
current codes do not reflect scotopic lumens. Therefore, if you are planning to opt for LED lights as replacements for
existing lights of a generation earlier it is prudent to avoid going by the published lumen output alone. The photopic
lumen output of a light may only partially reflect the reality of the situation. Comparing absolute Photopic Lumens was
alright as long as the same type of bulb was being compared. With differences in lighting technology there is a marked
shift in wavelength composition and CRI. It is always better to try out energy efficient LED lights and experience their
light quality first hand.
There is another factor underlying the improved perception of light from high CRI LED lamps. Below is a diagram
showing the relative luminous efficiency of different wavelengths of light. Thus, cones have maximum efficiency at
about 550 nm (green light) while the efficiency of rods is at its peak at around 510 nm (blue-green light). HPS and LPS
lamps that are poor in the green yellow and blue yellow wavelengths naturally have a lower impact on the eye’s
photoreceptors. While the current method of measuring Lumens takes care of the 550 nm peak it does little to tackle
issues with the lower band of 510 nm.
The Scotopic response is dependent on the blue light content of a light. Thus 6500 K fluorescent lights have better S/ P
ratios than 3500 K tube lights. A look at the spectrum of light from different light sources can help clarify a lot of
things.
For this part of the analysis we decided to use cloud sourcing to improve the quality and reliability of the data.
The images used to explain the information are not ours. All images are from open source resources (shared
under the creative commons/ GNU free documentation license) available at www.flicker.com and
www.commons.wikimedia.org.
You always suspected that light from the HPS lamp was dull – you were right. While the absolute lumens/watt
produced by an HPS lamp is high it is the wavelength of the light that it produces that makes it appear dull.
Here is the spectruim of the HPS lamp.
(Photo credit – testone22 http://www.flickr.com/photos/79262083@N00/342148466/sizes/l/in/photostream/)
We have already seen that the eye is most sensitive to wavelengths of 510 nm and 550 nm. These very wavelengths are
scarce in the spectrum of an HPS lamp. The most prominent wavelengths in the spectrum of an HPS lamp are between
575 and 650 nm. The sensitivity of the eye to these wavelengths is 20 – 80% of the peak response. This is the reason
why HPS lamps do not elicit the optimum response from the human eye and far fewer lumens from a good LED source
can provide the same perception of brightness.
Another way of understanding the limitations of the HPS lamp is to look at its light color spectrum. Here is a visual
representation of the wavelengths of an HPS lamp. This spectrum was obtained by using a homemade spectroscope.
(Photo credit - Chris Heilman http://commons.wikimedia.org/wiki/File:Spectrum-hp-sodium.jpg)
The large gaps in the spectrum are obvious. The heaviest density is in the red yellow region that is not every effective in
stimulating the eyes. Moreover, because the spectrum is patchy HPS lamps are not good at color rendering.
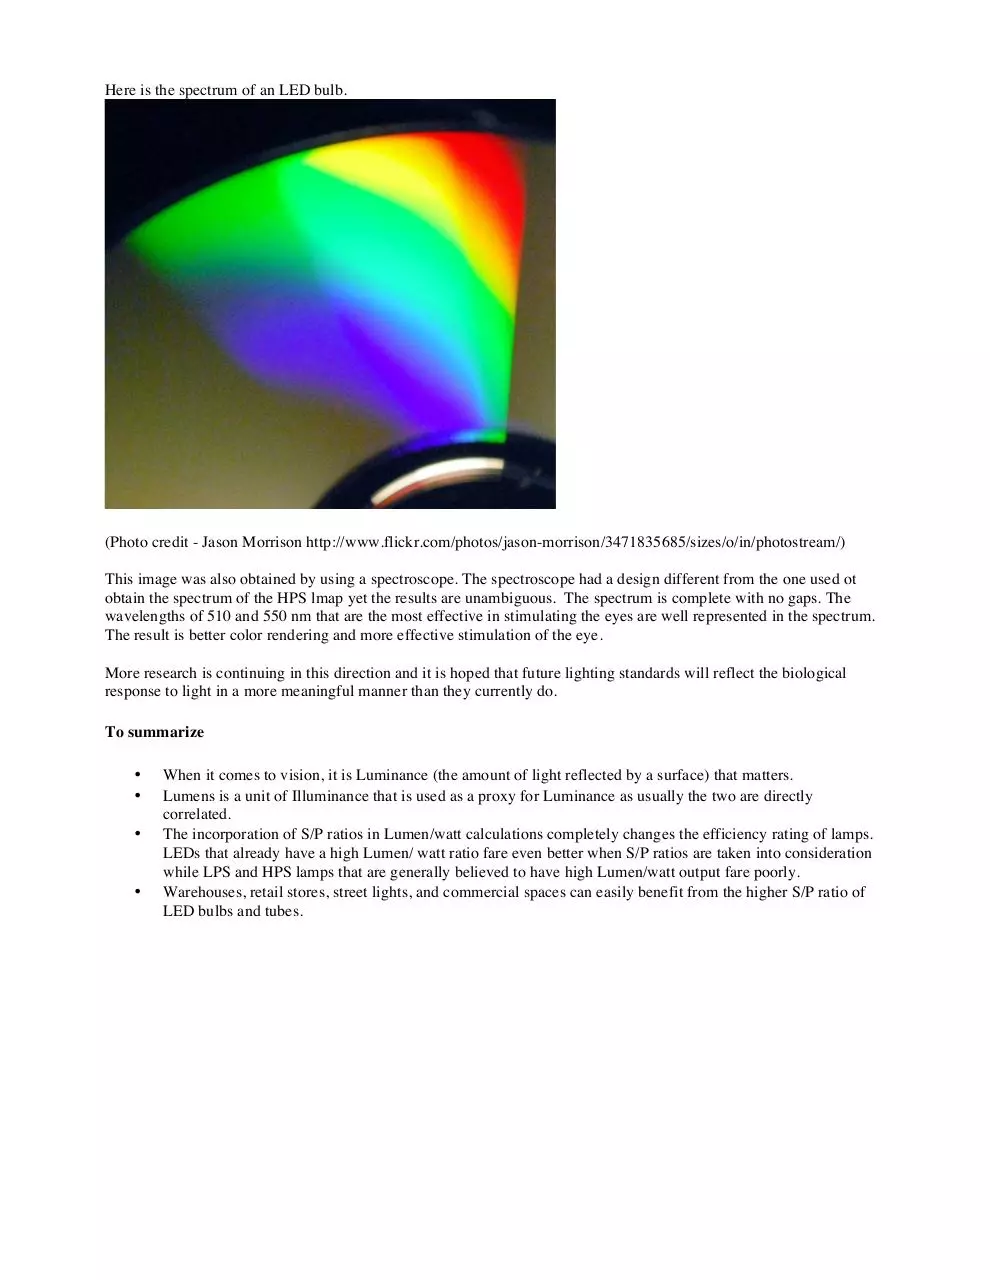
Here is the spectrum of an LED bulb.
(Photo credit - Jason Morrison http://www.flickr.com/photos/jason-morrison/3471835685/sizes/o/in/photostream/)
This image was also obtained by using a spectroscope. The spectroscope had a design different from the one used ot
obtain the spectrum of the HPS lmap yet the results are unambiguous. The spectrum is complete with no gaps. The
wavelengths of 510 and 550 nm that are the most effective in stimulating the eyes are well represented in the spectrum.
The result is better color rendering and more effective stimulation of the eye.
More research is continuing in this direction and it is hoped that future lighting standards will reflect the biological
response to light in a more meaningful manner than they currently do.
To summarize
•
•
•
•
When it comes to vision, it is Luminance (the amount of light reflected by a surface) that matters.
Lumens is a unit of Illuminance that is used as a proxy for Luminance as usually the two are directly
correlated.
The incorporation of S/P ratios in Lumen/watt calculations completely changes the efficiency rating of lamps.
LEDs that already have a high Lumen/ watt ratio fare even better when S/P ratios are taken into consideration
while LPS and HPS lamps that are generally believed to have high Lumen/watt output fare poorly.
Warehouses, retail stores, street lights, and commercial spaces can easily benefit from the higher S/P ratio of
LED bulbs and tubes.
Download Pupil Lumens and their impact on the choice of lighting
Pupil Lumens and their impact on the choice of lighting.pdf (PDF, 483.97 KB)
Download PDF
Share this file on social networks
Link to this page
Permanent link
Use the permanent link to the download page to share your document on Facebook, Twitter, LinkedIn, or directly with a contact by e-Mail, Messenger, Whatsapp, Line..
Short link
Use the short link to share your document on Twitter or by text message (SMS)
HTML Code
Copy the following HTML code to share your document on a Website or Blog
QR Code to this page

This file has been shared publicly by a user of PDF Archive.
Document ID: 0000222779.