FinalReportvMethadoneClinic (PDF)
File information
Author: OLSEN, DEAN W
This PDF 1.5 document has been generated by Acrobat PDFMaker 11 for Word / Adobe PDF Library 11.0, and has been sent on pdf-archive.com on 28/05/2015 at 19:47, from IP address 24.177.x.x.
The current document download page has been viewed 567 times.
File size: 3.16 MB (35 pages).
Privacy: public file


File preview
North Side Methadone Clinic
Evaluating a possible nuisance property
in Madison, Wisconsin
Final Project Report
Geography 578
Prof. A-Xing Zhu
Spring 2014
Mark Harris
Dean Olsen
Laura Poplett
Sarah Scott
Methadone Clinic Study
Geography 578
Table of Contents
Objectives ........................................................................................................................................ 1
Background: The Study Area & Clinic ........................................................................................... 1
Background: Methadone & Methadone Clinics ............................................................................. 2
Methodology: Overview .................................................................................................................. 3
Methodology: CFS Data ................................................................................................................. 4
Methodology: Getis Gi* (Hot Spot) Analysis ................................................................................. 5
Methodology: Density Analysis ...................................................................................................... 6
Results & Discussion: Density Analysis ......................................................................................... 8
Methodology: Annual CFS Volume Analysis .................................................................................. 9
Results & Discussion: Annual Volume Analysis ........................................................................... 10
Conclusions ................................................................................................................................... 11
References ..................................................................................................................................... 13
Appendix A: Larger Versions of Some Figures ......................................................................... 15
Appendix B: Getis Gi* Tabular Results .................................................................................... 23
Table of Figures
Figure 1: Map of Study Area ............................................................................................................ 1
Figure 2: Detail from CFS file ......................................................................................................... 4
Figure 3: Aggregation of Police Data.............................................................................................. 4
Figure 4: CFS Locations .................................................................................................................. 5
Figure 5: Hot Spot Locations ........................................................................................................... 5
Figure 6: Hot Spots with Commercial Zones ................................................................................... 6
Figure 7: Proximity Zones around Clinic ........................................................................................ 7
Figure 8: CFS Activity Density by Zone from Clinic ....................................................................... 8
Figure 9: Clinic Zone of Influence ................................................................................................... 9
Figure 10: Ten-Year CFS Volume near Clinic and in Madison.................................................... 10
Objectives
Some residents of a north side Madison, Wisconsin neighborhood have expressed concern
that a nearby methadone clinic is causing an increase in criminal and suspicious activity in the
neighborhood. This project examines whether there is a basis in evidence for these assertions.
This project was prompted by one of the author’s direct experience in the study area. At
community meetings about other issues, the methadone clinic was often mentioned as a source of
trouble in the neighborhood. That these statements were made in January 2014, two months after
the clinic had actually closed, is a testament to the strength of feelings about the facility. In conversations about this project with David Ahrens, the alderman for the district in which the clinic
was operating, he said that even though the clinic had closed, he would welcome our efforts to
empirically evaluate the clinic’s effect on the neighborhood to use as a reference for community
response to controversial developments.
Background: The Study Area & Clinic
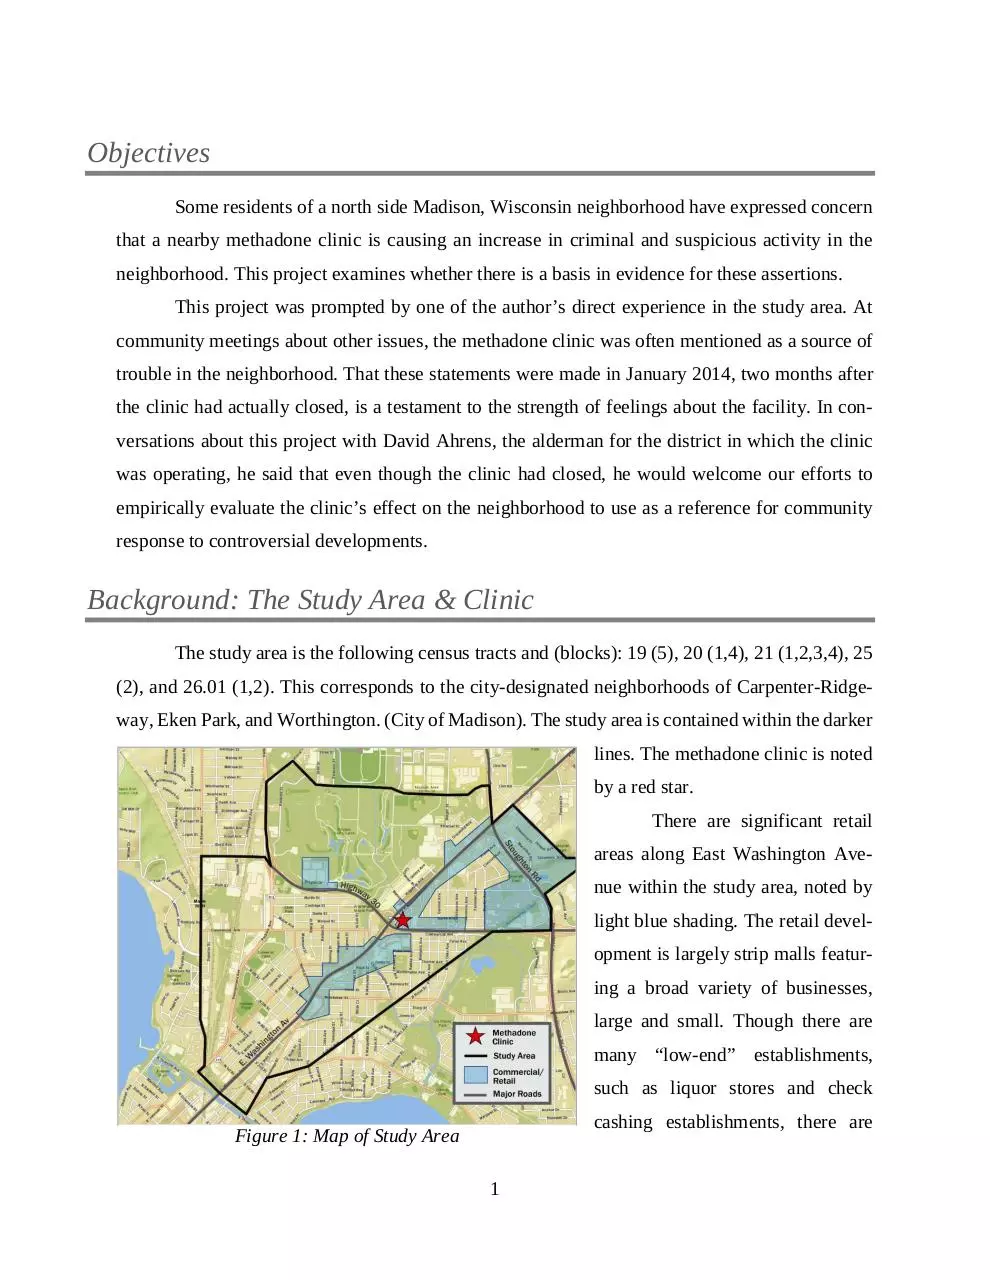
The study area is the following census tracts and (blocks): 19 (5), 20 (1,4), 21 (1,2,3,4), 25
(2), and 26.01 (1,2). This corresponds to the city-designated neighborhoods of Carpenter-Ridgeway, Eken Park, and Worthington. (City of Madison). The study area is contained within the darker
lines. The methadone clinic is noted
by a red star.
There are significant retail
areas along East Washington Avenue within the study area, noted by
light blue shading. The retail development is largely strip malls featuring a broad variety of businesses,
large and small. Though there are
many “low-end” establishments,
such as liquor stores and check
cashing establishments, there are
Figure 1: Map of Study Area
1
also branches of national banks, chain restaurants, and the public library—East Washington Avenue is not Fifth Avenue but it’s not the Bowery, either.
The surrounding residential areas are largely working-class, characterized by generally
well-maintained, single-family homes. These neighborhoods have long been the home of workers
employed at the nearby Oscar Meyer food processing plant. (City of Madison) There is some multifamily housing, located mostly along East Washington and Darbo Avenues.
Background: Methadone & Methadone Clinics
Methadone is a prescription drug used to help people quit heroin and opiate class drugs,
including oxycodone and other prescription-only pain medications. It acts as a chemical replacement and works by “occupying” the brain receptors affected by heroin and other opioids. Methadone’s main benefit is to ease withdrawal symptoms, a major cause of relapse from abstinence. It
also blocks the “high” of these drugs should the user relapse. It is usually prescribed to persons
who have had difficulty kicking their drug habit, usually after multiple failures with other types of
treatment. (CDC 2002)
Methadone is administered through licensed medical facilities. Clients come to a facility
to receive a supervised administration of methadone, usually in liquid form served in juice. Clients
take this daily dose of methadone for months, sometimes years. Clients who are compliant by
remaining free of other drugs are sometimes allowed to take doses away from the clinic for selfadministration but most clients report daily to clinics for their dose. In addition to dosing, clients
are strongly encouraged to attend regular counseling sessions at the clinic, typically once a week.
Clearly discernable success rates for methadone replacement therapy are hard to find in the
literature and when found, are presented with many caveats and restrictions. The California Society of Addiction Medicine states success rates vary from 60% to 90% though these rates apply
only to those who stay in treatment which CSAM concedes is “few.” (CSAM 2014) The Centers
for Disease Control states that “methadone maintenance treatment is the most effective treatment
for opiate addictions,” but adds that “it is relatively common for MMT [methadone maintenance
therapy] clients to continue using heroin, other drugs such as cocaine or marijuana, and alcohol
after treatment.” The CDC concludes that “realistic expectations of treatment reflect the understanding that recovery is a day-to-day process with occasional relapses.” (CDC 2002)
2
So it is not difficult to understand why methadone clinics are not welcomed in some communities. In recent years, neighborhoods in Pennsylvania, Vermont, Australia and rural Scotland
have struggled with proposed methadone clinics. (Archibald; Barber; Picard; Sapatkin) Because
methadone clinics, by definition, must act as gathering places for persons experiencing very mixed
success at staying off drugs, persons in neighborhoods like our study area can have concerns with
this daily foot traffic around the clinic.
Methodology: Overview
The conceptualization of the project is rather simple: Find a proxy for criminal and even
just suspicious behavior and see how it varies over space and time to identify any problem areas
within the study area, especially around the methadone clinic.
We identified Madison Police Department Calls for Service (CFS) as being the best indicator of perceived problems in the community. CFS is good because it identifies any behavior
deemed worthy of a call to the police, either 911 or the non-emergency phone number. The behavior does not have to result in further police action, such as an arrest or even questioning; it is merely
behavior that someone feels warrants attention by the police. CFS captures the full scope of possible neighborhood objections to activity at the methadone clinic. Actions may be legal but can
still worry people, resulting in a call. These calls are logged by date, time, location of the worrisome behavior, and an indicator of what the trouble might be.
CFS data can then be analyzed to locate spikes around the clinic. The group decided on
three tests:
Getis Gi*or Hot Spot analysis over the entire study area;
Network Analyses to determine zones of influence around the clinic to
•
Count CFS over time
•
Count CFS closer to the clinic
These three will be discussed below.
3
Methodology: CFS Data
The CFS data was obtained from the Madison Police Department as an Excel file which
contained all CFS for the city of Madison, a file of over 4.8 million cells. See
Figure 2: Detail from CFS file. The data
was from January 2003 through January
2014. We used January 2003 to December 2012 as the study time frame because the clinic closed in November
2013 and we did not want to use partial
years. Edits were made in Excel and
Figure 2: Detail from CFS file
through PgAdmin III, a database program, to eliminate data from outside the study area. This brought the total number of cells to
1.4 million, still a formidable number.
The remaining CFS entries were
then geocoded using an API key from
Bing. These geocoded addresses were
used to create the CFS layer in
ArcGIS 10.1, used in all analyses.
Of note is how the Madison Police Department releases its CFS data to
the public. The data is not released with
exact addresses but rather is aggregated
at the 100’s block level. Please see Figure 3: Aggregation of Police Data for a
Figure 3: Aggregation of Police Data
visualization of this aggregation. This
practice is to protect privacy, especially for domestic disturbance calls. Many people might object
to the Madison Police Department giving neighbors the tools to keep a private tally of police calls
to their homes.
4
This affects our study because
CFS directly related to the methadone
clinic cannot be known. In the case of
the clinic, the 3100 block of East
Washington also contains the Aloha
Inn, a transient motel. We cannot separate CFS data for it from that of the
clinic.
Figure 4: Map of CFS Locations shows the study area CFS locations. Remember that each point reflects many CFS, as many as 1,500 or
as few as a single call for the 10-year
Figure 4: CFS Locations
study period.
Methodology: Getis Gi* (Hot Spot) Analysis
Hot spot analysis is done with the use of the Getis-Ord local Gi* statistical test. This test
looks at whether each aggregated
block is within a clustering of higher
or lower values than one would expect in a random distribution of those
same values. It examines a feature, in
our case one block, and compares it
to all the blocks nearest it. If that specific block has a high number of calls
and is also surrounded by blocks with
high numbers of calls, it will be considered a statistically significant hot
spot. A block with a low number of
calls surrounded by other blocks with
Figure 5: Hot Spot Locations
a low number of calls is a cold spot.
5
This generates a local average of one feature and those around it, which is then compared to the
global average to identify if a local
pattern is different to what is generally observed across the whole study
area. A table of z-scores and p-values
is generated. If a block has an exceptionally high or low z-score with a
small p-value, the block’s high or low
value would be unlikely in a random
distribution of the values being
mapped, implying a force at work
other
than
random
occurrence.
(Chainey)
This hot spot analysis was
Figure 6: Hot Spots with Commercial Zones
performed on the CFS data across the
entire study area. The tabular findings,
showing the z-scores and p-values for each aggregated block, are in Appendix A. The visualized
findings are in Figure 5: Hot Spot Locations.
The colors of each block represent ranges of z-scores (standard deviations away from normal). Any block which has a z-score that is 1.96 or greater is a statistically significant hot spot
with 95% or higher certainty. This includes both the orange and red colored blocks. It can be seen
that the Methadone clinic does not fall with in a hot spot of calls for service. There is, however, a
cluster of hotspots to the south west of the clinic. We observed that the majority of hot spots fall
within a commercial zone, as depicted in Figure 6: Hot Spots with Commercial Zones
Methodology: Density Analysis
The Getis-Gi* or Hot Spot analysis informed us that CFS activity around the clinic fell
within a normal range for the study area. We then examined the area immediately surrounding the
clinic to determine if there was any relationship between CFS density and the proximity to the
clinic by running a density analysis on the area around the clinic.
6
The first step was to create a number of proximity zones around the clinic. For this, we
chose to use service area network analysis. We used a road network base map to create the network
analysis, assuming that all of the roads would have sidewalks running along the side of them.
Based on this assumption, three zones were created using 0-3, 3-6, and 6-9 minute walking distances away from the clinic. The outer edges of each of these three zones translate out to 250, 500,
and 750 meters. Since we were looking at walking distances, we ran the
network analysis as omni-directional
with no restraints for U-turns or any
other turning possibilities. Walkers,
unlike vehicles, are able and inclined
to go the wrong way along a one-way
street or make a U-turn if it will
shorten their walk.
The main reason for choosing
to use the network analysis instead of
creating a three-ring buffer of 250,
Figure 7: Proximity Zones around Clinic
500, and 750 meter distances was to
better capture the accessibility of the
area around the clinic. For example, the intersection of the two major roads that run along the
clinic, E. Washington and Hwy 30, is a large overpass that allows traffic and pedestrians to cross
Hwy 30 along E. Washington. This overpass is the only way to cross Hwy 30 within our study
area, thus greatly limiting the accessibility to different parts of the site. The network analysis captures this single access point whereas a three ring buffer would completely miss this limiting factor.
We were then able to plot CFS activity within these three zones for the entire ten-year
period and calculate CFS densities in each. To calculate the densities, we first calculated the total
CFS activity within a particular proximity zone and then divided that number by the area of that
zone. This calculation provided us a density measured in CFS per square meter. We could then
compare zones to discern any relationship between the CFS density and proximity to the clinic.
7
Download FinalReportvMethadoneClinic
FinalReportvMethadoneClinic.pdf (PDF, 3.16 MB)
Download PDF
Share this file on social networks
Link to this page
Permanent link
Use the permanent link to the download page to share your document on Facebook, Twitter, LinkedIn, or directly with a contact by e-Mail, Messenger, Whatsapp, Line..
Short link
Use the short link to share your document on Twitter or by text message (SMS)
HTML Code
Copy the following HTML code to share your document on a Website or Blog
QR Code to this page

This file has been shared publicly by a user of PDF Archive.
Document ID: 0000246780.