midterm comp (PDF)
File information
Author: Urban, Mark
This PDF 1.5 document has been generated by Microsoft® Word 2013, and has been sent on pdf-archive.com on 15/10/2015 at 08:57, from IP address 67.190.x.x.
The current document download page has been viewed 515 times.
File size: 374.73 KB (6 pages).
Privacy: public file
File preview
Compressor Analysis
To avoid choked flow, an axial compressor will be attached to the front of the pod. In order
to achieve suitable efficiency, a diffuser will be mounted to the front of the compressor
which will slow air to speeds less than .65 Mach (1). This process is illustrated in Figure 1
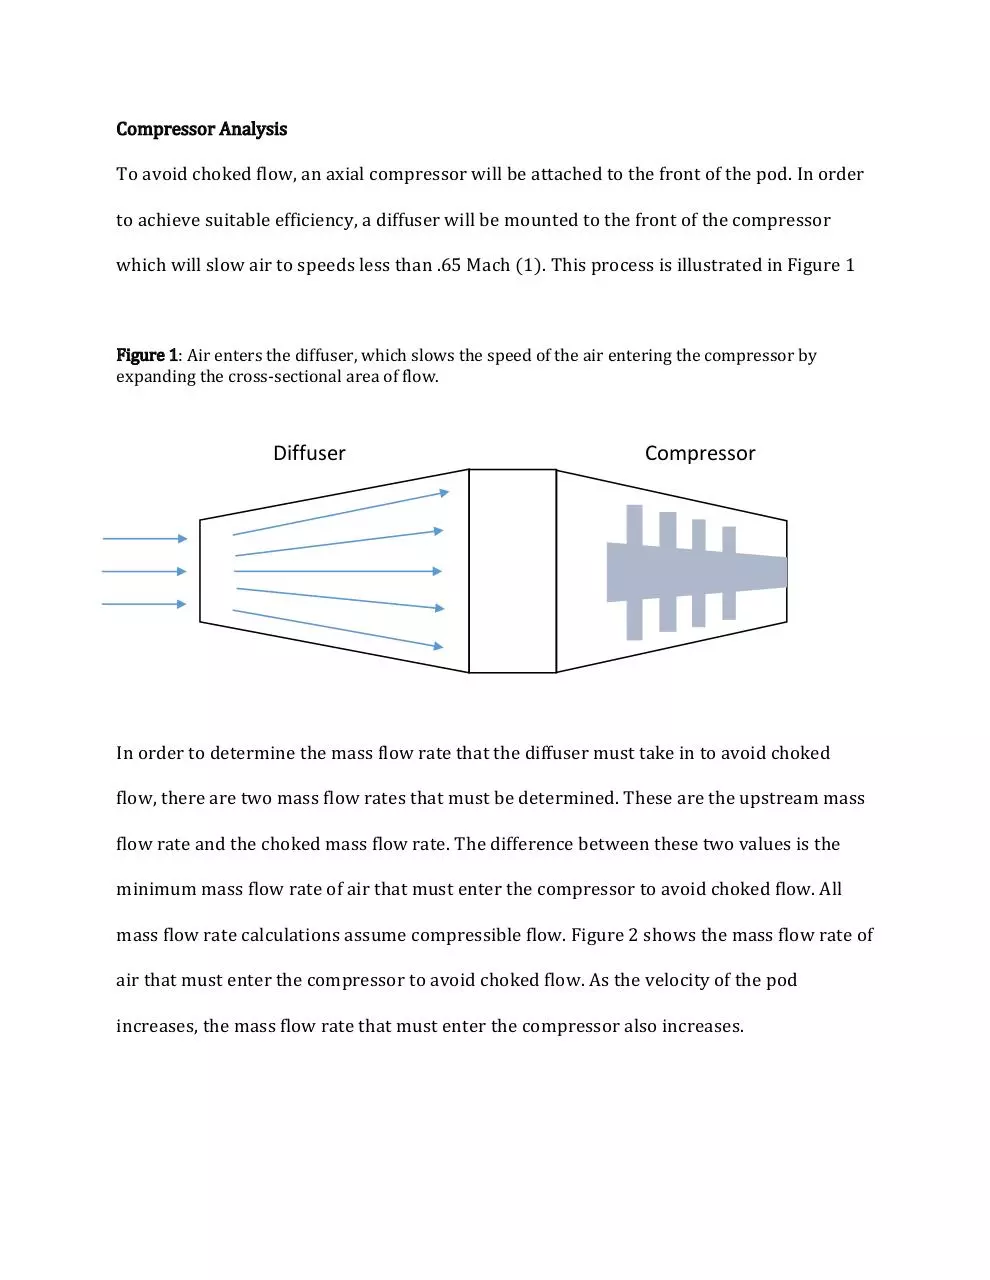
Figure 1: Air enters the diffuser, which slows the speed of the air entering the compressor by
expanding the cross-sectional area of flow.
Diffuser
Compressor
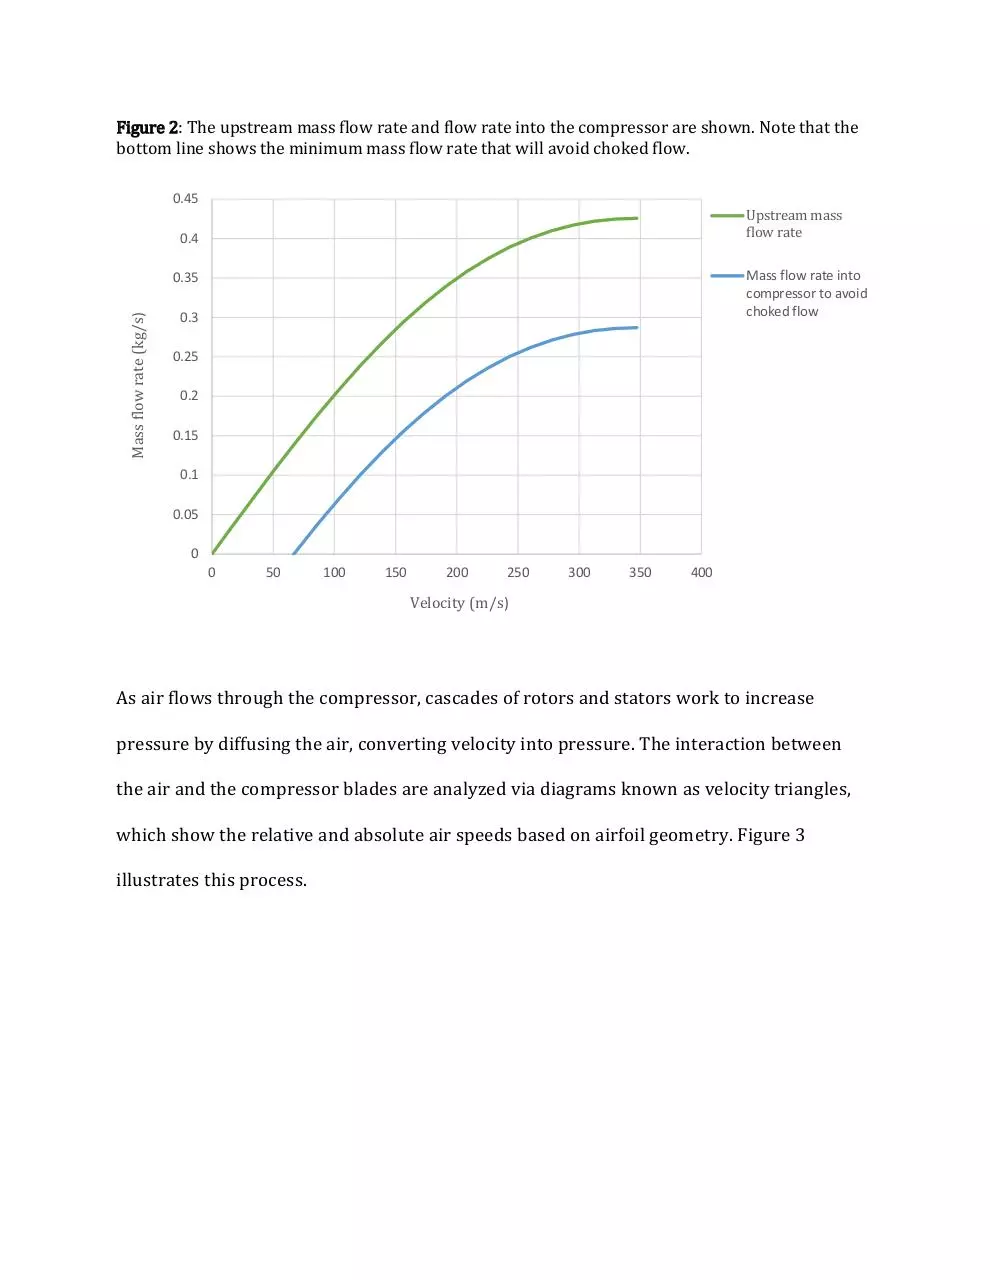
In order to determine the mass flow rate that the diffuser must take in to avoid choked
flow, there are two mass flow rates that must be determined. These are the upstream mass
flow rate and the choked mass flow rate. The difference between these two values is the
minimum mass flow rate of air that must enter the compressor to avoid choked flow. All
mass flow rate calculations assume compressible flow. Figure 2 shows the mass flow rate of
air that must enter the compressor to avoid choked flow. As the velocity of the pod
increases, the mass flow rate that must enter the compressor also increases.
Figure 2: The upstream mass flow rate and flow rate into the compressor are shown. Note that the
bottom line shows the minimum mass flow rate that will avoid choked flow.
0.45
Upstream mass
flow rate
0.4
Mass flow rate into
compressor to avoid
choked flow
Mass flow rate (kg/s)
0.35
0.3
0.25
0.2
0.15
0.1
0.05
0
0
50
100
150
200
250
300
350
400
Velocity (m/s)
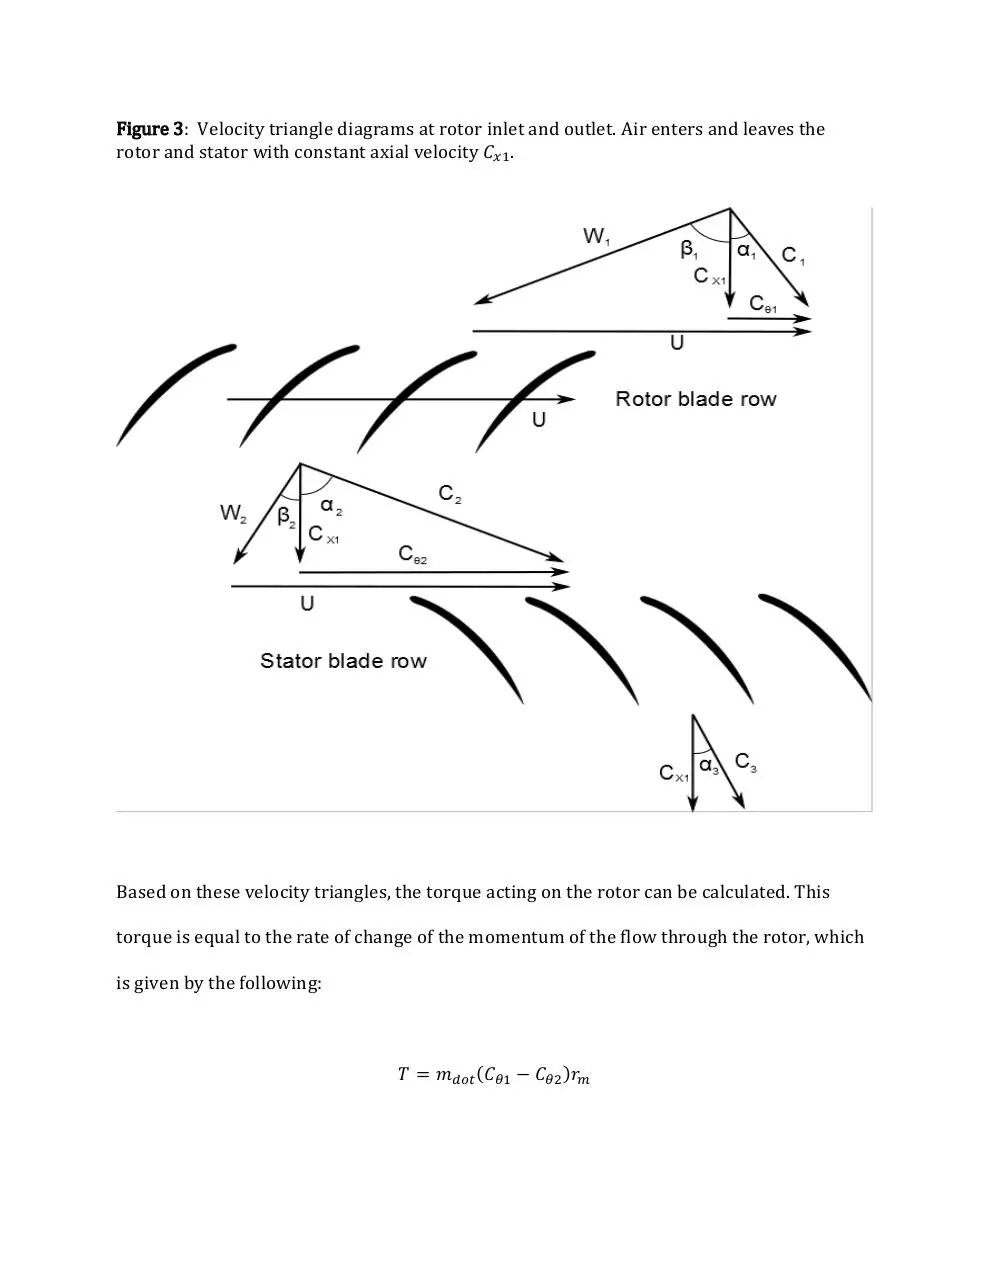
As air flows through the compressor, cascades of rotors and stators work to increase
pressure by diffusing the air, converting velocity into pressure. The interaction between
the air and the compressor blades are analyzed via diagrams known as velocity triangles,
which show the relative and absolute air speeds based on airfoil geometry. Figure 3
illustrates this process.
Figure 3: Velocity triangle diagrams at rotor inlet and outlet. Air enters and leaves the
rotor and stator with constant axial velocity 𝐶𝑥1 .
Based on these velocity triangles, the torque acting on the rotor can be calculated. This
torque is equal to the rate of change of the momentum of the flow through the rotor, which
is given by the following:
𝑇 = 𝑚𝑑𝑜𝑡 (𝐶𝜃1 − 𝐶𝜃2 )𝑟𝑚
where 𝐶𝜃1 𝑎𝑛𝑑 𝐶𝜃2 are the relative portions of the rotor speed associated with the actual
air speed, and 𝑟𝑚 is the mean radius of the rotor. The power required to propel the air
axially through the compressor at a constant axial speed 𝐶𝑥1 is given by
𝑃 = 𝑚𝑑𝑜𝑡 𝑈(𝐶𝜃1 − 𝐶𝜃2 )
where 𝑈 is the speed of the rotor at the mean radius. The specific work for the compression
stage can be determined from the power. This is calculated as follows:
𝑊𝑠𝑡𝑎𝑔𝑒 =
𝑃
𝑚𝑑𝑜𝑡
The pressure rise through the compression stage can now be calculated. This value is
determined by the change in ratio of outlet to inlet temperatures through the stage. The air
temperatures at rotor inlet and outlet, 𝑇01 and 𝑇02 , are calculated by the following
𝑇01 = 𝑇𝑖𝑛 +
𝑇02 = 𝑇01 +
𝑉𝑖𝑛 2
2𝑐𝑝
𝑊𝑠𝑡𝑎𝑔𝑒
𝑐𝑝
Here, 𝑇𝑖𝑛 and 𝑉𝑖𝑛 are compressor inlet temperature and velocity. 𝑐𝑝 is the constant pressure
heat capacity of air. Finally, the pressure rise can be calculated by:
𝐶𝑃𝑅 = (
𝑇02 𝑦
)𝑦−1
𝑇01
The above process can be repeated for any number of rotor/stator stages to create a multistage axial compressor. Knowing the pressure ratio per stage is critical in the next design
step, which is the design of the actual rotor and stator blade geometries. This process is
tedious and is done through computer simulation. For this reason, a turbomachinery
consulting companies will be contacted to create 3-D model of the compressor, based upon
the number of stages and the required pressure ratio. This 3-D model will then be tested
using advanced computational fluid dynamics software.
In the event that resources fall short and the cost to have a third-party design and
manufacture an axial compressor is too high, alternative are being considered.
Recommendations have suggested that a ducted fan may be suitable for this prototype pod.
While the fan will not be able to compress enough air to supply the air bearings, it will still
solve the choked flow problem that the pod will encounter. If this approach is taken, the
onboard air tanks will be pre-pressurized and still be able to supply enough air to the air
bearings for the duration of the pods testing phase on the test track.
References
1. Chin, Jeffrey C. "Open-Source Conceptual Sizing Models for the Hyperloop Passenger
Pod." (n.d.): n. pag. NASA Glenn Research Center. Web. 14 Oct. 2015.
2. "Fluid Mechanics and Thermodynamics of Turbomachinery", S. L. Dixon and C. A.
Hall, 2010, Hall, 6th ed.
Download midterm comp
midterm comp.pdf (PDF, 374.73 KB)
Download PDF
Share this file on social networks
Link to this page
Permanent link
Use the permanent link to the download page to share your document on Facebook, Twitter, LinkedIn, or directly with a contact by e-Mail, Messenger, Whatsapp, Line..
Short link
Use the short link to share your document on Twitter or by text message (SMS)
HTML Code
Copy the following HTML code to share your document on a Website or Blog
QR Code to this page

This file has been shared publicly by a user of PDF Archive.
Document ID: 0000308291.