R Codes (PDF)
File information
Author: Owner
This PDF 1.5 document has been generated by Microsoft® Word 2013, and has been sent on pdf-archive.com on 31/10/2015 at 22:04, from IP address 129.174.x.x.
The current document download page has been viewed 369 times.
File size: 201.08 KB (2 pages).
Privacy: public file

File preview
R codes
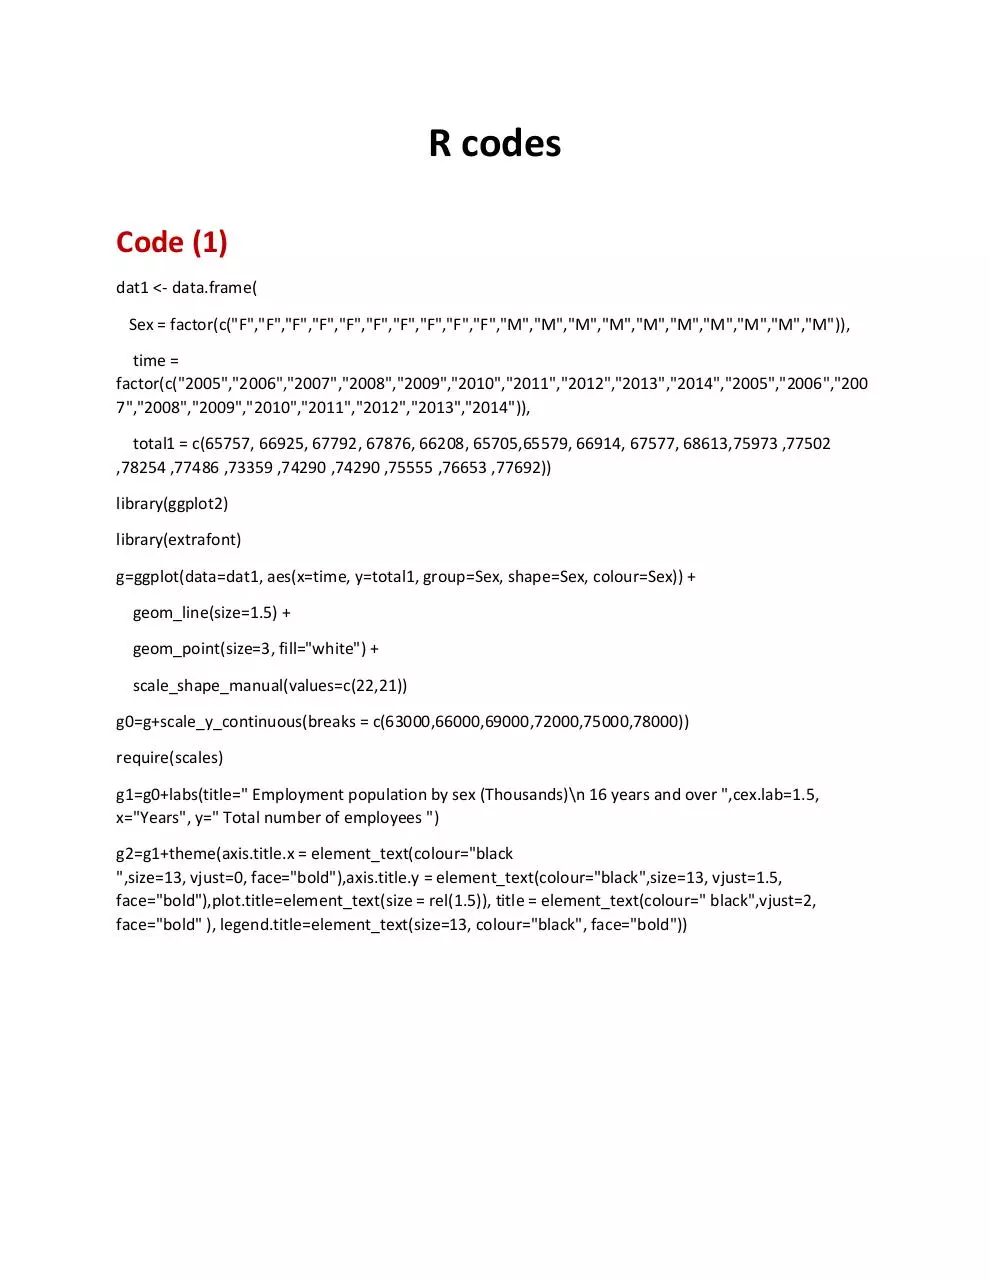
Code (1)
dat1 <- data.frame(
Sex = factor(c("F","F","F","F","F","F","F","F","F","F","M","M","M","M","M","M","M","M","M","M")),
time =
factor(c("2005","2006","2007","2008","2009","2010","2011","2012","2013","2014","2005","2006","200
7","2008","2009","2010","2011","2012","2013","2014")),
total1 = c(65757, 66925, 67792, 67876, 66208, 65705,65579, 66914, 67577, 68613,75973 ,77502
,78254 ,77486 ,73359 ,74290 ,74290 ,75555 ,76653 ,77692))
library(ggplot2)
library(extrafont)
g=ggplot(data=dat1, aes(x=time, y=total1, group=Sex, shape=Sex, colour=Sex)) +
geom_line(size=1.5) +
geom_point(size=3, fill="white") +
scale_shape_manual(values=c(22,21))
g0=g+scale_y_continuous(breaks = c(63000,66000,69000,72000,75000,78000))
require(scales)
g1=g0+labs(title=" Employment population by sex (Thousands)\n 16 years and over ",cex.lab=1.5,
x="Years", y=" Total number of employees ")
g2=g1+theme(axis.title.x = element_text(colour="black
",size=13, vjust=0, face="bold"),axis.title.y = element_text(colour="black",size=13, vjust=1.5,
face="bold"),plot.title=element_text(size = rel(1.5)), title = element_text(colour=" black",vjust=2,
face="bold" ), legend.title=element_text(size=13, colour="black", face="bold"))
Code (2)
dat1 <- data.frame(
Employment=factor(c("Employed","Employed","Employed","Employed","Employed","Employed","Empl
oyed","Employed","Employed","Employed","Unemployed","Unemployed","Unemployed","Unemployed
","Unemployed","Unemployed","Unemployed","Unemployed","Unemployed","Unemployed")),
time =
factor(c("2005","2006","2007","2008","2009","2010","2011","2012","2013","2014","2005","2006","200
7","2008","2009","2010","2011","2012","2013","2014")),
total1 = c(65757, 66925, 67792, 67876, 66208, 65705,65579, 66914, 67577, 68613, 3531, 3247, 3196,
3891, 5811, 6199, 6063, 5734, 5146, 4426))
library(ggplot2)
library(extrafont)
g=ggplot(data=dat1, aes(x=time, y=total1, group=Employment, shape= Employment,
colour=Employment)) +
geom_line(size=1.5) +
geom_point(size=3, fill="white") +
scale_shape_manual(values=c(22,21))
g0=g+scale_y_continuous(breaks =
c(5000,10000,15000,20000,25000,30000,35000,40000,45000,50000,55000,60000,65000 ))
require(scales)
g1=g+labs(title=" Employed and unemployed women (Thousands)\n 16 years and over",cex.lab=1.5,
x="Years", y=" Total number of employees ")
g2=g1+theme(axis.title.x = element_text(colour="black
",size=13, vjust=0, face="bold"),axis.title.y = element_text(colour="black",size=13, vjust=1.5,
face="bold"),plot.title=element_text(size =15), title = element_text(colour=" black",vjust=2, face="bold"
), legend.title=element_text(size=13, colour="black", face="bold"))
Download R Codes
R Codes.pdf (PDF, 201.08 KB)
Download PDF
Share this file on social networks
Link to this page
Permanent link
Use the permanent link to the download page to share your document on Facebook, Twitter, LinkedIn, or directly with a contact by e-Mail, Messenger, Whatsapp, Line..
Short link
Use the short link to share your document on Twitter or by text message (SMS)
HTML Code
Copy the following HTML code to share your document on a Website or Blog
QR Code to this page

This file has been shared publicly by a user of PDF Archive.
Document ID: 0000311822.