HIOKI 3169 ENG (PDF)
File information
Title: CLAMP ON POWER HiTESTER 3169-20/-21
Author: HIOKI
This PDF 1.3 document has been generated by Adobe InDesign CS3_J (5.0.4) / Adobe PDF Library 8.0, and has been sent on pdf-archive.com on 24/12/2015 at 15:39, from IP address 5.18.x.x.
The current document download page has been viewed 766 times.
File size: 2.29 MB (12 pages).
Privacy: public file


File preview
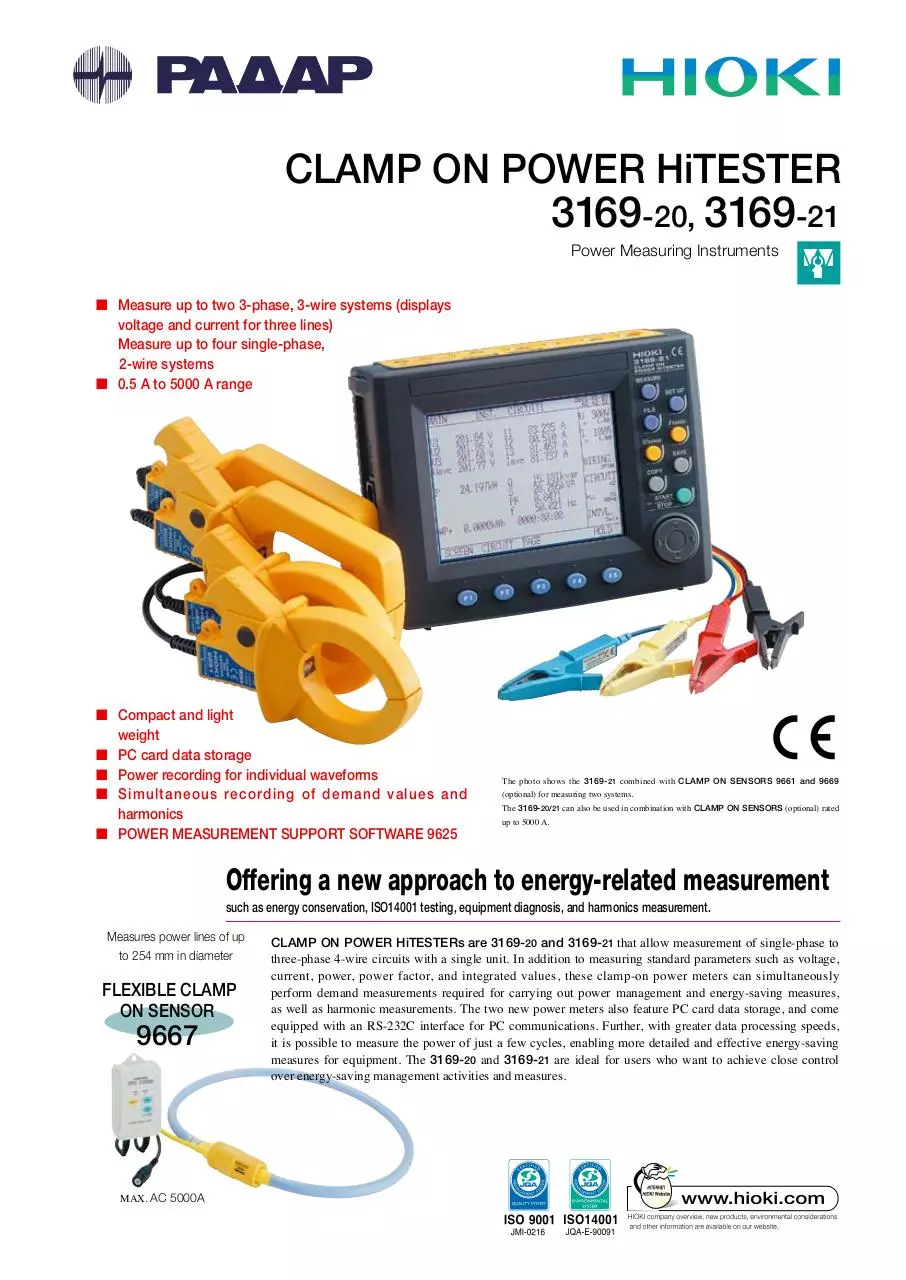
CLAMP ON POWER HiTESTER
3169-20, 3169-21
Power Measuring Instruments
■ Measure up to two 3-phase, 3-wire systems (displays
voltage and current for three lines)
Measure up to four single-phase,
2-wire systems
■ 0.5 A to 5000 A range
■ Compact and light
weight
■ PC card data storage
■ Power recording for individual waveforms
■ Simultaneous recording of demand values and
harmonics
■ POWER MEASUREMENT SUPPORT SOFTWARE 9625
The photo shows the 3169- 21 combined with CLAMP ON SENSORS 9661 and 9669
(optional) for measuring two systems.
The 3169-20/21 can also be used in combination with CLAMP ON SENSORS (optional) rated
up to 5000 A.
Offering a new approach to energy-related measurement
such as energy conservation, ISO14001 testing, equipment diagnosis, and harmonics measurement.
Measures power lines of up
to 254 mm in diameter
FLEXIBLE CLAMP
ON SENSOR
9667
MAX. AC 5000A
CLAMP ON POWER HiTESTERs are 3169-20 and 3169-21 that allow measurement of single-phase to
three-phase 4-wire circuits with a single unit. In addition to measuring standard parameters such as voltage,
current, power, power factor, and integrated values, these clamp-on power meters can simultaneously
perform demand measurements required for carrying out power management and energy-saving measures,
as well as harmonic measurements. The two new power meters also feature PC card data storage, and come
equipped with an RS-232C interface for PC communications. Further, with greater data processing speeds,
it is possible to measure the power of just a few cycles, enabling more detailed and effective energy-saving
measures for equipment. The 3169-20 and 3169-21 are ideal for users who want to achieve close control
over energy-saving management activities and measures.
1
Offering a new measurement
method for energy saving activities
All in a compact A5-size unit
Example of use in combination with four CLAMP ON SENSOR 9661 (optional)
CLAMP ON POWER HiTESTER 3169-21
(Shown with D/A output)
Simultaneous recording
of a variety of signal and
energy-saving data.
Simultaneous measurement of two 3-phase,
3-wire systems.
Select the clamp-on sensor type most
suited to your measurement needs for each
individual circuit.
CLAMP ON SENSOR 9661 (500 A AC)
CLAMP ON SENSOR 9669 (1000 A AC)
(optional)
Allows high-speed data transfer to
a PC card for each waveform or at
intervals of 0.1, 0.2, or 0.5 second.
VOLTAGE CORD 9438-03 (4 provided)
Features
■ Measure power lines of up to four systems
(with a common voltage)
One single unit can measure four circuits (single-phase 2-wire), two
circuits (3-phase, 3-wire), or a one circuit (3-phase, 4-wire)system.
■ A wide range of measurement functions
The 3169-20/21 can simultaneously measure voltage, current, power
(active, reactive, and apparent), integrated power, power factor, and
frequency. Further, when using 3-phase, 3-wire (3P3W2M) mode, you
can display the voltage and current for all three lines by measuring just
two of them. When using the 3-phase, 4-wire (3P4W4I) mode, neutral
line current can be displayed using 4 current measurement.
■ Housed in a compact A5 body size
The 3169-20 and 3169-21 feature a compact design that makes them
portable and easy to use in tight spaces, and are approximately 30%
more compact than the CLAMP ON POWER HiTESTER 3166.
■ Multi-language Compatibility
Select from nine languages, including Japanese and English.
■ Detect incorrect connection using vector
diagrams
■ Equipped with ranges from 0.5 A to 5000 A
Use the vector display on the connection confirmation screen to check
the phase, whether a connection is loose, or whether the clamp-on sensor
connection has been reversed during VT/CT terminal measurement.
The power meters support seven types of clamp-on current sensors to
enable measurement for a variety of items, from CT terminals to large
current and thick power lines.
■ Polarity display and measurement using the
reactive power measurement method
■ Supports high-speed data storage from
individual waveforms
When using the standard mode to perform integrated power measurement,
you can store data in intervals starting from one second, and when
simultaneously measuring integration and harmonics, in intervals starting
from one minute. When in the fast mode, you can store RMS data for
individual waveforms.
■ PC Card compatible plus internal hard drive for
extra memory
Store valuable measurement data in convenient PC cards. The internal
memory (1 MB) supports measurement over extended periods and detailed
measurement parameters.
The units come equipped with a polarity display for checking LAG/
LEAD when measuring power factor or reactive power. Further, you
can select the reactive power measurement method, or display the phase
factors for RMS values and power comparison.
■ High-speed D/A output
The 3169-21 comes equipped with 4-channel high-speed D/A output to
enable analog output of RMS values for individual waveforms.
■ Ideal for power and harmonics management
The power meters come equipped with a harmonics measurement
function that supports measurement of 3-phase power lines. They can
also perform simultaneous measurement of harmonics and demand
values, enabling both power and harmonics management.
The ultimate in clamp-on power meters!
Voltage (VOLTAGE CORD 9438-03)
input terminal
Sleek Design and Engineering
Current (CLAMP ON SENSOR)
input terminal
2
D/A output terminal pin placement
Use the CONNECTION CABLE 9441 to connect
to external devices. (Output resistance: 100 Ω)
The photo shows the 3169-21 with
D/A output.
Pin
Signal name
D/A output ch1
D/A output ch2
D/A output ch3
D/A output ch4
1
2
3
4
5 to 8
Contrast adjust
volume
GND
D/A output terminal
Key lock switch
External I/O terminal
Power inlet
RS-232C port
Power switch
PC card slot
External I/O terminal pin placement
150.00V
300.00V
600.00V
Voltage
150.00V
300.00V
600.00V
Connection
Single-phase 2-wire
Single-phase 3-wire
Three-phase 3-wire
Three-phase 4-wire
Single-phase 2-wire
Single-phase 3-wire
Three-phase 3-wire
Three-phase 4-wire
Single-phase 2-wire
Single-phase 3-wire
Three-phase 3-wire
Three-phase 4-wire
Current
Connection
Single-phase 2-wire
Single-phase 3-wire
Three-phase 3-wire
Three-phase 4-wire
Single-phase 2-wire
Single-phase 3-wire
Three-phase 3-wire
Three-phase 4-wire
Single-phase 2-wire
Single-phase 3-wire
Three-phase 3-wire
Three-phase 4-wire
Pin
Signal name
Start/stop input
4
Data storage input
Free
5
GND
Status output
CLAMP ON SENSOR 9695-02
CLAMP ON SENSOR 9661
(CAT III 300V)
(5A, 10A, 50A, 100A, 500A)
(500mA, 1A, 5A, 10A, 50A)
CLAMP ON SENSOR 9694
Voltage
Signal name
1
2
3
Use the CONNECTION CABLE 9440 to connect to external devices.
Range Configuration Table
Current
Pin
CLAMP ON SENSOR 9660, 9695-03
(CAT III 300V) (500mA, 1A, 5A)
(CAT III 300V) (5A, 10A, 50A, 100A)
500.00mA
1.0000A
5.0000A
10.000A
50.000A
100.00A
500.00A
150.00 W
300.00 W
1.5000kW
3.0000kW
15.000kW
30.000kW
150.00kW
225.00 W
150.00 W
450.00 W
300.00 W
2.2500kW
1.5000kW
4.5000kW
3.0000kW
22.500kW
15.000kW
45.000kW
30.000kW
225.00kW
150.00kW
300.00 W
600.00 W
3.0000kW
6.0000kW
30.000kW
60.000kW
300.00kW
450.00 W
300.00 W
900.00 W
600.00 W
4.5000kW
3.0000kW
9.0000kW
6.0000kW
45.000kW
30.000kW
90.000kW
60.000kW
450.00kW
300.00kW
600.00 W
1.2000kW
6.0000kW
12.000kW
60.000kW
120.00kW
600.00kW
900.00 W
1.8000kW
9.0000kW
18.000kW
90.000kW
180.00kW
900.00kW
75.000 W
150.00 W
750.00 W
CLAMP ON SENSOR 9669
100.00 A 200.00 A 1.0000kA
15.000kW
30.000kW
150.00kW
30.000kW
60.000kW
300.00kW
45.000kW
30.000kW
90.000kW
60.000kW
450.00kW
300.00kW
60.000kW
120.00kW
600.00kW
90.000kW
60.000kW
180.00kW
120.00kW
900.00kW
600.00kW
120.00kW
240.00kW
1.2000MW
180.00kW
360.00kW
1.8000MW
1.5000kW
Voltage
150.00V
300.00V
600.00V
7.5000kW
Current
Connection
Single-phase 2-wire
Single-phase 3-wire
Three-phase 3-wire
Three-phase 4-wire
Single-phase 2-wire
Single-phase 3-wire
Three-phase 3-wire
Three-phase 4-wire
Single-phase 2-wire
Single-phase 3-wire
Three-phase 3-wire
Three-phase 4-wire
15.000kW
75.000kW
FLEXIBLE CLAMP ON SENSOR 9667
500.00 A
5.0000kA
75.000kW
750.00kW
150.00kW
1.5000MW
225.00kW
150.00kW
2.2500MW
1.5000MW
300.00kW
3.0000MW
450.00kW
300.00kW
4.5000MW
3.0000MW
600.00kW
6.0000MW
900.00kW
9.0000MW
Note 1: The range configuration table displays the full-scale display values for each measurement range. Note 2:In the table, "unit W" has been replaced with "VA" or "var" for the apparentpower and reactive power measurement ranges. Note 3:Voltage and current input values 0.4% or less than the measurement range are displayed as "zero". When either the voltage or current
for the power line is zero, the power value is displayed as zero. Note 4:You can display measurement values up to 130% of each measurement range.
3
Measure hidden power waste through secure connections, simple measurement
methods, and detailed data capture.
Promises reliable measurement for power demand
requirements!
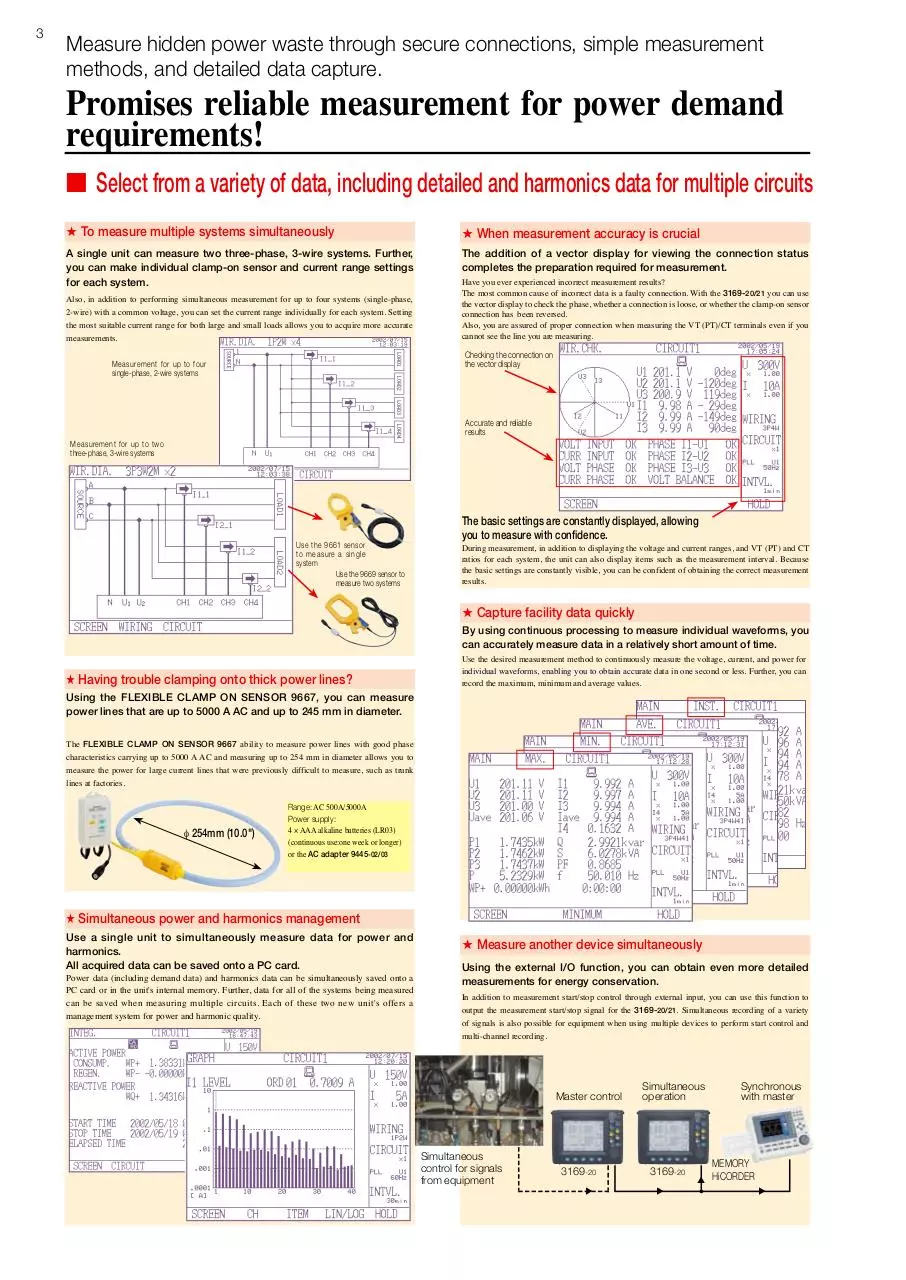
■ Select from a variety of data, including detailed and harmonics data for multiple circuits
★ To measure multiple systems simultaneously
★ When measurement accuracy is crucial
A single unit can measure two three-phase, 3-wire systems. Further,
you can make individual clamp-on sensor and current range settings
for each system.
The addition of a vector display for viewing the connection status
completes the preparation required for measurement.
Also, in addition to performing simultaneous measurement for up to four systems (single-phase,
2-wire) with a common voltage, you can set the current range individually for each system. Setting
the most suitable current range for both large and small loads allows you to acquire more accurate
measurements.
Have you ever experienced incorrect measurement results?
The most common cause of incorrect data is a faulty connection. With the 3169-20/21 you can use
the vector display to check the phase, whether a connection is loose, or whether the clamp-on sensor
connection has been reversed.
Also, you are assured of proper connection when measuring the VT (PT)/CT terminals even if you
cannot see the line you are measuring.
Checking the connection on
the vector display
Measurement for up to four
single-phase, 2-wire systems
Accurate and reliable
results
Measurement for up to two
three-phase, 3-wire systems
Use the 9661 sensor
to measure a single
system
Use the 9669 sensor to
measure two systems
The basic settings are constantly displayed, allowing
you to measure with confidence.
During measurement, in addition to displaying the voltage and current ranges, and VT (PT) and CT
ratios for each system, the unit can also display items such as the measurement interval. Because
the basic settings are constantly visible, you can be confident of obtaining the correct measurement
results.
★ Capture facility data quickly
By using continuous processing to measure individual waveforms, you
can accurately measure data in a relatively short amount of time.
★ Having trouble clamping onto thick power lines?
Use the desired measurement method to continuously measure the voltage, current, and power for
individual waveforms, enabling you to obtain accurate data in one second or less. Further, you can
record the maximum, minimum and average values.
Using the FLEXIBLE CLAMP ON SENSOR 9667, you can measure
power lines that are up to 5000 A AC and up to 245 mm in diameter.
The FLEXIBLE CLAMP ON SENSOR 9667 ability to measure power lines with good phase
characteristics carrying up to 5000 A AC and measuring up to 254 mm in diameter allows you to
measure the power for large current lines that were previously difficult to measure, such as trunk
lines at factories.
φ 254mm (10.0")
Range: AC 500A/5000A
Power supply:
4 × AAA alkaline batteries (LR03)
(continuous use:one week or longer)
or the AC adapter 9445-02/03
★ Simultaneous power and harmonics management
Use a single unit to simultaneously measure data for power and
harmonics.
All acquired data can be saved onto a PC card.
Power data (including demand data) and harmonics data can be simultaneously saved onto a
PC card or in the unit's internal memory. Further, data for all of the systems being measured
can be saved when measuring multiple circuits. Each of these two new unit's offers a
management system for power and harmonic quality.
★ Measure another device simultaneously
Using the external I/O function, you can obtain even more detailed
measurements for energy conservation.
In addition to measurement start/stop control through external input, you can use this function to
output the measurement start/stop signal for the 3169-20/21. Simultaneous recording of a variety
of signals is also possible for equipment when using multiple devices to perform start control and
multi-channel recording.
Master control
Simultaneous
control for signals
from equipment
3169-20
Simultaneous
operation
3169-20
Synchronous
with master
MEMORY
▲ HiCORDER
▲
▲
▲
Large storage capacity to accommodate power and harmonics data for individual
waveforms.‑Supports energy saving measures that can be carried out from your PC.
Greater flexiblity for energy saving measures through
detailed measurement!
■ Reduce energy consumption by "1%"! Why not try analyzing your energy saving measures?
★ Save measurement details to PC card for extended measurements!
Why not try a shorter data management interval?
With the 3169-20/21, you can set the data recording interval to 1 minute. If you are unsure how
to proceed with energy conservation, you can use a large capacity PC card to save measurement
details, then use the data to create a load fluctuation graph and analyze this to help reduce wasted
power consumption.
Further, because you can save a variety of data, including simultaneous recording of power and
harmonics data, waveform data storage, and print-outs of the screen, these two new units help by
storing measurement details.
★ Unbalanced loads are an enemy to energy saving activities.
Solve your problems with careful management of power lines.
Unbalanced 3-phase loads can result in a damaged power line.
To provide detailed management of measurements, the 3169-20/21 displays voltage and current
for all three lines even when measuring just two circuits (3P3W2M). Further, because the effective
power for each phase is displayed based on a virtual center point when measuring the voltage
and current for all three lines (3P3W3M), the units can also be used to implement energy saving
measures and power management systems.
Measurement conditions: 1-minute recording interval, when using a PC card (256 MB)
Data storage
200 days
342 days
Normal measurement (saves all items)
90 days
82 days
74 days
124 days
Normal measurement + harmonics
measurement (saves all items)
74 hours 80 hours
60 hours
92 hours
1 minute
2 minutes
5 minutes
10 minutes
15 minutes
30 minutes
1P2W × 4
1P3W × 2
3P3W2M × 2
When measuring
3P3W2M systems:
3P3W3M,3P4W
170 days 212 days
Interval
When using a
256 MB PC card
1P2W × 4 1P3W × 2 3P3W2M × 2
Normal measurement (only saves average,
integrated, and demand values)
Displays the voltage/
current difference
between each pair of
lines and average values
3P3W3M,3P4W
90 days (74 hours) 82 days (80 hours) 74 days (60 hours) 124 days (92 hours)
182 days (148 hours) 164 days (162 hours)150 days (120 hours)250 days (186 hours)
365 days (15 days) 365 days (16 days) 365 days (12 days) 365 days (19 days)
365 days (30 days) 365 days (32 days) 365 days (24 days) 365 days (38 days)
365 days (46 days) 365 days (50 days) 365 days (38 days) 365 days (58 days)
365 days (92 days) 365 days (100 days) 365 days (76 days) 365 days (116 days)
Measurement conditions: When saving all items using normal measurement, the number of days in
parentheses indicate normal measurement + harmonics measurement,
maximum measurement period of one year
★ Identify even small amounts of power waste using individual waveform measurements
The 3169-20/21 can help turn you into a keen energy saving specialist.
These two new units allow you to measure power data by recording the RMS values for individual
waveforms.
By measuring just a few seconds of machine cycles or changes in operating patterns of facilities
such as manufacturing equipment, you can grasp power fluctuations over a relatively short amount
of time and view improvements in the form of numerical data. Gain unsurpassed energy savings by
achieving simple improvements around the work environment.
When measuring with
3P3W3M systems:
Displays the effective
power for individual
phases and the threephase power values, as
well as the voltage and
current for all three lines
★ Harmonics cause wasted power
Did you think that harmonics and energy saving activities were unrelated?
Due to a spread in equipment that uses semiconductor control devices, such as inverters, power
quality has decreased. Also, power consumed in harmonic components is all wasted power.
Harmonic control and management are essential for energy conservation.
The degree of
distortion is obvious
in the voltage/current
display
Results can be easily processed using software such as Excel.
★ Improve energy-saving operations and create an energy-efficient facility
Why not try to improve your energy-saving measures using the 3169-21?
Using the D/A output (4 ch) function on the 3169-21, you can simultaneously record a variety of
measurement and control signals for equipment, such as the power fluctuation and temperature/flow
for individual waveforms, onto a HIOKI MEMORY HiCORDER or logger.
A slight reduction in power consumption due to changes in the inverter motor operating patterns or
temperature settings equals to an energy-saving effect.
The 3169-20/21 allows you to view changes that are hard to determine
from numerical data alone.
Accurate recording of
momentary fluctuations in
power, etc.
Simultaneous recording
of power volume
The current direction
of harmonic waves is
obvious
You can switch channels to easily check the harmonics for each circuit
★ To identify causal factors with harmonic measurements of multiple systems circuits
If production equipment malfunctions, power is wasted if repeated manufacture results in defective
products again.
If you think harmonics are causing malfunctions, you can simultaneously measure the harmonics
of individual circuits using multi-circuit measurement to obtain detailed information about the
occurrence of harmonics along with the current direction for each phase. Using the 3169-20/21 you
can accurately determine the relationship for harmonic inflow and outflow between power lines by
analyzing the data acquired simultaneously, and then devising energy-saving measures based on the
cause of the occurrence.
4
5
POWER MEASUREMENT SUPPORT SOFTWARE 9625
■ Graphically process measurement data from Model 3169-20/21
easily on a PC!
The POWER MEASUREMENT SUPPORT SOFTWARE 9625 application provides easy graphical processing on a
computer of measurement data saved on CLAMP ON POWER HiTESTERs 3169-20/21 and 3166.
3169-20/21
Power
Data &
Harmo
nic Da
ta
3166
armonic
ata & H
D
Power
Data
The 9625 handles both power
and harmonic measurement data
simultaneously.
Features
■ Time Series Graph Display Function
Measurement data can be displayed as a time series graph.
Demand data measured in different series can be overlaid on
the display.
■ Summary Display Function
Measurement data can be displayed directly in table form.
■ Daily, Weekly and Monthly Report Display
Function
Daily, weekly and monthly reports of demand data can be
displayed.
■ Harmonic Analysis Function
Display harmonic measurement data as a graph, list or
waveform. (Also compatible with the harmonic measurement
data captured by Model 3166.)
■ Print Function
Each screen can be printed.
Easily display and print various screens such as graphs and spreadsheet tables
Step 1. Load measurement data
Load up to 16 data sets from the 3169-20/21 or 3166 at once. Measured
numerical values and waveform data are recognized and displayed
automatically.
1. Loading and deleting data, and changing data names, can be done easily.
2. Multiple sets of measurement data can be loaded and managed in a single
file.
Step 2. Select the display (screen) type
Select from time series graph, summary, daily, weekly or
monthly report, harmonic list, harmonic graph, harmonic
waveform or settings.
Step 3. Select display items (two-axis display is possible)
1. Select the data items (up to 16) to display.
For graph displays, the type of graph (line or bar) can be
selected.
2. Enter details for data display. (data item names, levels, etc.)
Step 4. Set the start/stop times and data interval
to be displayed
1. Set the data period to display. (start/stop time and data interval)
• The displayed period can be easily changed by
scrolling.
6
■ Time Series Graph Display Function
(two-axes display possible)
■ The displayed graph can be set to suit particular start/stop times and
data intervals. Harmonic time series graphs can be displayed.
Convenient Functions
(1) The horizontal (time) axis can be easily scrolled to show the
desired range.
(2) Upper and lower limits (measurement values) of the vertical
axis can be easily set and changed.
* Graph type (line, bar or stacked bar), line type (such as solid or dashed),
color and details of upper and lower numerical values can be set.
(3) Any desired numerical data value on a graph can
be confirmed and displayed by cursor movement.
(4) The display can be switched between 2D and 3D
graphs.
Cursor Value
Upper/Lower
Limit Setting
Slider
■ Summary Display Function
Summary
■ Displays a summary of the data values between specified start/
stop times, at the specified data interval.
Convenient Functions
(1) In addition to measurement values within the period being
displayed, the summary shows period, maximum, minimum
and average values.
(2) Measurement data names and measurement units can be edited
in the summary.
Daily, Weekly or Monthly Report Display
■ Displays a summary covering the total values in daily, weekly
or monthly reports.
Convenient Functions
(1) The time axis for each total scrolls to easily change the
totalized period.
(2) The total time range of measurement
data can be totalized in up to four
sections per time period.
■ Harmonic Display Function
Harmonic data measured by the 3169-20/21 and 3166 can be displayed in various ways
Harmonic Time Series Display
■ While displaying a time series graph, select the harmonic
item for the vertical axis to display a time series graph of
harmonics.
Convenient Functions
(1) Up to 32 graphs can be displayed simultaneously using
2-axes display.
For one circuit measurement, up to 32 orders can be
graphed. Using multiple instruments, time series of
harmonics can be easily compared.
(2) Any desired chronological detail can be easily confirmed
using the cursors on the graph.
Harmonic List Display
■ Displays harmonic data for the selected
display item as a list.
View the list to confirm details
Harmonic Graph Display
■ Displays harmonic data for the selected
display item as a bar graph.
View the power graph to confirm trends in harmonics
Simultaneously display multiple
orders to confirm changes in
harmonics!
Simultaneously display data from
multiple instruments to confirm
concurrent series of harmonics!
Harmonic Waveform Display
■ Displays the voltage and current
waveforms upon which harmonic data
is based.
View the waveforms to confirm distortion conditions
7
■ Settings Display Function
■ Print Function
When you select a data name to be load, the measuring instrument
model and setting conditions at measurement time are displayed.
Measurement data and measurement conditions can be managed
at the same time.
Reports and screen copies of the displayed screen can be easily printed.
Convenient Functions
(1) Printing results can be confirmed by print preview.
(2) When creating a report, screen data can be copied and pasted into a
commercial word processor program.
Preview printing to confirm print results
before printing
Produce daily, weekly or monthly reports by
one-touch report printing
Graph copying is also a one-touch operation
■ 9625 Specifications
■ General Specifications
Supported instrument : 3169-20, 3169-21 and 3166(CLAMP ON POWER HiTESTERs)
models
Operating environment : Computer: PC-AT compatible (DOS/V machine)
CPU: Pentium 200 MHz or higher
Memory: 128 MB or more (recommended)
Hard disk: 128 MB or more free space
Display: XGA (1024×768) or higher
Disc device: CD-ROM drive (for installation)
Operating system: Windows 2000, XP (English edition)
Supplied Media
: One CD-R disc
■ Functional Specifications
[Data/Setting Load/Save Functions]
Loading data /Setting
Data file
3169-20/21 Waveform data file
3166
9625
Data format
CSV
CSV
WUI
Binary
Data contents
Instantaneous value, average value, maximum value, minimum value,
integrated value, demand value, harmonic
Instantaneous waveform
Short-interval data file
BIN
Binary
Integrated measurement data file
ITG
CSV
Instantaneous value, integrated value
Demand measurement data file
DEM
CSV
Instantaneous value, maximum value, minimum value, demand value
Harmonic measurement data file
HRM
CSV
Instantaneous value, average value, maximum value
Waveform data file
WUI
Binary
Setting file
SET
–
Combined file
DAT
Binary
File extension
Data format
DAT
Binary
Saved data /Setting
9625
File extension
Combined file
Instantaneous values
Instantaneous waveform
Maximum data capacity : Up to 528 MB per data set (total composite data up to 1.5 GB)
[Time Series Graph
Display Function]
Graph display item
Y-axis upper/lower
limit setting
Interval setting
Display period range
setting
: Voltage, current, active power, reactive power, apparent power,
power factor, frequency, Integrated value(active power, reactive power),
demand, harmonic (level, content ratio, phase angle, total value, THD)
: The display position (upper and lower display limits) of the vertical
(Y) axis of a graph can be set by scroll bar or by specifying values.
: Select each cycle, or 0.1, 0.2, 0.5, 1, 2, 5, 10, 15 or 30 sec.; 1, 2,
5, 10, 15 or 30 min.; or 1, 2, 3, 4, 6, 8 or 12 h; or 1 day
: An optional analysis period can be specified from the overall
measurement data period
(1) Analysis start date and time (YMD, HMS) is specified numerically
(2) Analysis stop date and time (YMD, HMS) is specified numerically
Display of measurement data period (measurement start
and stop date and time)
Reference value setting
Graph type selection
Graph line type & color
setting
Stacked bar graph
display
: Display set standard value
: Line, bar, 2-axes and 3-dimensional
: Line type and display color can be set for each data set,
and marker display is possible
: Up to 16 types of data series (demand value, demand quantity )
can be displayed in an overlay graph
Cursor measurement : Measurement values can be displayed by the cursor
Data display units setting : Engineering units (m, k, M, G, etc.) can be selected
8
[Summary Display
Function]
Display item selection
Daily, weekly and
monthly report display
Load factor calculation
display
Independent time range
totalizing
CO2 conversion display
[Harmonic Display
Function]
Waveform display
List display
Graph display
Cursor measurement
[Setting Display
Function]
Setting display
: Select the items to display in the summary
: Displays a report for the specified daily weekly or monthly period
: Calculates the load factor and demand factor as a daily, weekly
or monthly report, and displays the results
: Specify up to four time ranges and totalize data for each time
range independently
: Display the integrated active power (kWh) in CO2 according to
the conversion rate.
: Displays waveform data for a specified time
: Displays a list of harmonic data for a specified time
: Display a bar graph of harmonic data for a specified time
: Displays the value at the cursor with waveform and graph displays
: Displays a list of the setting conditions
Loads setting conditions from a data file (3169-20/21)
Loads setting conditions from a settings file (3166)
[Copy Function]
Copies to the clipboard : Each display can be copied to the clipboard
[Print Function]
Printing a displayed time
series graph
Printing a displayed
summary
Printing a harmonic
display
Printing the settings
display
Comment entry
Printing support
[Display Language]
Language
: Previews and prints the contents displayed on a time series graph
: Previews and prints the contents displayed in a summary
: Previews and prints the contents displayed in a harmonic
spreadsheet
: Previews and prints the contents displayed in the settings
display
: Text comments can be entered in any printout
: Any color or monochrome printing supported by the operating
system
: English
[CSV Format
Conversion Function]
Convertible screens : Time-series graph; Summary; Daily,Weekly and Monthly
Report; Harmonic Waveform
■ 3169-20/21 Specifications
■ Basic Specifications
■ Display Specifications
Measurement line type : Single-phase 2-wire, single-phase 3-wire, three-phase 3-wire, and
Instantaneous value : Voltage, current, active power, reactive power, apparent power,
power factor, frequency, average voltage, average current, (average
display
Number of systems
that can be measured
(for systems that share
the same voltage)
three-phase 4-wire systems (50/60 Hz)
:
Single-phase: 1P2W. . . . . . . . . . . . . . . . . . . . . . . . . . . . . . . . . . 4 systems
1P3W. . . . . . . . . . . . . . . . . . . . . . . . . . . . . . . . . . 2 systems
Three-phase: 3P3W2M (measures the voltage and current for two lines). . . . . . . 2 systems
3P3W3M (measures the voltage and current for all three lines) . . . . 1 system
3P4W (measures the voltage and current for three lines). . . . . . . . . 1 system
3P4W4I . . . . . . . . . . . . . . . . . . . . . . . . . . . . . . . 1 system
Item
Measurement range
Measurement method
Input methods
Effective measurement area
Total display area
Display
Range switching method
Display update rate
:
:
Maximum rated voltage to earth :
:
Crest factor
Internal memory capacity :
Input resistance
(50/60 Hz)
Maximum input
(measures the voltage for three lines and the current for four lines)
: Voltage, current, active power, reactive power, apparent power,
power factor, integrated value, frequency, harmonics
: For the voltage, current, and active power ranges, see the range
configuration tables on page 2.
: Simultaneous digital sampling of voltage and current, PLL synchronization
or a fixed clock (50/60 Hz)
: Voltage: Isolated input
Current: Isolated input using a clamp-on sensor
: Within 5 to 110% of the range
: Voltage and current:
Within 0.4 to 130% of the range
(zero is suppressed for less than 0.4%)
Power:
Within 0 to 130% of the range
(zero is suppressed when the voltage or current is zero)
Harmonic level: Within 0 to 130% of the range
: 5.7-inch LCD (320 × 240 dots), with backlight
: Manual (the current range can be set for each system)
: Approx. every 0.5 seconds
(except when using a PC card while accessing the internal memory, or when performing RS-232C communications)
Voltage: 2.0 MΩ ± 10% (differential input)
Current: 200 kΩ ± 10%
Voltage input: 780 Vrms AC, peak value: 1103 V
Current input: 1.7 Vrms AC, peak value: 2.4 V
Voltage input terminals: 600 Vrms AC (50/60 Hz)
Voltage: Less than 2 (for full-scale input)
Current: Less than 4 (for full-scale input. However, less than 2 for the 500 A, 1 kA, and 5 kA ranges)
1MB
values are for each system)
Average value display : Voltage, current, active power, reactive power, apparent power,
power factor, frequency, average voltage, average current
* The average value from the beginning of time series measurement until the present.
Maximum/minimum : Voltage, current, active power, reactive power, apparent power,
power factor, frequency
value display
Integrate display
* The maximum/minimum value from the beginning of time series measurement until the present.
* The total integrated value from the beginning of time series measurement.
* The integrated value within each specified interval (latest value).
: Integrated value
Active power (consumption/regeneration)
Reactive power (lag/lead)
Demand volume display : Integrated value
(Integrated value within Active power volume (consumption/regeneration)
Reactive power volume (lag/lead)
the specified interval)
Demand value display
(average value within
the specified interval)
Maximum demand value display
(average value within the
maximum specified interval)
Harmonics list
Harmonics graph
: Active power (consumption), reactive power (lag), power factor
* The demand value within each specified interval (previous value).
: The maximum demand value since the beginning of time series
measurement and the time and date it occurred.
: List of the items measured for the specified harmonic (numerical
value).
(including the total value and total harmonic distortion factor (THD-F/THD-R))
: Bar graph or vector diagram of the items measured for the specified
harmonic.
(cursor measurement, magnification update, with a linear/LOG axis selection function)
Waveform display : Voltage and current waveforms (with a magnification update
function)
Measurement value : Select and enlarge up to 5 items from the instantaneous value
enlargement display display.
■ Measurement Specifications
[Voltage/current measurement]
Measurement method : True RMS method
Measurement display : Measurement of three voltage lines and 3 or 4 current lines is possible
when using three-phase 3-wire and three-phase 4-wire systems
[Active power measurement]
Measurement display : For three-phase 3-wire (the 3P3W3M setting), refer to the display for
Polarity display
phase power values.
: For consumption: no symbol, for regeneration: "-"
[Reactive power measurement]
Using the reactive : ON: Measures the reactive power directly using the reactive power
measurement method
power measurement
OFF: Calculates the reactive power from the measurement values for
method
Polarity display
voltage, current, and active power
: For lag phase (LAG : current is slower than voltage): no symbol
For lead phase (LEAD: current is faster than voltage) : "-"
(Reactive power measurement method "ON")
[Apparent power measurement]
: No polarity
Polarity display
[Power factor measurement]
Measurement range : -1.0000 (lead) to 0.0000 to +1.0000 (lag)
: For lag phase (LAG: current is slower than voltage) :no symbol
Polarity display
For lead phase (LEAD: current is faster than voltage) : "-"
[Frequency measurement]
Measurement range : 40.000 to 70.000 Hz
: Within 10 to 110% of the range (for sine wave input)
Input area for
guaranteed accuracy
Measurement source : Voltage U1
[Frequency measurement]
Measurement range : 40.000 to 70.000 Hz
: Within 10 to 110% of the range (for sine wave input)
Input area for
guaranteed accuracy
Measurement source : Voltage U1
[Integrated measurement]
Measurement range : Active power : 0.00000 mWh to 99999.9 GWh consumption
Reactive power :
Measurement display : Active power :
Reactive power :
[Harmonic measurement]
Measurement range
Measurement method
Order for analysis
Window width
Window type
Analysis rate
Item for analysis
:
:
:
:
:
:
:
:
:
:
-0.00000 mWh to -99999.9 GWh regeneration
0.00000 mvarh to 99999.9 Gvarh lag
-0.00000 mvarh to -99999.9 Gvarh lead
Displays consumption and regeneration separately
Displays lag and lead separately
Basic wave frequency: 45 to 66 Hz
PLL synchronization
Up to the 40th order
A single cycle (number of data points analyzed: 128 points)
Rectangular
1/16 cycles
Harmonic level:
The voltage, current, or power level for
each harmonic order
Harmonic content percentage: The voltage, current, or power
content percentage for each harmonic order
Harmonic phase angle:
The voltage, current, or power phase
angle for each harmonic order
Total value:
The total value for voltage, current, or
power up to the 40th harmonic order
Total harmonic distortion factor: For voltage or current
(THD-F or THD-R)
Download HIOKI 3169 ENG
HIOKI_3169_ENG.pdf (PDF, 2.29 MB)
Download PDF
Share this file on social networks
Link to this page
Permanent link
Use the permanent link to the download page to share your document on Facebook, Twitter, LinkedIn, or directly with a contact by e-Mail, Messenger, Whatsapp, Line..
Short link
Use the short link to share your document on Twitter or by text message (SMS)
HTML Code
Copy the following HTML code to share your document on a Website or Blog
QR Code to this page

This file has been shared publicly by a user of PDF Archive.
Document ID: 0000326470.