HIOKI 3390 ENG (PDF)
File information
Title: POWER ANALYZER 3390
Author: HIOKI
This PDF 1.7 document has been generated by Adobe InDesign CS5.5_J (7.5.3) / Adobe PDF Library 9.9, and has been sent on pdf-archive.com on 24/12/2015 at 15:41, from IP address 5.18.x.x.
The current document download page has been viewed 546 times.
File size: 5.12 MB (16 pages).
Privacy: public file


File preview
POWER ANALYZER 3390
Power measuring instruments
Maximum accuracy of ±0.16%
achieved with current sensors!
o Measure the primary and secondary sides of inverters
o Advanced motor analysis functions
o Measure inverter noise
V
A
kW
Large Assortment of Wide-band, High-Precision Feed-Through Current Sensors
4 Models
50A
200A
500A
1000A
Effect of conductor position
Effect of external
electromagnetic field
Completely Minimized
CT6862
CT6863
9709
CT6865
2
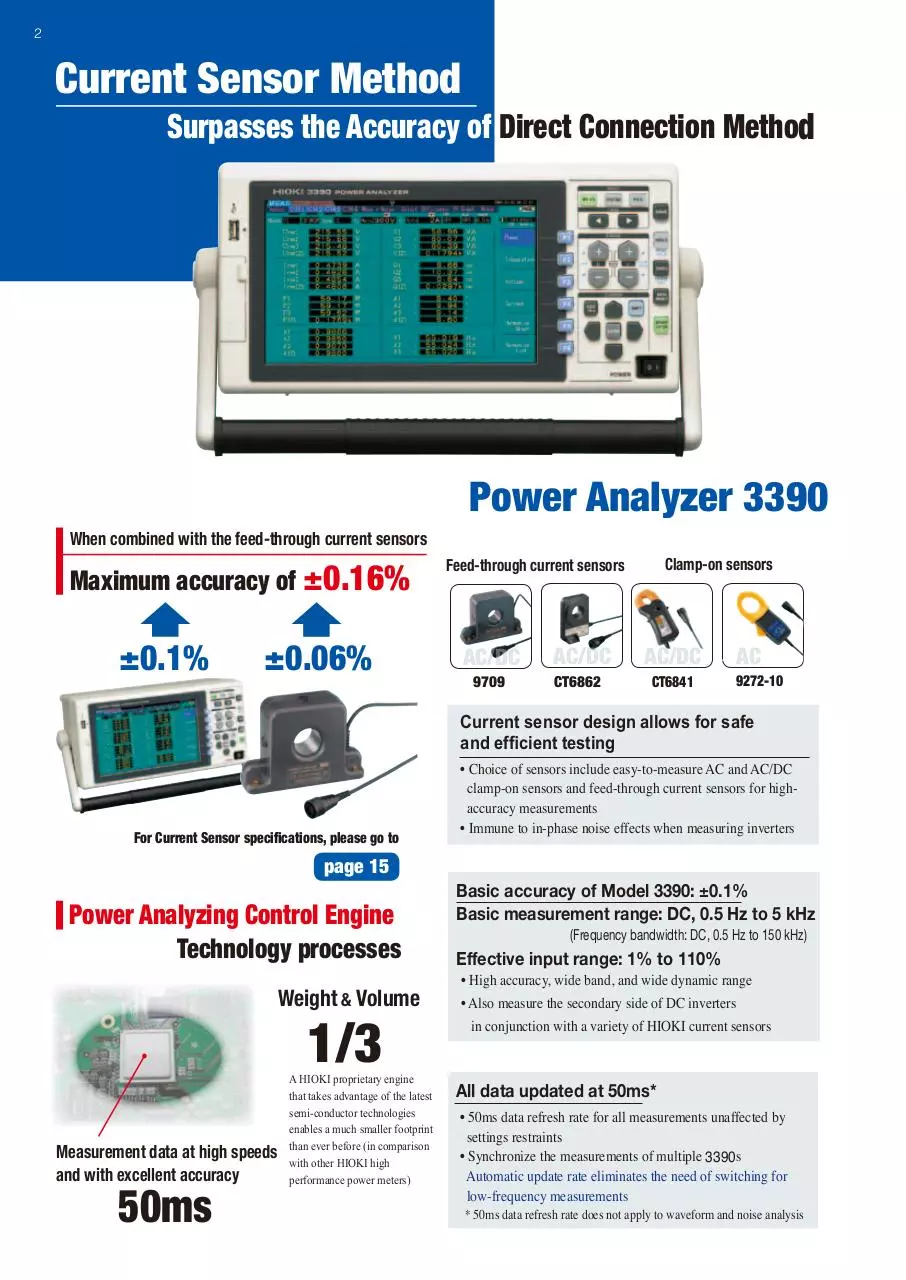
Current Sensor Method
Surpasses the Accuracy of Direct Connection Method
Power Analyzer 3390
When combined with the feed-through current sensors
Maximum accuracy of ±0.16%
±0.1%
±0.06%
Clamp-on sensors
Feed-through current sensors
AC/DC
9709
AC/DC
CT6862
AC/DC
CT6841
AC
9272-10
Current sensor design allows for safe
and efficient testing
For Current Sensor specifications, please go to
• Choice of sensors include easy-to-measure AC and AC/DC
clamp-on sensors and feed-through current sensors for highaccuracy measurements
• Immune to in-phase noise effects when measuring inverters
page 15
Power Analyzing Control Engine
Technology processes
Weight & Volume
1/3
Measurement data at high speeds
and with excellent accuracy
50ms
A HIOKI proprietary engine
that takes advantage of the latest
semi-conductor technologies
enables a much smaller footprint
than ever before (in comparison
with other HIOKI high
performance power meters)
Basic accuracy of Model 3390: ±0.1%
Basic measurement range: DC, 0.5 Hz to 5 kHz
(Frequency bandwidth: DC, 0.5 Hz to 150 kHz)
Effective input range: 1% to 110%
• High accuracy, wide band, and wide dynamic range
• Also measure the secondary side of DC inverters
in conjunction with a variety of HIOKI current sensors
All data updated at 50ms*
• 50ms data refresh rate for all measurements unaffected by
settings restraints
• Synchronize the measurements of multiple 3390s
Automatic update rate eliminates the need of switching for
low-frequency measurements
* 50ms data refresh rate does not apply to waveform and noise analysis
3
Meet the Needs of Alternative Energy and Inverter or Motor Evaluations
4-channel isolated input
Measure the primary and secondary sides
of inverters simultaneously
Ideal for Motor Evaluation
and Analysis
• Choose wiring from single-phase two-wire to
three-phase four-wire
• Synchronize the measurements of multiple 3390s
• Use of the MOTOR TESTING OPTION 9791 (or 9793)
allows torque meter output and rotation input,
and facilitates motor power measurement
For motor evaluation and analysis specifications,
please go to
pages 8 & 9
A Variety of Interfaces Standardly Equipped
Includes 100Mbps Ethernet and USB 2.0 High
Speed communications interfaces.
Even More!
• Connect up to four 3390s and synchronize their clocks and
measurement timing for multiple-channel measurements
(using the SYNC terminal and Connection Cable 9683)
• Use dedicated application software to conduct synchronized
operations for up to 4 units and obtain all the measurement data
CF card interface
& USB memory interface
Automatically save interval measurement data to a CF card
(When saving manually, measured data and waveform data can
be saved directly to the CF card
and USB memory)
HTTP server function available with free
dedicated PC software
• HTTP server function through web browser enables
easy remote operation
• Free dedicated PC application can be downloaded from
the HIOKI website
Collect data and operate the 3390 remotely
by connecting it to a PC via LAN or USB
page 11
Waveform Output and 16 Channel
D/A output
• Use the D/A OUTPUT OPTION 9792
to update data every 50ms and output up to
16 items in analog format
• Also output the voltage and current
waveforms for each channel
(using 1 to 8 channels)
(Waveforms are output at 500 kS/s and sinusoidal
waveforms can be represented accurately at up to 20 kHz)
Measured waveform at 60Hz
Waveform output
D/A output waveform
4
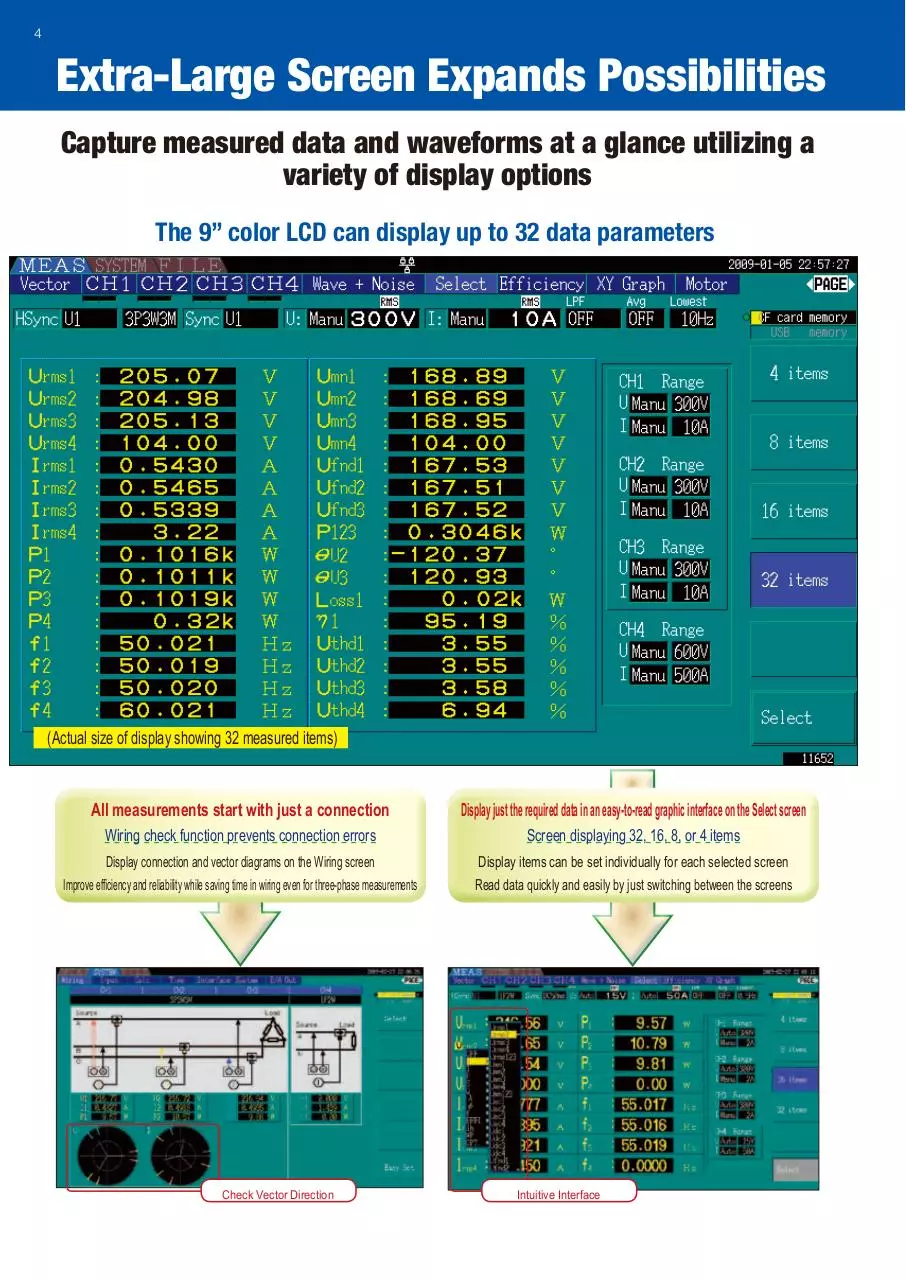
Extra-Large Screen Expands Possibilities
Capture measured data and waveforms at a glance utilizing a
variety of display options
The 9” color LCD can display up to 32 data parameters
(Actual size of display showing 32 measured items)
All measurements start with just a connection
Display just the required data in an easy-to-read graphic interface on the Select screen
Wiring check function prevents connection errors
Screen displaying 32, 16, 8, or 4 items
Display connection and vector diagrams on the Wiring screen
Improve efficiency and reliability while saving time in wiring even for three-phase measurements
Display items can be set individually for each selected screen
Read data quickly and easily by just switching between the screens
Check Vector Direction
Intuitive Interface
Switch screens at the
touch of a button
All data is processed
in parallel simultaneously.
Verify All Data
At a Glance
A wealth of data analysis functions all built-in and ready to use.
Channel display
RMS and MEAN values, and AC, DC, and fundamental waveform
components can be measured and displayed simultaneously
V rms value
V mean value
Vectors display
Measured voltage, current,
and power on channels 1 to
4 as numerical values and as
vectors
V fundamental value
Channel Display
Channel display
One-touch
Switching
Measured power, voltage and
current values, integration
values, with access to harmonic
graphs and lists for each channel.
Harmonic analysis display
Fast
500kS/s
Harmonics graph display
Wave+Noise display
Ideal for frequency analysis of
inverter noise (FFT nalysis)
Harmonics list
display
Efficiency display
Simultaneously
display efficiency
and power loss
Harmonic Analysis
to the 100th Order
XY graph display
Power and torque display
makes it easy to understand
the motor I/O characteristics
Feed-through Current Sensor Enable Extremely Accurate Measurements
HIOKI's high-performance feed-through current sensors absolutely minimizes the effects of conductor position
and external fields, making them exceptionally precise. Repeatability and stability are absolutely unmatched!
CT6862
9709
CT6863
AC/DC 200A
AC/DC 50A
AC/DC 500A
CT6865
AC/DC 1000A
Reference data (9709)
Reference data (9709)
0
1
2
3
4
5
Position
6
7
8
at 100ADC input, when measuring a 10mm diameter wire
9
Current converted as input [A]
Deviation [ % ]
*For further information and specifications, please refer to page 15.
Effect of Conductor Position
0.05
-0.05
Feed-through current sensors meet a large variety of applications
from electric or hybrid vehicle testing, inverter motor evaluations
and solar power devices and fuel cell analysis to individual testing
of electrical appliances and facilities equipment.
0.05
Effect of nearby conductors
0
-0.05
1
2
3
4
5
6
7
8
Position
at 100ADC input, when measuring a 10mm diameter wire
5
6
Measure the primary and secondary sides of inverters
(Performance evaluation of motors and inverters)
Accurately and easily measure the power of inverters and motors for a wide range of applications, from research and development to field tests
Advantages
1. Isolated input of voltage and current lets you measure the power on the primary and secondary sides of inverters simultaneously.
2. Using a non-invasive current sensor makes the connection simple and easy. A vector diagram display ensures connections are checked.
Proprietary HIOKI Technology
3. Accurately measure the fundamental wave voltage and current values related to the motor axis output with confidence
4. All data is measured simultaneously and updated every 50 ms.
5. In addition to the harmonic analysis required to evaluate the inverter control, noise components can also be measured at the same time - ideal for
determining the leakage of inverter noise
6. Use of a current sensor reduces the effect of in-phase noise from inverters when measuring the power
1
Inverter
Three-phase
three-wire
To ensure accurate measurements:
• Understand the connections and input states while looking at the connection diagram screen
Checking unsure connections allows you to perform measurements without worry
Motor
Measurement parameters
Voltage, current, power, power factor, ±electrical
energy, harmonic analysis, noise measurement,
frequency
Measure the primary side of inverters Measure the secondary side of inverters
(Using channels 1, 2, and 3)
2
(Using channels 1, 2, and 3)
PC measurements and synchronizing multiple devices
• Dedicated application software allows you to perform PC measurements
right out of the box
LAN and USB compatibility facilitates efficient data collection and remote
operation. Bundled application software allows you to control up to 4 units.
Interval measurement with LAN or USB connection
• Acquire all data even when multi-unit measurements are performed
Two units can be connected using the CONNECTION CABLE 9683 (option) to
synchronize the internal clocks and control signals.
Interval measurements with the two units allow the acquisition of perfectly synchronized data,
making it easy to collect completely harmonized data with a CF card without using a PC.
CONNECTION CABLE 9683
Inverter
PC
Three-phase power supply
Motor
CF card
Interval measurement enables
the acquisition of perfectly synchronized data
n What's so special about inverter motors?
Inverter motors are indispensable as the power source of industrial equipment.
The rotation of an induction motor depends on the input frequency, so if this input
frequency can be made variable, the rotation can be controlled freely. Development
of a frequency conversion technology called an inverter has made it possible to
freely control the rotation of motors.
In recent years, the mainstream inverter control method is the PWM (Pulse-width
Modulation) method.
CF card
l Conventional measurement method
Traditional methods use the average rectified RMS indication (Mean) in order to
obtain a component value close to the fundamental wave frequency from a pseudo
sinusoidal waveform (fundamental wave + carrier wave) to be input. To measure
an accurate fundamental component, frequency analysis was required; however, the
conventional processing method was not practical because it could barely perform
real-time measurements with FFT as a result of the limited computing power.
Mean value
l What is the PWM method?
A pseudo sinusoidal waveform (fundamental wave) resulting from the conversion
of the fundamental wave frequency that determines the rotation of a motor to a
pulse train called a carrier frequency (at about several kHz to 15 kHz) is effected,
controlling the number of rotations.
l Performance evaluation and electrical measurement of motor
The axis output of a motor is closely related to the fundamental wave frequency
to be input, so an accurate measurement of this fundamental wave component is
required to evaluate the input characteristics.
Full-wave rectification
PWM waveform
Mean-value processing & coefficient processing
Mean value (average rectified RMS indication value)*
* Method to measure RMS values at a single frequency
l The 3390 is capable of measuring the fundamental wave component accurately.
The 3390 performs this frequency analysis using high-speed harmonic
computation processing at an interval of 50 ms and displays the true
fundamental wave component.
7
3 To make the best of inverter motor measurements:
• Parameters critical to the measurement of motor inputs (outputs on the secondary side of inverters) can be measured and displayed simultaneously.
Display item
rms value
mn value
fnd value
thd value
unb value
±pk value
dc value
ac value
f value
4
Measurement details
RMS value of fundamental wave + carrier wave components
RMS value (mean value) close to the fundamental wave component
True fundamental wave component
Displays the distortion factor of measured waveform
Displays the balance between phases
Maximum positive/negative values of waveform that is being measured
Displays a DC component harmful to the motor
RMS value obtained by removing the DC component from the RMS value
Frequency of each phase
Clearly display efficiency and loss of inverters
• Efficiency and loss measurement function built-in
The operating efficiency and power loss of an inverter can be displayed when
measuring the inputs and outputs of the inverter simultaneously.
6 Harmonic measurement indispensable for inverter evaluation
• 4-channel simultaneous harmonic analysis function built-in
(Performed simultaneously with power measurement)
Harmonic analysis is essential for the development and evaluation of inverters
Synchronized to the fundamental wave frequency from 0.5 Hz to 5 kHz
Harmonic analysis up to the 100th order can be performed simultaneously with
power measurement.
5
X-Y graph display lets you check the dynamic
characteristics of inverters
• X-Y graph display function built-in (X-axis: 1 item, Y-axis: 2 items)
By simply specifying the voltage for the X-axis and the power consumption and efficiency
for the Y-axis, you can display the dynamic characteristics of a motor in real time.
7 Evaluate of the troublesome noise of inverters
• Noise measurement function built-in (1-channel measurement: Performed
simultaneously with power measurement and harmonic analysis)
Noise components at up to 100 kHz can be read while looking at the measured waveforms
Simultaneously display the top 10 point frequency and voltage/current levels
8 Waveforms can be observed at 500 kS/s, and fundamental waves can also be checked
• Waveform monitoring function fully supported
Display the voltage and current waveforms being measured
The carrier frequency components of an inverter are also displayed in real time
• Filter function
A filter function is used to remove the carrier frequency components from the inverter,
and fundamental wave frequency waveforms can be checked in the waveform display.
* The filter function is reflected in the measured values. Please
be careful when you switch to the function during measurement.
Waveform monitoring of carrier frequency
When the 500 Hz filter is turned ON
8
Geared for the latest motor evaluation and analysis of
Hybrid Electric Vehicles, Electric Vehicles and the like
Drive the research and development of three-phase inverter motors with high accuracy and high-speed measurements
Advantages
1. Use of the MOTOR TESTING OPTION 9791 (9793) lets you perform a total evaluation of inverter motors
2. The voltage, torque, rotation, frequency, slip, and motor power required for motor analysis can be measured with one unit
3. Current sensors make the connection simple. In addition, use of the AC/DC CURRENT SENSOR enables measurements with superior accuracy
Proprietary HIOKI Technology
4. All data is measured simultaneously and updated every 50 ms. Data collection and characteristics tests can be performed at the industry’s fastest speed
5. Evolution of electrical angle measurements critical to motor analysis has made it possible to perform more accurate measurements using an
incremental encoder
6. Harmonic analysis at 0.5 Hz to 5 kHz without the need for an external timing mechanism
7. Built-in digital anti-aliasing filter (AAF) lets you measure the broadband power on the secondary side of inverters to make accurate harmonic analyses
l Example of HEV and EV measurement systems
Inverter
Torque sensor
Battery
Encoder
Motor
Load
Measure the primary side of inverters
Measure the secondary side of inverters and of motor outputs
Voltage, current, power, power factor,
±electrical energy, frequency, harmonic
analysis *1, noise measurement
Voltage, current, power, power factor, ±electrical energy,
inverter loss, efficiency *1, harmonic analysis *2, noise
measurement, rotation, torque, slip, and motor power
(Using 4 channels)
(Using channels 1, 2, and 3, and the Motor Testing Option)
+
*1: Harmonic components superimposed on the DC
can be analyzed by synchronizing to the secondary
side
Torque sensor
• Torque
• Rotation
9791 (9793)
1 Evaluate high-performance vector control inverters:
• Measurements of fundamental wave voltage and current and their phases based on an accurate
harmonic analysis are indispensable to motor analysis
• Support of an incremental encoder allows detecting synchronization signals from a motor easily
and accurately
Electrical angle measurements are indispensable for dynamic characteristics analysis of motors.
The 3390 can conduct FFT analyses synchronized to rotation pulses from the tachometer and the motor
induced voltage, and the A-phase and Z-phase pulse inputs that allow measuring and detecting the origin
of the motor more simply and accurately – fully meeting the needs of the latest motor analysis tests.
Example of sensor connection
Torque meter
Torque value / frequency output
Incremental type rotary encoder
A-phase pulse output
Z-phase pulse output
n The importance of measuring the electrical angle of synchronous motors
The key to the performance of high-performance low-fuel consumption vehicles represented
by HEV and EV is the synchronous motor that is used as the power source. The synchronous
motor is finely controlled by alternating signals generated by an inverter device (DC to AC
conversion) using the electricity from batteries.
l What is a synchronous motor?
A synchronous motor rotates in synchronization with the AC frequency. Structurally, the motor is turned
by the rotating force at the magnetic pole of the rotator (rotator magnetic pole), which is generated by
the rotating magnetic field generated by applying an alternating current to the magnetic field (stator
magnetic pole). The rotation speed is synchronized to the speed of the rotating magnetic field, so the
*1: Between the primary and secondary sides, between the secondary side
and motor output, and between the primary side and motor output
*2: If the fundamental frequency varies between the primary and secondary
sides, the harmonic analysis can be performed for only one side
Encoder A-phase signal
Encoder Z-phase signal
θ
Voltage / current waveform
■ Application 1: “Electrical angle measurement”
○ The voltage / current fundamental wave component “θ” from the machine angle origin can be
calculated by performing harmonic analysis of motor input voltage / current by synchronizing to the
A-phase signal and z-phase signal of an encoder.
○ A function to perform zero compensation for this phase angle when a motor induced voltage is
generated can be used to measure the voltage and current phase (electrical angle) in real time based
on the induced voltage when the motor is started.
speed can be controlled by changing the speed of the rotating magnetic field (power supply frequency).
In addition, high operating efficiency is one of the advantages of the synchronous motor.
l Why is electrical angle measurement necessary?
In the case of a synchronous motor, a phase shifting occurs between the stator magnetic pole and
the rotator magnetic pole due to a change in the load torque. This shifted angle and the torque
force that can be generated by a motor have a close relationship, so it is important to understand
this shifted angle (electrical angle) in order to achieve high-efficiency motor control.
l The 3390 provides a more accurate measurement method
The 3390 supports the incremental encoder output in addition to the measurement methods of the HIOKI
3194 Power HiTESTER – enabling you to measure this electrical angle more easily and accurately.
9
2 Analyze harmonic signals from the low-speed rotation range of motors
• Harmonic analysis from a synchronization frequency of 0.5 Hz
Accurate measurements can be performed in the low-speed rotation
range of motors without the need of an external clock.
If the synchronization frequency is 45 Hz or more, analysis results are
updated every 50 ms, so data analysis can be performed in real time.
Synchronization frequency range Window wave number
1
1
2
4
8
16
32
64
0.5Hz to 40Hz
40Hz to 80Hz
80Hz to 160Hz
160Hz to 320Hz
320Hz to 640Hz
640Hz to 1.2kHz
1.2kHz to 2.5kHz
2.5kHz to 5.0kHz
• Analyze up to the 100th order
Synchronized to the fundamental wave frequency of 0.5 Hz to 5 kHz
Simultaneously perform analysis up to the 100th order harmonic
along with power measurement
Analysis order
100th order
100th order
80th order
40th order
20th order
10th order
5th order
3rd order
3
Vector display of electrical angles of motors
5
X-Y graph display lets you check the dynamic characteristics of inverters
• Display vectors including that of the phase angle and electrical angle
( θ) of fundamental wave voltage and current. The measured data can
be used as parameters to calculate the Ld and Lq values.
4
Clearly view the inverter efficiency/loss and motor power
• Output, efficiency, and loss of inverter motors can be measured with
one single unit
Operating efficiency and power loss of the inverter and motor can be displayed
when the inputs and outputs of the inverter are measured simultaneously.
• X-Y graph display function built-in (X-axis: 1 item, Y-axis: 2 items)
By simply setting 2 items to the Y-axis as with a 6-axis graph used to evaluate motors,
you can display the characteristics of a motor and similar devices in real time.
■ Application 2: Electrical angle measurement using induced voltage of motors (The same measurements conducted with the HIOKI 3194 can also be performed)
Correct the rotation synchronization signal and induced voltage phase of motors as well as measure the phase of voltage and current for the induced voltage of a running motor as
an electrical angle.
Rotation synchronization
signal
Other Advance Functionsmotor
• Frequency divider circuit (up to 1/60000 frequency dividing) – helpful when the rotation synchronization
signal consists of multiple pulses for one cycle of induced voltage.
• Δ-to-Y conversation function - convert the line voltage to a phase voltage (virtual neutral reference) when
three-phase three-wire (3P3W3M connection) measurements are performed.
DC power
supply
Inverter
Motor
Torque
sensor
Load/
motor
Torque value
Induced voltage
Load/
motor
Tachometer signal
Motor
○ Measure the fundamental wave’s RMS value
and the total RMS value of the induced voltage.
○ Perform zero compensation for the phase
between the rotation synchronization signal and
the fundamental wave voltage of the induced
voltage.
Step 2: Measurement of a running motor
Rotation
synchronization signal
Step 1: Turn the motor from the load side, and measure the induced voltage of the motor
○ Measure the fundamental wave component, harmonic component, and electrical angle of line voltage
and current of a line to the motor. (The measured data can also be used as parameters for calculation of Lp/Lq)
○ Simultaneously measure motor efficiency, inverter efficiency, total efficiency, and inverter loss while
observing the motor control.
Download HIOKI 3390 ENG
HIOKI_3390_ENG.pdf (PDF, 5.12 MB)
Download PDF
Share this file on social networks
Link to this page
Permanent link
Use the permanent link to the download page to share your document on Facebook, Twitter, LinkedIn, or directly with a contact by e-Mail, Messenger, Whatsapp, Line..
Short link
Use the short link to share your document on Twitter or by text message (SMS)
HTML Code
Copy the following HTML code to share your document on a Website or Blog
QR Code to this page

This file has been shared publicly by a user of PDF Archive.
Document ID: 0000326496.