HIOKI MR8875 ENG (PDF)
File information
Title: MR8875E7-53E-01K
Author: HIOKI
This PDF 1.7 document has been generated by Adobe InDesign CS5.5_J (7.5.3) / Adobe PDF Library 9.9, and has been sent on pdf-archive.com on 25/12/2015 at 07:50, from IP address 5.18.x.x.
The current document download page has been viewed 980 times.
File size: 7.19 MB (16 pages).
Privacy: public file

File preview
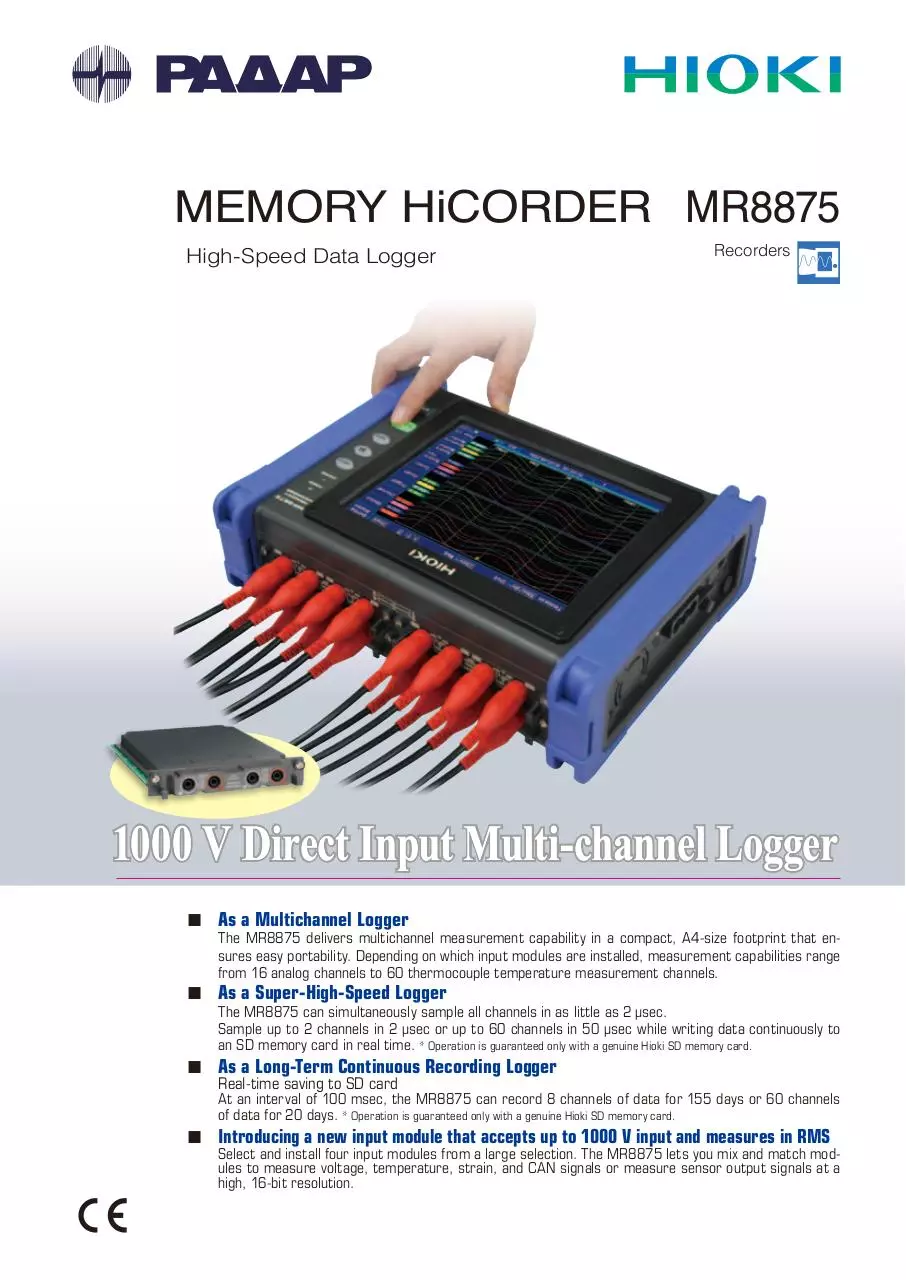
MEMORY HiCORDER MR8875
High-Speed Data Logger
Recorders
1000 V Direct Input Multi-channel Logger
n As a Multichannel Logger
The MR8875 delivers multichannel measurement capability in a compact, A4-size footprint that ensures easy portability. Depending on which input modules are installed, measurement capabilities range
from 16 analog channels to 60 thermocouple temperature measurement channels.
n As a Super-High-Speed Logger
The MR8875 can simultaneously sample all channels in as little as 2 μsec.
Sample up to 2 channels in 2 μsec or up to 60 channels in 50 μsec while writing data continuously to
an SD memory card in real time. * Operation is guaranteed only with a genuine Hioki SD memory card.
n As a Long-Term Continuous Recording Logger
Real-time saving to SD card
At an interval of 100 msec, the MR8875 can record 8 channels of data for 155 days or 60 channels
of data for 20 days. * Operation is guaranteed only with a genuine Hioki SD memory card.
n Introducing a new input module that accepts up to 1000 V input and measures in RMS
Select and install four input modules from a large selection. The MR8875 lets you mix and match modules to measure voltage, temperature, strain, and CAN signals or measure sensor output signals at a
high, 16-bit resolution.
2
User-selectable input modules for more applications!
A compact solution for multichannel measurement
Industrial Robots
Voltage
Temperature Control Signals
Temperature variations
on movable parts
Sensor outputs
Strain
Strain
The plug-in module-based architecture means
you can mix and record a variety of signals
across multiple channels - ideal for verifying
the operation of multi-axis robots.
Motor current
Example of module combinations
Control signal
(logic probe)
Analog Unit MR8901
Voltage/Temp Unit MR8902
Strain Unit MR8903
R&D or Science Experiments
Voltage
Temperature
×2
×1
×1
With its multichannel, long-term recording
capabilities, the MR8875 is ideally suited for
use in development applications such as performance and durability testing.
- Record sensor output.
- Evaluate sensors and other devices.
- Use as an X-Y recorder (flatbed).
Example of module combinations
Analog Unit MR8901
Voltage/Temp Unit MR8902
Development of Construction Machinery,
Agricultural Machinery, and Automobiles
Voltage
Temperature
Strain
×2
×2
Enhanced environmental temperature and vibration resistance enable the MR8875 to withstand
harsh measurement environments.
Example of module combinations
Analog Unit MR8901
Voltage/Temp Unit MR8902
Strain Unit MR8903
CAN Unit MR8904
×1
×1
×1
×1
3
Applications
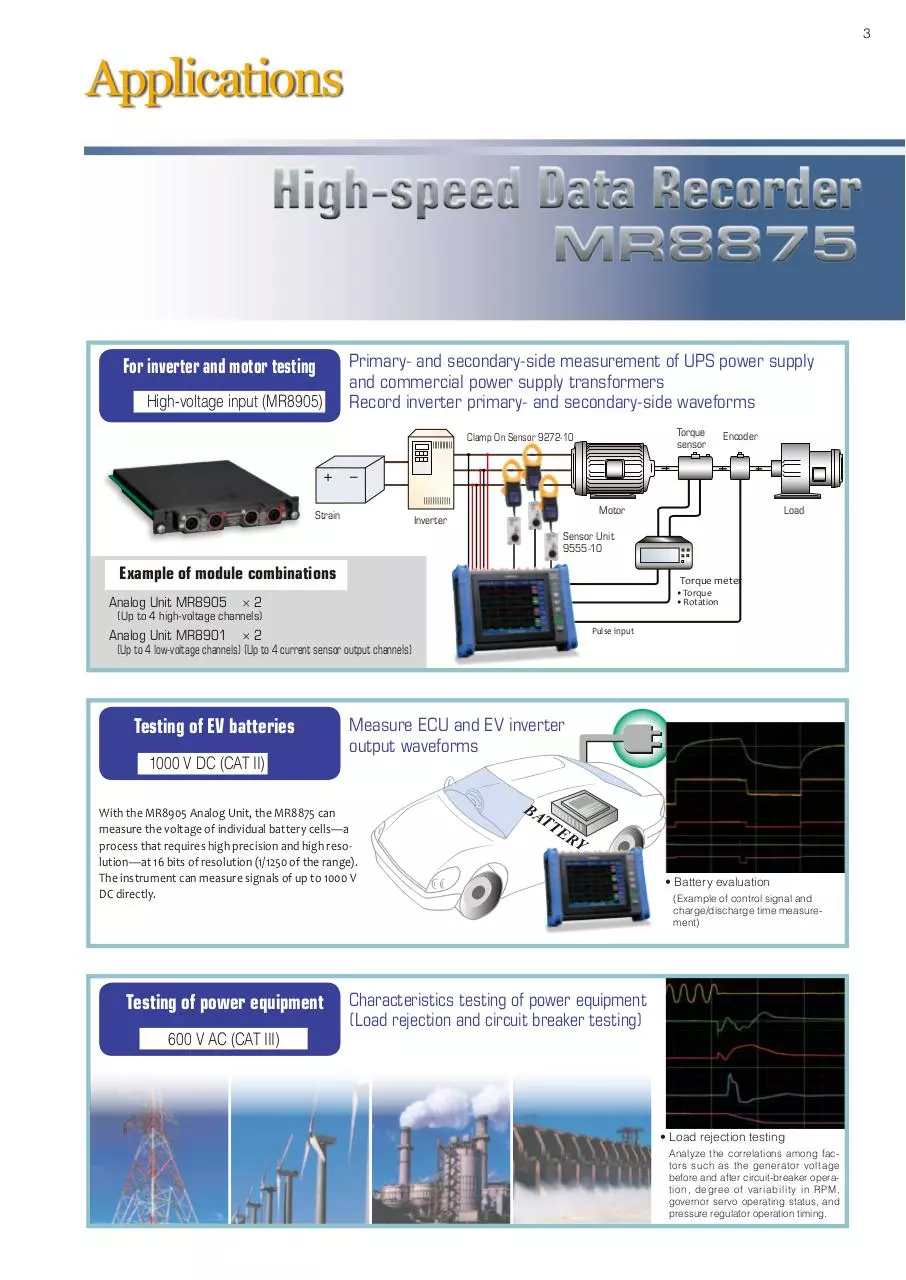
For inverter and motor testing
High-voltage input (MR8905)
Primary- and secondary-side measurement of UPS power supply
and commercial power supply transformers
Record inverter primary- and secondary-side waveforms
Torque
sensor
Clamp On Sensor 9272-10
Strain
Encoder
Motor
Inverter
Load
Sensor Unit
9555-10
Example of module combinations
Torque meter
•Torque
•Rotation
Analog Unit MR8905 × 2
(Up to 4 high-voltage channels)
Pulse input
Analog Unit MR8901 × 2
(Up to 4 low-voltage channels) (Up to 4 current sensor output channels)
Testing of EV batteries
1000 V DC (CAT II)
Measure ECU and EV inverter
output waveforms
With the MR8905 Analog Unit, the MR8875 can
measure the voltage of individual battery cells—a
process that requires high precision and high resolution—at 16 bits of resolution (1/1250 of the range).
The instrument can measure signals of up to 1000 V
DC directly.
Testing of power equipment
600 V AC (CAT III)
BA
TT
ER
Y
• Battery evaluation
(Example of control signal and
charge/discharge time measurement)
Characteristics testing of power equipment
(Load rejection and circuit breaker testing)
• Load rejection testing
Analyze the correlations among factors such as the generator voltage
before and after circuit-breaker operation, degree of variability in RPM,
governor servo operating status, and
pressure regulator operation timing.
4
Real-Time Saving
to SD Card in High Resolution
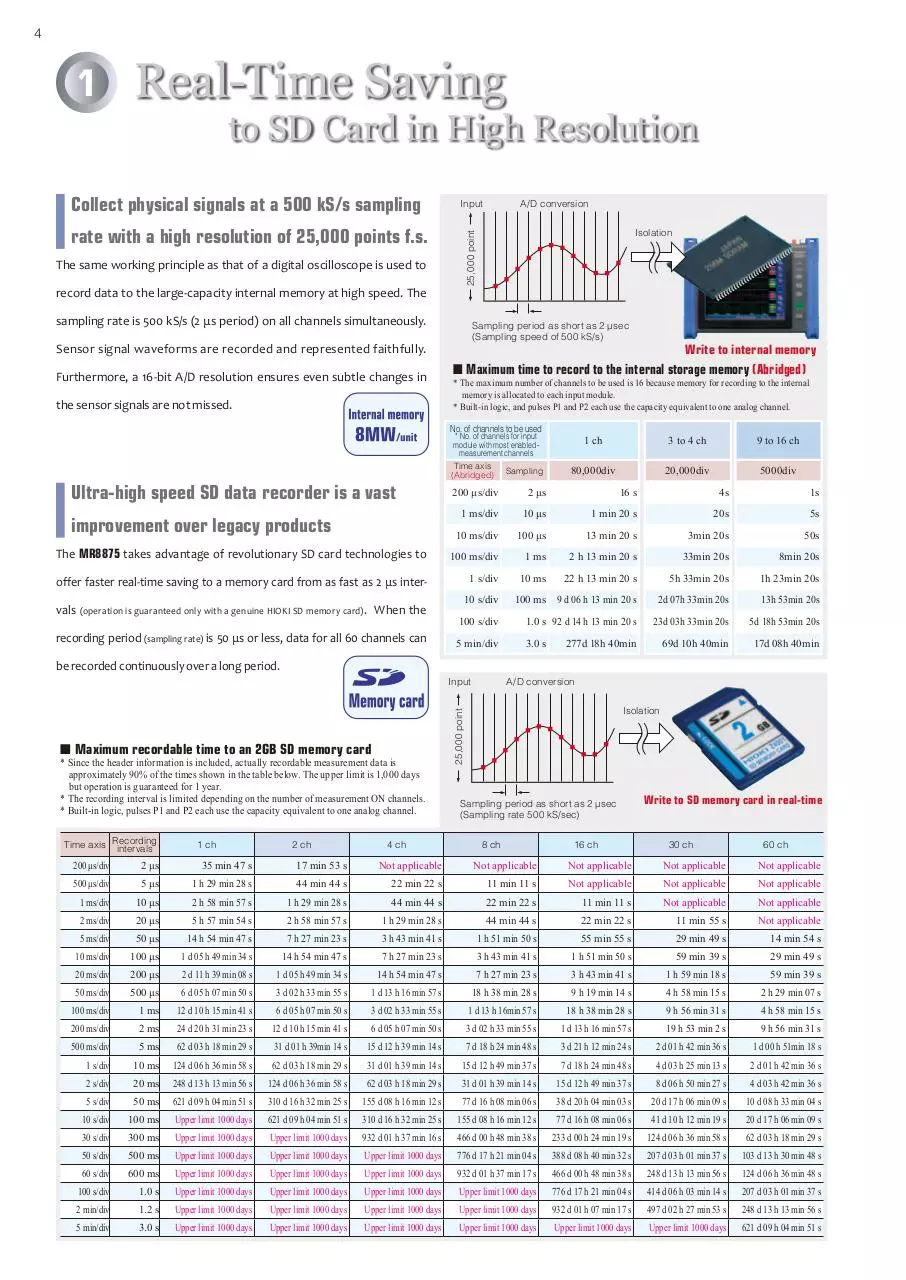
Collect physical signals at a 500 kS/s sampling
rate with a high resolution of 25,000 points f.s.
The same working principle as that of a digital oscilloscope is used to
record data to the large-capacity internal memory at high speed. The
Input
sampling rate is 500 kS/s (2 μs period) on all channels simultaneously.
the sensor signals are not missed.
Isolation
Sampling period as short as 2 μsec
(Sampling speed of 500 kS/s)
Sensor signal waveforms are recorded and represented faithfully.
Furthermore, a 16-bit A/D resolution ensures even subtle changes in
A/D conversion
25,000 point
1
* The maximum number of channels to be used is 16 because memory for recording to the internal
memory is allocated to each input module.
* Built-in logic, and pulses P1 and P2 each use the capacity equivalent to one analog channel.
No. of channels to be used
* No. of channels for input
module with most enabledmeasurement channels
Ultra-high speed SD data recorder is a vast
improvement over legacy products
Write to internal memory
n Maximum time to record to the internal storage memory (Abridged)
Time axis
(Abridged)
200 μs/div
Sampling
1 ch
3 to 4 ch
9 to 16 ch
80,000div
20,000div
5000div
2 μs
16 s
4s
1s
1 ms/div
10 μs
1 min 20 s
20s
5s
10 ms/div
100 μs
13 min 20 s
3min 20s
50s
The MR8875 takes advantage of revolutionary SD card technologies to
100 ms/div
1 ms
2 h 13 min 20 s
33min 20s
8min 20s
offer faster real-time saving to a memory card from as fast as 2 μs inter-
1 s/div
10 ms
22 h 13 min 20 s
5h 33min 20s
1h 23min 20s
vals (operation is guaranteed only with a genuine HIOKI SD memory card). When the
recording period (sampling rate) is 50 μs or less, data for all 60 channels can
10 s/div
100 ms 9 d 06 h 13 min 20 s
2d 07h 33min 20s
13h 53min 20s
100 s/div
1.0 s 92 d 14 h 13 min 20 s
23d 03h 33min 20s
5d 18h 53min 20s
5 min/div
3.0 s
69d 10h 40min
17d 08h 40min
277d 18h 40min
be recorded continuously over a long period.
Input
* Since the header information is included, actually recordable measurement data is
approximately 90% of the times shown in the table below. The upper limit is 1,000 days
but operation is guaranteed for 1 year.
* The recording interval is limited depending on the number of measurement ON channels.
* Built-in logic, pulses P1 and P2 each use the capacity equivalent to one analog channel.
Time axis Recording
intervals
200 μs/div
1 ch
2 μs
35 min 47 s
500 μs/div
5 μs
1 ms/div
10 μs
2 ms/div
2 ch
4 ch
17 min 53 s
Not applicable
1 h 29 min 28 s
44 min 44 s
2 h 58 min 57 s
1 h 29 min 28 s
20 μs
5 h 57 min 54 s
5 ms/div
50 μs
10 ms/div
Isolation
25,000 point
n Maximum recordable time to an 2GB SD memory card
A/D conversion
Sampling period as short as 2 μsec
(Sampling rate 500 kS/sec)
8 ch
16 ch
Write to SD memory card in real-time
30 ch
60 ch
Not applicable
Not applicable
Not applicable
Not applicable
22 min 22 s
11 min 11 s
Not applicable
Not applicable
Not applicable
44 min 44 s
22 min 22 s
11 min 11 s
Not applicable
Not applicable
2 h 58 min 57 s
1 h 29 min 28 s
44 min 44 s
22 min 22 s
11 min 55 s
Not applicable
14 h 54 min 47 s
7 h 27 min 23 s
3 h 43 min 41 s
1 h 51 min 50 s
55 min 55 s
29 min 49 s
14 min 54 s
100 μs
1 d 05 h 49 min 34 s
14 h 54 min 47 s
7 h 27 min 23 s
3 h 43 min 41 s
1 h 51 min 50 s
59 min 39 s
29 min 49 s
20 ms/div
200 μs
2 d 11 h 39 min 08 s
1 d 05 h 49 min 34 s
14 h 54 min 47 s
7 h 27 min 23 s
3 h 43 min 41 s
1 h 59 min 18 s
59 min 39 s
50 ms/div
500 μs
6 d 05 h 07 min 50 s
3 d 02 h 33 min 55 s
1 d 13 h 16 min 57 s
18 h 38 min 28 s
9 h 19 min 14 s
4 h 58 min 15 s
2 h 29 min 07 s
100 ms/div
1 ms
12 d 10 h 15 min 41 s
6 d 05 h 07 min 50 s
3 d 02 h 33 min 55 s
1 d 13 h 16min 57 s
18 h 38 min 28 s
9 h 56 min 31 s
4 h 58 min 15 s
200 ms/div
2 ms
24 d 20 h 31 min 23 s
12 d 10 h 15 min 41 s
6 d 05 h 07 min 50 s
3 d 02 h 33 min 55 s
1 d 13 h 16 min 57 s
19 h 53 min 2 s
9 h 56 min 31 s
500 ms/div
5 ms
62 d 03 h 18 min 29 s
31 d 01 h 39min 14 s
15 d 12 h 39 min 14 s
7 d 18 h 24 min 48 s
3 d 21 h 12 min 24 s
2 d 01 h 42 min 36 s
1 d 00 h 51min 18 s
1 s/div
10 ms
124 d 06 h 36 min 58 s
62 d 03 h 18 min 29 s
31 d 01 h 39 min 14 s
15 d 12 h 49 min 37 s
7 d 18 h 24 min 48 s
4 d 03 h 25 min 13 s
2 d 01 h 42 min 36 s
2 s/div
20 ms
248 d 13 h 13 min 56 s
124 d 06 h 36 min 58 s
62 d 03 h 18 min 29 s
31 d 01 h 39 min 14 s
15 d 12 h 49 min 37 s
8 d 06 h 50 min 27 s
4 d 03 h 42 min 36 s
5 s/div
50 ms
621 d 09 h 04 min 51 s
310 d 16 h 32 min 25 s
155 d 08 h 16 min 12 s
77 d 16 h 08 min 06 s
38 d 20 h 04 min 03 s
20 d 17 h 06 min 09 s
10 d 08 h 33 min 04 s
20 d 17 h 06 min 09 s
10 s/div
100 ms
Upper limit 1000 days
621 d 09 h 04 min 51 s
310 d 16 h 32 min 25 s
155 d 08 h 16 min 12 s
77 d 16 h 08 min 06 s
41 d 10 h 12 min 19 s
30 s/div
300 ms
Upper limit 1000 days
Upper limit 1000 days
932 d 01 h 37 min 16 s
466 d 00 h 48 min 38 s
233 d 00 h 24 min 19 s
124 d 06 h 36 min 58 s
62 d 03 h 18 min 29 s
50 s/div
500 ms
Upper limit 1000 days
Upper limit 1000 days
Upper limit 1000 days
776 d 17 h 21 min 04 s
388 d 08 h 40 min 32 s
207 d 03 h 01 min 37 s
103 d 13 h 30 min 48 s
60 s/div
600 ms
Upper limit 1000 days
Upper limit 1000 days
Upper limit 1000 days
932 d 01 h 37 min 17 s
466 d 00 h 48 min 38 s
248 d 13 h 13 min 56 s
124 d 06 h 36 min 48 s
100 s/div
1.0 s
Upper limit 1000 days
Upper limit 1000 days
Upper limit 1000 days
Upper limit 1000 days
776 d 17 h 21 min 04 s
414 d 06 h 03 min 14 s
207 d 03 h 01 min 37 s
2 min/div
1.2 s
Upper limit 1000 days
Upper limit 1000 days
Upper limit 1000 days
Upper limit 1000 days
932 d 01 h 07 min 17 s
497 d 02 h 27 min 53 s
248 d 13 h 13 min 56 s
5 min/div
3.0 s
Upper limit 1000 days
Upper limit 1000 days
Upper limit 1000 days
Upper limit 1000 days
Upper limit 1000 days
Upper limit 1000 days
621 d 09 h 04 min 51 s
5
Multichannel
2
Mixed Measurement of Various Signals
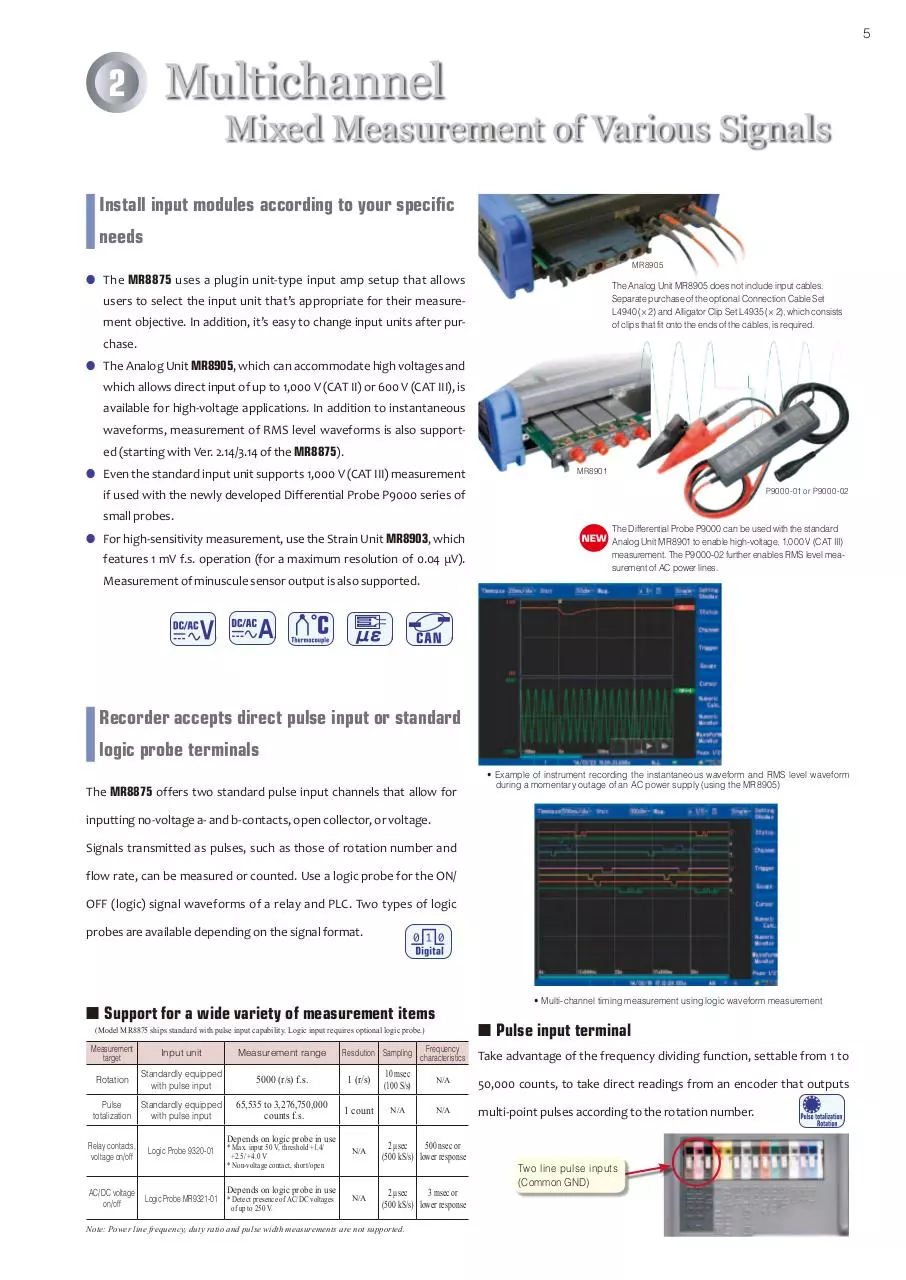
Install input modules according to your specific
needs
MR8905
● The MR8875 uses a plugin unit-type input amp setup that allows
The Analog Unit MR8905 does not include input cables.
Separate purchase of the optional Connection Cable Set
L4940 (× 2) and Alligator Clip Set L4935 (× 2), which consists
of clips that fit onto the ends of the cables, is required.
users to select the input unit that’s appropriate for their measurement objective. In addition, it’s easy to change input units after purchase.
● The Analog Unit MR8905, which can accommodate high voltages and
which allows direct input of up to 1,000 V (CAT II) or 600 V (CAT III), is
available for high-voltage applications. In addition to instantaneous
waveforms, measurement of RMS level waveforms is also supported (starting with Ver. 2.14/3.14 of the MR8875).
● Even the standard input unit supports 1,000 V (CAT III) measurement
MR8901
P9000-01 or P9000-02
if used with the newly developed Differential Probe P9000 series of
small probes.
● For high-sensitivity measurement, use the Strain Unit MR8903, which
features 1 mV f.s. operation (for a maximum resolution of 0.04 μV).
Measurement of minuscule sensor output is also supported.
The Differential Probe P9000 can be used with the standard
Analog Unit MR8901 to enable high-voltage, 1,000 V (CAT III)
measurement. The P9000-02 further enables RMS level measurement of AC power lines.
Recorder accepts direct pulse input or standard
logic probe terminals
The MR8875 offers two standard pulse input channels that allow for
• Example of instrument recording the instantaneous waveform and RMS level waveform
during a momentary outage of an AC power supply (using the MR8905)
inputting no-voltage a- and b-contacts, open collector, or voltage.
Signals transmitted as pulses, such as those of rotation number and
flow rate, can be measured or counted. Use a logic probe for the ON/
OFF (logic) signal waveforms of a relay and PLC. Two types of logic
probes are available depending on the signal format.
• Multi-channel timing measurement using logic waveform measurement
n Support for a wide variety of measurement items
n Pulse input terminal
(Model MR8875 ships standard with pulse input capability. Logic input requires optional logic probe.)
Measurement
target
Input unit
Rotation
Standardly equipped
with pulse input
Standardly equipped
Pulse
totalization
with pulse input
Relay contacts,
voltage on/off
AC/DC voltage
on/off
Logic Probe 9320-01
Measurement range
Resolution Sampling
5000 (r/s) f.s.
1 (r/s)
10 msec
(100 S/s)
65,535 to 3,276,750,000
counts f.s.
1 count
N/A
Depends on logic probe in use
* Max. input 50 V, threshold +1.4/
+2.5/ +4.0 V
* Non-voltage contact, short/open
Depends on logic probe in use
Logic Probe MR9321-01 * Detect presence of AC/DC voltages
of up to 250 V.
N/A
N/A
Frequency
characteristics
Take advantage of the frequency dividing function, settable from 1 to
N/A
50,000 counts, to take direct readings from an encoder that outputs
N/A
multi-point pulses according to the rotation number.
2 μsec
500 nsec or
(500 kS/s) lower response
2 μsec
3 msec or
(500 kS/s) lower response
Note: Power line frequency, duty ratio and pulse width measurements are not supported.
Two line pulse inputs
(Common GND)
6
3
Touch Screen
for Intuitive Operation
Touch screen interface improves operating
efficiency
Buttons on the MR8875 are kept to a minimum by utilizing touch
screen technology. The high-definition 8.4-inch high-brightness TFT
color LCD is the interface of choice for improving productivity by
offering a more intuitive experience than traditional input methods.
While the connection terminals are located at the top panel of the
MR8875, when cables need to be connected from the bottom, simply
swipe the screen from top to bottom at either edge and the screen
will rotate correspondingly. The MR8875 can be set in a position that is
easier to use according to the installation location.
Touch to scroll back or scale the waveform
Display earlier waveforms during recording without stopping measurement by simply touching the scroll icons on the screen. You can also scale
the waveform amplitude by just swiping through the waveform up (to
zoom in) or down (to zoom out).
Advanced cursor read function for multichannel
analysis
Six cursors A, B, C, D, E, and F are available, compared with the
conventional A- and B-cursors.
Use the cursors to measure and display the following:
• A, B, C, and D: Potential and time from the trigger
• E and F: Potential
• A-B and C-D cursors: Time difference and potential difference
• E-F cursors: Potential
Split screen, sheet display, event mark input, and
jump functions indispensable for efficient analysis
Split screen and sheet display functions are provided to support
multiple channels. Individual display formats can be selected and
an application can be assigned to each sheet for analysis, increasing
productivity.
H For long-term recordings, tag important points with event markers. Up to 1000 markers can be placed so that you can quickly jump
to them later for detailed analysis.
7
4
Computer Analysis
via LAN, SD, and USB memory interfaces
LAN-compatible Web/FTP server function and waveform/
CSV conversion using supplied standard software Wv
Take advantage of the built-in 100BASE-TX LAN interface to network
with the PC:
<WEB server> Use the Web Server function to view waveforms and
remotely control the MR8875 with your PC’s web browser
<FTP server> Use the FTP server function to copy the data stored in
memory (SD card, USB memory, or internal storage memory) to the PC. View
waveforms for binary data acquired with the MR8875 on a PC, or convert data to CSV using the free WaveViewer (Wv) application for further analysis in Excel. Download the latest version of the WaveViewer
from the HIOKI website at www.hioki.com.
Wv screen sample
Excel spreadsheet sample
n Remotely control the MR8875 using the Web server function
n Download data using FTP
Use a typical web browser to see the screen of the MR8875 on your
Measurement data in files on recording media and in
PC with no other special software
the internal memory can be acquired from a PC.
required. Make settings, acquire
data, and monitor the screen with
Note: Waveform data cannot be acquired from the
internal memory during measurement.
ease.
Note: Waveform data cannot be acquired
from the internal memory during measurement.
n Transfer data using FTP
After measurement is finished, data is transferred auto-
n Attach data to E-mail
After measurement is finished, you can automatically
matically to the FTP server that is running on the PC. Data
send the captured data as an e-mail attachment. Data
can also be transferred manually.
can also be transferred manually.
Save data to the USB memory or SD card
Convenient USB memory*1 or SD memory cards can be used to copy
data stored in the internal storage memory to the PC. Data stored in
the MR8875’s SD card can also be downloaded to the PC using a USB
cable.*2
*1 Data can be saved to USB memory. However, it is recommended to use
a genuine Hioki SD card for which operation is guaranteed to ensure data
protection.
*2 Direct download from USB memory to a PC via a USB cable is not
supported - please use a LAN connection and the FTP server.
8
5
Powerful Data Analysis Capabilities
FFT Analysis Function
MR8875 Ver. 2.01 or later
Simultaneously measure four phenomena
The MR8875's FFT analysis function can simultaneously analyze
four phenomena with a single measurement.
By performing FFT analysis of different signal inputs from channels 1 through 4, it is possible to analyze the frequency components of each channel occurring at the same time.
Additionally, you can simultaneously view the linear spectrum,
RMS spectrum, power spectrum, and phase spectrum for a signal
input to channel 1, for example.
Analysis functionality for a variety of
measurement scenarios
The MR8875 features calculation functions that are often used
during field measurements. The linear spectrum is used in analysis that focuses on waveform amplitude values, while the power
spectrum is used in analysis that focuses on energy, for example
noise and vibration measurement. You can select the calculation
function that best suits your application— for example, use a
transfer function for measurement that identifies internal systems based on I/O characteristics.
Peak value display function (marker display)
The peak value display function can be used to search for maximum and local maximum values and then display them. Characteristic values can be easily displayed even without using a cursor.
Since the MR8875 stores up to 200 frames (200 calculation results)
of data, it will automatically search for the peak value again if a
different frame is selected.
Running spectrum display function
The MR8875's running spectrum display function can be used to
continuously display spectra that change over time. Up to 200
frames* of the most recent calculation results can be stored.
Although Hioki's MR8847 Series only supports running spectrum
display for certain types of calculations, the MR8875 can generate
this display with all FFT calculation functions. Additionally, if the
selected frame is changed, the cursor value can also be loaded.
* Frame data is stored in the instrument's internal memory, regardless of whether the running spectrum display is used.
The MR8875 can also freeze the spectrum display on its screen
during measurement. This function allows data to be observed
without the inclusion of unneeded information on the screen or in
the data. All calculation results can be output as CSV data, which
can be loaded into a spreadsheet application such as Microsoft
Excel and used to create a three-dimensional graph.
Example of data displayed with Microsoft Excel
9
Extensive window functions
The MR8875 provides a total of seven window functions, including rectangular and Hanning variants. The rectangular function is used for
analysis that focuses on spectrum amplitude values, while the Hanning function is used for analysis that focuses on the degree of spectral
separation of frequency components. Additionally, by using an exponential window in impact measurement utilizing an impulse hammer, the
instrument enables more precise analysis by limiting unneeded noise components on the time axis.
Continuous calculation function
Number of skips
When analyzing a signal that changes over time, the number of
FFT calculation points becomes a limitation, preventing the waveform from being analyzed in all time domains. Furthermore, us-
Time waveform
ing too many FFT points prevents the desired results from being
obtained because the spectrum is averaged. The MR8875 resolves
these problems with its continuous calculation function. For data
covering extended periods of time, calculation points can be
shifted by a number of skip points* at a uniform interval. More-
FFT calculation
results
Frame 2
Frame 200
Frame 1
Illustration of continuous calculation
over, calculations for up to 200 frames can be accomplished with
a single operation. Calculation results for different time periods
can be reviewed by changing the calculation frame, regardless of
whether you're using the running spectrum display or a singlescreen display.
* The number of skip points can be set from 100 to 10,000.
Overlay display function
The MR8875's overlay display function can be used to observe
variations in waveforms captured using continuous measurement
over time. Although previous Hioki models have not been able
to overlay FFT calculations, the MR8875 offers this capability, improving the visibility of analysis.
Visually appealing screen displays
The MR8875's display can be switched according to the applica-
Single-screen display
tion at hand. For example, its single-screen display can be used
when focusing on the correlation between channels, while its
four-screen display can be used to isolate complex spectra for
viewing. Additionally, time and spectrum waveforms can be displayed above and below one another when focusing on correlation with a captured time waveform.
Simultaneous display of a time-axis waveform
and FFT calculation results
Download HIOKI MR8875 ENG
HIOKI_MR8875_ENG.pdf (PDF, 7.19 MB)
Download PDF
Share this file on social networks
Link to this page
Permanent link
Use the permanent link to the download page to share your document on Facebook, Twitter, LinkedIn, or directly with a contact by e-Mail, Messenger, Whatsapp, Line..
Short link
Use the short link to share your document on Twitter or by text message (SMS)
HTML Code
Copy the following HTML code to share your document on a Website or Blog
QR Code to this page

This file has been shared publicly by a user of PDF Archive.
Document ID: 0000326699.