HIOKI PW3365 ENG (PDF)
File information
Title: CLAMP ON POWER LOGGER PW3365
Author: HIOKI
This PDF 1.7 document has been generated by Adobe InDesign CS5.5_J (7.5.3) / Adobe PDF Library 9.9, and has been sent on pdf-archive.com on 25/12/2015 at 07:51, from IP address 5.18.x.x.
The current document download page has been viewed 811 times.
File size: 4.85 MB (12 pages).
Privacy: public file


File preview
CLAMP ON POWER LOGGER PW3365
Power Measuring Instruments
Eliminate the risk of
short-circuits and electrical accidents
The world’s first instrument to offer
no-metal-contact power measurement
Free from the risk of short-circuit accidents since no
metal comes into contact with energized parts, the
Clamp On Power Logger PW3365-20 can measure
voltage, current, and power right on the cable, letting
you safely test in locations that were dangerous or
even impossible in the past.
2
Safe, Easy,
Voltage Measurement
The PW3365-20’s dedicated voltage sensor
delivers the world’s first no-metal-contact measurement.
Free yourself from the risk of short-circuits by measuring right on the cable sheath without
ever needing to touch metal to energized parts
Measure both thick and thin cables
Freely clip either
horizontally or vertically
Measure in potentially hazardous locations
Locations without
energized parts
Locations with
covered terminals
Measure on the
outside of cables
Measure without
removing the covers
Locations with a risk
of electric shock
Measure at safer points
How is voltage measured without any metallic contact?
Voltage generator
Schematic diagram
Principles of operation
Voltage Sensor
PW9020
Micro current = 0
100V
Measured voltage
Wire cross-section
Electrode
Voltages
balance
Voltage generator
Internal image
Electrode
100V
Generated voltage
PW3365-20
Inside the PW9020 is an electrode (a metal plate). When there is a potential difference between this electrode and the
measured line, a minute current flows as a result. By detecting this minute current and generating a voltage such that
the current declines to zero, it is possible to accurately measure the voltage without being affected by the outer diameter
of the measured cable or its insulation.
3
Enlarged view of clamp
Actual maximum size : φ30mm
Actual minimum size : φ6mm
Compatible conductor diameters
SAFETY VOLTAGE SENSOR PW9020 Specifications
Compatible conductor types
Insulated wires* 1 In door PVC or metal parts
Compatible conductor
diameters
Finished outer diameter φ6mm to φ30mm
Effective measurement range
90 V to 520 V
Accuracy
±1.5% rdg. ±0.2% f.s. (combined accuracy with PW3365-20)* 2
Effect of phase
Accuracy combined with the PW3365-20 is within ±1.3% (at 50/60Hz, f.s. input)
Maximum rated
voltage to earth
CATIV 300V / CATIII 600V
Cord length
3m (9.84 ft)
Mass
Approx. 220g (7.8 oz)
Operating temperature
and humidity
0°C to 50°C(32°F to122°F),
80% RH or less (no condensation)
Storage temperature
and humidity
-10°C to 60°C (14°F to 122°F),
80% RH or less (no condensation)
Dielectric strength
7.06k Vrms AC
Applicable standards
Safety: EN61010, EMC: EN61326
*
includes relay box on cord
!
Soil, residue, or moisture on the insulated wires
may result in lower voltage and power values
than their true values. Use a dry cloth to remove
before measuring.
*1: Shielded wires cannot be measured.
*2: For frequencies of 45 Hz to 66 Hz.
Effects of humidity: Add the following to the combined accuracy
(for voltage, power, and phase) with the PW3365-20
Accuracy within ±1% f.s., phase within ±1°,
measuring an insulated wire at a humidity of 70% to 80% RH
Effects of adjacent wires: Add the following to the combined accuracy
(for voltage and power) with the PW3365-20
Within ±1% f.s. while a wire with a phase
difference of 400 V is in contact with the grip
4
Configure
Settings with
Quick
Set
Graphical, easy-to-understand
guidance for connection procedures
Quick Setup guides you through the process of setting up the instrument for measurement, right up to starting
measurement, on the screen to simplify set work. Since any mistaken connections will trigger a FAIL message,
the feature also helps prevent measurement mistakes. If you receive a FAIL result, the instrument will also
indicate the location of the problem.
Setup Flow (example: 3P4W)
Miswiring Example (Clamp Orientation)
Neither power nor power Correct Orientation
the
factor can be measured Point
arrow
the
accurately with the clamp toward
load side
in the wrong orientation.
Power supply side
STEP1
Quick Set START / Choose the wire type
STEP2
Connect the leads to the PW3365-20
STEP3
Connect the voltage sensor
STEP4
Connect the clamp sensors
STEP5
Select the current range
STEP6
Check wire connection status
Load side
FAIL
The I vector’s phase direction is
opposite the determination area.
PASS
The I vector’s phase direction is
within the determination area.
If you receive a FAIL result
Highlight the FAIL message with the cursor and press ENTER to view
information about where the connection needs to be corrected.
P: 6.2kW
Power displayed value is too low
Red means : FAIL
P: 17.8kW
Green means : PASS
Measurement
5
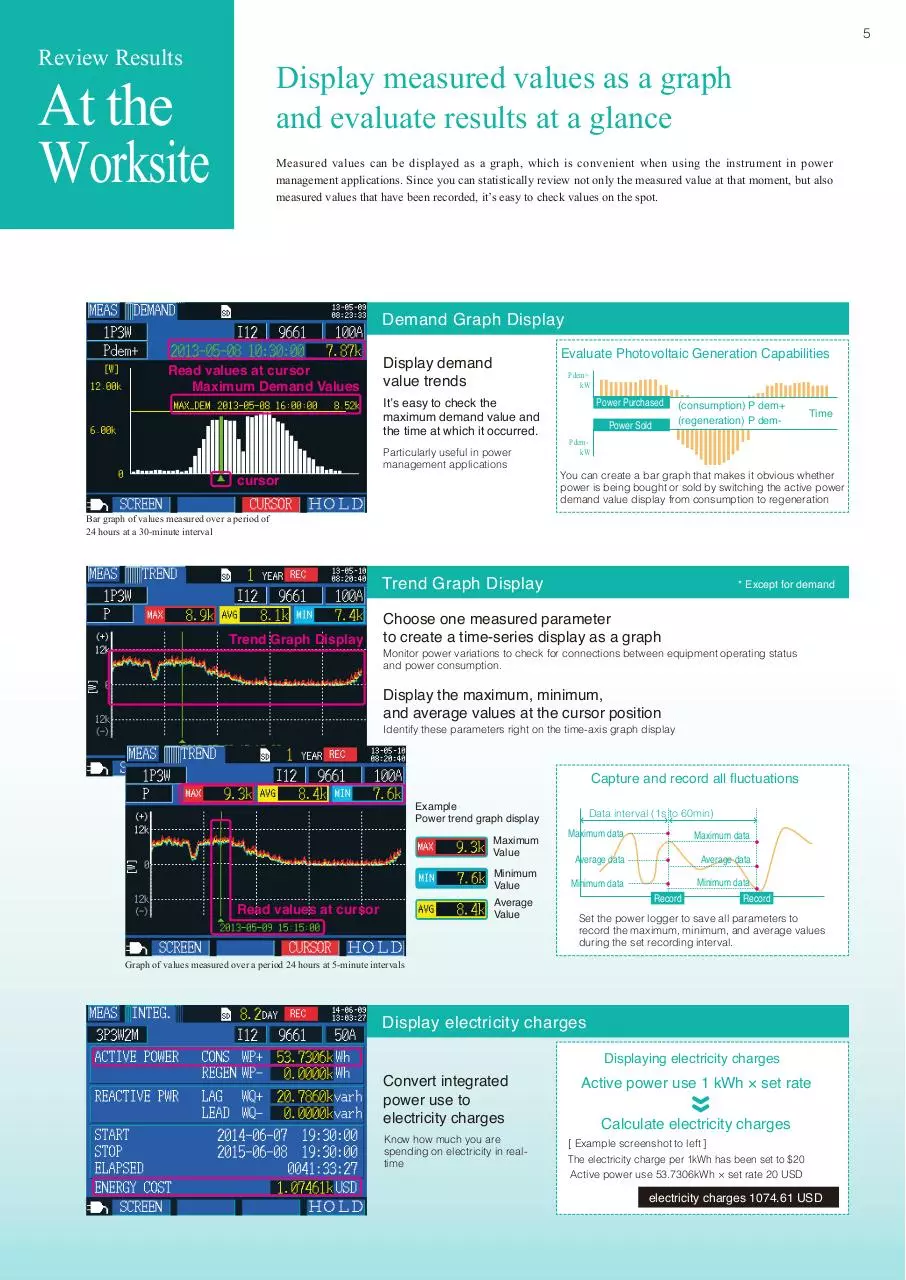
Review Results
Display measured values as a graph
and evaluate results at a glance
At the
Worksite
Measured values can be displayed as a graph, which is convenient when using the instrument in power
management applications. Since you can statistically review not only the measured value at that moment, but also
measured values that have been recorded, it’s easy to check values on the spot.
Demand Graph Display
Read values at cursor
Maximum Demand Values
cursor
Evaluate Photovoltaic Generation Capabilities
Display demand
value trends
P dem+
kW
It’s easy to check the
maximum demand value and
the time at which it occurred.
Particularly useful in power
management applications
Power Purchased
Power Sold
(consumption) P dem+
(regeneration) P dem-
Time
P demkW
You can create a bar graph that makes it obvious whether
power is being bought or sold by switching the active power
demand value display from consumption to regeneration
Bar graph of values measured over a period of
24 hours at a 30-minute interval
Trend Graph Display
Trend Graph Display
* Except for demand
Choose one measured parameter
to create a time-series display as a graph
Monitor power variations to check for connections between equipment operating status
and power consumption.
Display the maximum, minimum,
and average values at the cursor position
Identify these parameters right on the time-axis graph display
Capture and record all fluctuations
Example
Power trend graph display
Maximum
Value
Minimum
Value
Average
Value
Read values at cursor
Data interval (1s to 60min)
Maximum data
Maximum data
Average data
Average data
Minimum data
Record
Minimum data
Record
Set the power logger to save all parameters to
record the maximum, minimum, and average values
during the set recording interval.
Graph of values measured over a period 24 hours at 5-minute intervals
Display electricity charges
Convert integrated
power use to
electricity charges
Know how much you are
spending on electricity in realtime
Displaying electricity charges
Active power use 1 kWh × set rate
Calculate electricity charges
[ Example screenshot to left ]
The electricity charge per 1kWh has been set to $20
Active power use 53.7306kWh × set rate 20 USD
electricity charges 1074.61 USD
6
Save &Analyze
Results
on a PC
Easily download and interpret data on a PC
Download the measurement results to a computer via the power logger's LAN or USB interface or
its SD card. Once data has been downloaded, it can be graphed easily with free software. For more
detailed analysis, Hioki’s optional SF1001 application software is recommended.
Storage media for data
SD card
Available Recording Time
2GB
Stores up to one year’s data
that is acquired at one minute
intervals. Performance cannot
be guaranteed on storage media
other than SD cards sold by Hioki.
Loading data
The SD port has a cover
Measurement Interval
Save Time
Measurement Interval
Save Time
1 seconds
15.6 days
30 seconds
1 year
2 seconds
31.2 days
1 minutes
1 year
5 seconds
77.9 days
2 minutes
1 year
10 seconds
155 days
5 minutes
1 year
15 seconds
233 days
More than 10 minites
1 year
[ Save conditions for above figures ]
Measurement target : 3P4W
Storage media
: Z4001 2-GB SD card
Saved parameters
: All data: average, maximum, and minimum values
Screen copy saving : OFF
Waveform save : OFF
SD card 2GB
LAN interface
In all cases, the maximum single file size for measurement data is about 200 MB.
When this is exceeded, a new file is created and saving continues.
USB interface
Use the free software from the Hioki website
in order to download data to a computer using the instrument’s LAN or USB interface
Freeware (free download from the Hioki website)
Convenient Functions
Automatically Create Excel Graphs
Load saved data directly from the
instrument (via a USB/LAN connection)
Graph saved data in Excel
Transfer settings from a computer
to the PW3365-20
Print data
Power Logger Viewer SF1001 (option, sold separately/for PW3365,PW3360,PW3198)
Display, tabulate, analyze, and print saved data
Example of a Stacked Graph Display
You can combine power consumption data measured at multiple locations
into a single graph to capture the total power demand across a facility,
allowing you to identify time periods and locations characterized by high
power consumption at a glance.
Trend graph display
A
Waveform display
Report printing
B
Power
Source
C
Power
Source
Copy
Power
Source
Summary display
C
B
A
7
Convenient Functions
For the
Worksite
More Uses for the PW3365-20
The Hioki PW3365-20 is not just a power logger. Added-value features and functions let you meet
many other electrical testing applications.
Leakage Current Measurement
Requires optional clamp-on leak sensor
Measure power + 1-channel of leakage current
Measure 3 channels of
leakage current
Leakage current results
Example : 3P3W2M+1-channel leakage current
Load
Load
Measure
leakage current
Load
Power Source
Load
Power Source
Measure
power
By capturing the RMS of the fundamental wave, you
can also identify the leakage current of the 50/60Hz
component.
With the ability to calculate and process data every 200ms, you
can do simple checks of intermittent leakage current. Choose from
average, maximum and/or minimum value of the measured interval.
RMS (A)
RMS that includes harmonic components
PEAK (A)
Peak value (waveform peak)
FND (A)
RMS of fundamental wave
Control and monitor from a remote location
Use a LAN cable to connect the PW3365-20 to a personal computer for real-time remote monitoring
and measurement display on a web browser.
Files recorded in the Clamp On Power Logger's internal memory or SD card are accessible via a LAN or USB connection,
and are downloadable using the free PW3365-20 Setup and Download Software
LAN
Enter the IP address
in the browser.
Load
Load
Power Source
Power Source
LAN
LAN
HUB
Display the power logger's screen and make
adjustments virtually by clicking the buttons and entering new information.
Simultaneous Measurements
Other convenient features
Measure three single-phase, 2-wire circuits in the same system
at the same time.
Load
Load
Power Source
Compact, lightweight
Load
Small form factor lets you
set the power logger even
inside cramped cubicles
Key lock function
Lock the buttons to prevent
erroneous operation
Battery power
Power the instrument for
about five hours with batteries
if the power goes out
Display hold
Freeze the displayed
value for easier reading
Outage recovery
Resume recording
automatically following
recovery from a power
outage
8
PW3365-20 Specifications
No dirt or moisture on insulated wire or voltage sensor
Product guaranteed for one year
Measurement
Number of input channels
Voltage: 3 channels / Current: 3 channels
Measurement targets
(50/60Hz)
Single-phase 2-wire (1P2W, 1P2W 5 2 circuits, 1P2W 5 3 circuits)
Single-phase 3-wire (1P3W, 1P3W+I, 1P3W1U, 1P3W1U+I)
Three-phase 3-wire (3P3W2M, 3P3W2M+I, 3P3W3M/Y-wiring only)
Three-phase 4-wire (3P4W), Current only: 1 to 3 channels
Simultaneous
power/current
measurement modes
1P3W+I
: 1 power circuit and 1 current channel
3P3W2M+I : 1 power circuit and 1 current channel
Measurement
items
Voltage
RMS value, fundamental wave value, waveform peak (absolute value), fundamental wave phase angle, frequency (U1)
Current
RMS value, fundamental wave value, waveform peak (absolute value), fundamental wave phase angle
Power
Active power, reactive power, apparent power, power factor, (with lag/lead display) or displacement power factor (with lag/lead display),
active energy (consumption, regeneration, regeneration), reactive energy(lag, lead)
Energy cost display (per-kWh price × power consumption)
Demand
Active power demand value (consumption, regeneration),
reactive power demand value (lag, lead),
active power demand quantity (consumption, regeneration), reactive power demand quantity (lag, lead),
power factor demand value
400 V AC
Voltage range
Total display area: 5V to 520 V (less than 5 V displays as 0 V)
Effective measurement range: 90 V to 520 V, peak: ±750V [OVER] indicates over-range warning
Load
current
Current ranges
Leakage
current
CLAMP ON SENSOR 9660
: 5/10/50/100 A
CLAMP ON SENSOR 9661
: 5/10/50/100/500 A
CLAMP ON SENSOR 9669
: 100/200/1k A
CLAMP ON SENSOR 9694
: 500m/1/5/10/50 A
CLAMP ON SENSOR 9695-02
: 500m/1/5/10/50 A
CLAMP ON SENSOR 9695-03
: 5/10/50/100 A
AC FLEXIBLE CURRENT SENSOR CT9667-01, -02, -03
: 50/100/500 A (500A range)
AC FLEXIBLE CURRENT SENSOR CT9667-01, -02, -03
: 500/1k/5k A (5000A range)
LEAK CLAMP ON SENSOR 9675
: 50m/100m/500m/1/5 A
LEAK CLAMP ON SENSOR 9657-10
: 50m/100m/500m/1/5 A
Total display range: Within 0.4 to 130% of the range (zero is suppressed for less than 0.4%)
Effective measurement range: Within 5 to 110% of the range [OVER] indicates over-range warning
200.00 W to 6.0000 MW
Depends on voltage/current combination and measured line type (see Measurement Range Configuration Tables)
Power ranges
Total display range: Within 0 to 130% of the range (“0W” display indicates zero rms voltage and/or current)
Effective measurement area: Within 5 to 130% of the range
*1
Measurement accuracy
(50/60Hz)
Voltage : ±1.5% rdg. ±0.2% f.s. (combined accuracy with PW3365-20 + PW9020)
Current : ±0.3% rdg. ±0.1% f.s. + clamp sensor accuracy
Active power : ±2.0% rdg. ±0.3% f.s. + clamp sensor accuracy (power factor = 1)
Calculations
RMS calculation/ fundamental wave calculation
VT ratio settings
Any
0.01 to 9999.99
Selections 1/60/100/200/300/600/700/1000/2000/2500/5000
CT ratio settings
Any
0.01 to 9999.99
Selections 1/40/60/80/120/160/200/240/300/400/600/800/1200
Input methods
Voltage: Isolated inputs using Voltage Sensor PW9020
Display update rate
Approx. 0.5 sec (except when accessing SD card or internal memory, or during LAN/USB communication)
Measurement method
Digital sampling and zero cross synchronization calculation method
Sampling: 10.24 kHz (2048 points)
Calculation processing
50 Hz: Continuous, gapless measurement at 10 cycles
60 Hz: Continuous, gapless measurement at 12 cycles
A/D converter resolution
16bit
Current: Isolated input using a clamp-on sensor
For individual clamp sensors’ accuracy and combined accuracy figures, see pages 10 and 11.
9
Screen display
List
Voltage, current, frequency, active/apparent/reactive power
power factor, integrated power use, elapsed time
Product guarantee
U/I
RMS value, fundamental wave value,
waveform peak, phase angle
Display
Power
Per-channel and total active power, apparent power, reactive
power,power factor
Integ
Active energy, reactiv energy, recording start time
recording stop time, elapsed time, energy cost
Demand
Active power demand value, reactive power demand value
power factor demand value
Waveform
Displays voltage and current waveform
Zoom
Enlarged view of 4 user-selected parameters
Trend
For one selected measurement item
displays maximum, average and minimum values
*2
One year
3.5 inch TFT color LCD (320 × 240 pixel)
Japanese, English, Chinese
Backlight auto-off function (after 2 minutes)
When AUTO OFF is active, the Power LED blinks
Operating
environment
Indoors, Pollution degree 2, altitude up to 2000 m (6562-ft.)
Operating
temperature and
humidity
(no condensation)
-10°C to 50°C (14°F to 122°F), 80% RH or less
During battery operation: 0°C to 40°C (32°F to 104°F), 80% RH or less
During battery charging: 10°C to 40°C (50°F to 104°F), 80% RH or less
Storage
temperature and
humidity
(no condensation)
0°C to 60°C (32°F to 140°F), 80% RH or less
However, the batteryُs storage temperature
range is -10°C to 30°C (14°F to 86°F)
Maximum rated voltage
between terminals
Voltage input section : 1.7 VAC, 2.4 Vpeak
Current input section : 1.7 VAC, 2.4 Vpeak
Maximum rated
voltage to earth
Voltage input section: 600V Measurement Category III
300V Measurement Category IV
Current input section: Depends on clamp sensor in use.
Dielectric strength
7.06 kVrms AC
Applicable standards
Safety: EN61010, EMC: EN61326, EN61000-3-2, EN61000-3-3
Power supply
The minimum interval time for saving screen copies is 5 min. If the setting is less than 5 min.,
screen copies will be saved every 5 min.
With shortest interval of 1 minute.When set to less than 1 minute, waveforms are saved once every minute
(1) Z1008 AC Adapter : 100 VAC to 240 VAC
Maximum rated power : 45VA (including AC adapter)
(2) Model 9459 Battery Pack : Ni-MH DC7.2 V 2700 mAh
Continuous battery operation time Approx. 5 hr.
Maximum rated power : 3VA
Charge function
Charge time: Max. 6 hr. 10 min. (reference value at 23°C)
Charges the battery regardless of whether the instrument is on or off
External interfaces
Backup
battery life
Clock and settings (Lithium battery),
Approx. 10 years @23°C (@73.4°F)
Recording
*1
General
Save destination
SD Card, internal memory (capacity: approx. 320 KB)
Save interval
time
1/2/5/10/15/30 seconds, 1/2/5/10/15/20/30/60 minutes
Available storage time is displayed on the PW3365-20's setting screen
Save items
Measurement save : Average only/average, maximum, minimum
Screen save : Saves the displayed screen as a BMP at a fixed interval*1
Waveform save : Stores binary waveform data*2
Recording start methods
Interval time, manual, or at specified time, repeat
Recording stop methods
Manual, or at specified time (up to one year), timer
SD card
Settings data, measurement data, screen data, waveform data
LAN
10BASE-T/100BASE-TX IEEE802.3 Compliance
- HTTP server function
USB
USB Ver 2.0, Windows 8 (32/64bit)/Windows 7 (32/64bit) / Vista (32bit) /XP
- When connected to a computer, the SD Card and internal
memory are recognized as removable storage devices.
LAN/USB
Download settings and data using free application program
Dimensions
Approx. 180W(7.09") × 100H(3.94") × 48D (1.89") mm (without PW9002)
Approx. 180W(7.09") × 100H(3.94") × 68D (2.68") mm (with PW9002)
Mass
Approx. 540g (19 oz) (without PW9002), Approx. 820g (28.9 oz) (with PW9002)
Accessories
SAFETY VOLTAGE SENSOR PW9020 (1 set)
AC ADAPTER Z1008 (1)
USB cable (1)
Instruction manual (1)
Measurement guide (1)
Color spiral tubes (1 set : red, yellow, blue/four each)
Spiral tubes (10)
POWER LOGGER VIEWER SF1001 Specifications
Functions
Trend graph
display function
Preview and print content shown on the trend graph, report,
harmonic graph and settings displays.
Display items
Voltage, current, active power, reactive power, apparent power,
power factor, frequency, integrated active power, integrated
reactive power, demand volume, demand value, voltage
disequilibrium factor
Print function
Print (static) contents over a specific time period
Cursor measurements
Measurement values can be displayed by the cursor
Summary
display
function
Output contents: Standard or selected output items
Report printing
Time span aggregation: Aggregates data into up to four
specified time spans
Waveform display
Displays waveform data at specified date and time
Copy function
Captures any display image to the clipboard
Available output items: Trend graph, summary, daily report, waveform
Report creation method: Standard print
Daily, weekly and monthly report displays: Accumulates and
displays daily, weekly and monthly reports over specified period.
Load factor calculation display: Calculates and displays load factor
and demand factor results with daily, weekly and monthly reports
Header/Footer settings: Sets the header and footer for each printout
Printing support
Any color or monochrome printing supported by the operating system
Stacked bar graph display : Up to 16 types of data series
Displayed items are the same as for the trend Graph Display
Comment entry (Text comments can be entered in any printout)
Report output settings: Save/load report output settings
General Specifications
Supported models
Supported
computer
operating systems
PW3365-20 / PW3360-20 / PW3360-21
LR5000 series ; Data previously loaded by the LR5000 Utility (.hrp2 format) using a PC
Windows 8 (32/64bit)
Windows 7 SP1 or later (32/64bit)
Windows Vista SP2 or later (32bit)
Windows XP SP3 or later (32bit)
Download HIOKI PW3365 ENG
HIOKI_PW3365_ENG.pdf (PDF, 4.85 MB)
Download PDF
Share this file on social networks
Link to this page
Permanent link
Use the permanent link to the download page to share your document on Facebook, Twitter, LinkedIn, or directly with a contact by e-Mail, Messenger, Whatsapp, Line..
Short link
Use the short link to share your document on Twitter or by text message (SMS)
HTML Code
Copy the following HTML code to share your document on a Website or Blog
QR Code to this page

This file has been shared publicly by a user of PDF Archive.
Document ID: 0000326708.