Wolfe Waves (PDF)
File information
Title: Microsoft Word - Wolfe Wave - Street smarts.doc
Author: Phil Dunn
This PDF 1.2 document has been generated by Pscript.dll Version 5.0 / AFPL Ghostscript 8.50, and has been sent on pdf-archive.com on 15/01/2016 at 01:50, from IP address 176.225.x.x.
The current document download page has been viewed 4244 times.
File size: 241.12 KB (6 pages).
Privacy: public file


File preview
CHAPTER15
WOLFE WAVES
This particular methodology is perhaps the most unique, effective trading technique I've (Linda) ever come across! It
was developed and shared by a good friend, Bill Wolfe, who for the last 10 years has made a living trading the S&P
His son, Brian, also trades it. Brian was the first teenager I've ever met who consistently made a good income scalping
NYFE (Knife) futures from his apartment. Brian, now 21, has expanded into trading the Wolfe Wave in other markets.
Bill's theory of wave structure is based on Newton's first law of physics: for every action there is an opposite reaction.
This movement creates a definite wave with valuable projecting capabilities. This wave most clearly sets up when there
is good volatility. With a bit of practice, it is easy to train your eye to spot these patterns instantly.
The following rules will make sense when you examine the examples. (Please note the odd sequence in counting. As
you will see, it is necessary- for the inductive analysis.)
By starting with a top or bottom on the bar chart, we are assured of beginning our count on a new wave. This count is
for a buy setup. We begin the count at a top. (The wave count would be reversed if we were starting at the bottom
looking for a sell setup).
122
1.
Number 2 wave is a top.
2.
Number 3 wave is the bottom of a first decline.
3.
Number 1 wave is the bottom prior to wave 2 (top). Point 3 must be lower than point 1.
4.
Number 4 wave is the top of wave 3. The wave 4 point should be higher than the wave 1 bottom.
5.
A trend line is drawn from point 1 to point 3. The extension of this line projects to the anticipated reversal point
which we will call wave 5. this is the entry point for a ride to the epa line (1 to 4).
6.
The Estimated Price at Arrival (EPA) is the trend line drawn from points 1 to 4. This projects the anticipated
price objective. Our initial stop is placed just beneath the newly formed reversal at point 5. It can then be
quickly moved to breakeven.
IMPORTANT POINT: You cannot begin looking for the Wolfe Wave until points 1, 2, 3, and 4 have been formed.
Keep in mind that point 3 must be lower than point 1 for a buy setup. It must be higher than point 1 for a sell setup.
Also, on the best waves point 4 will be higher than point 1 for a buy setup and lower than 1 for a sell setup. This
ensures that absolute runaway market conditions do not exist.
Now, study the examples and see if you can train your eye to begin to see the Wolfe Wave setup.
Exhibit 15.1 illustrates what a Wolfe Wave looks like when it is starting to form.
Point 1, 2, and 3 must already have formed. Point 2 must be a significant swing low or high. A trend line is then drawn
between points 1 and 3. This projects where we should anticipate point 5.
123
EXHIBIT 15.1 S&P-60-Minute Detail
Point 5 is formed. We will buy the reversal from this area and place a tight stop underneath. If we draw a trend line
from point 1 to point 4, it should give us a price projection.
EXHIBIT 15.1A S&P 60-Minute Detail
124
EXHIBIT 15.2 S&P-60-Minute
The price meets its objective for a potential gain of 12 points!
125
EXHIBIT 15.3 Sugar-10-Tick
Point 2 is the initial starting point for the pattem. I always find it easiest to start the count at this point. Then, backtrack
and find point 1 and 3. Don't forget that point 4 must be higher than point 1. Our trend line is drawn projecting point 5.
The market finds support at this level, so we enter a long position at-themarket and place a stop just below point 5. The
market trades to its objective.
126
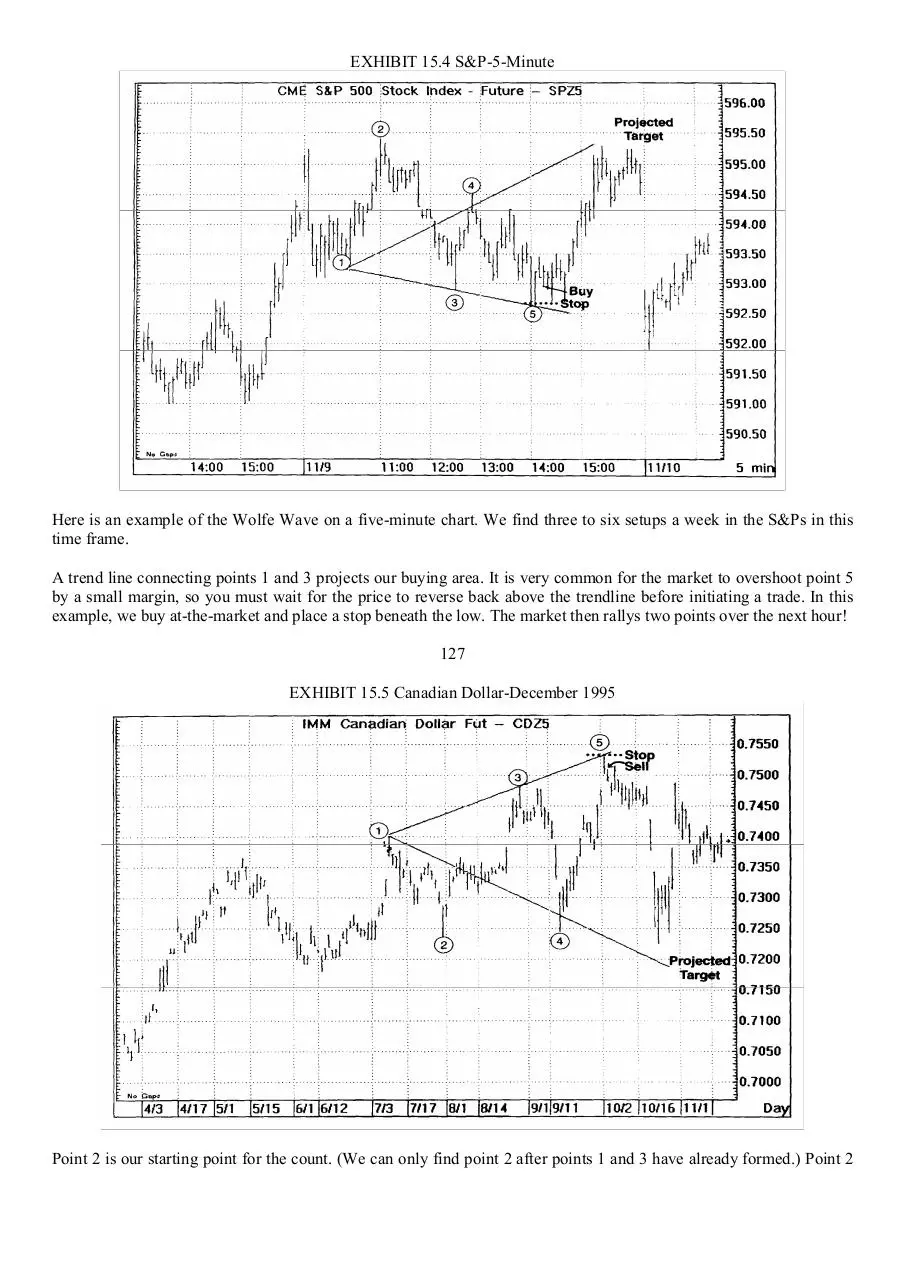
EXHIBIT 15.4 S&P-5-Minute
Here is an example of the Wolfe Wave on a five-minute chart. We find three to six setups a week in the S&Ps in this
time frame.
A trend line connecting points 1 and 3 projects our buying area. It is very common for the market to overshoot point 5
by a small margin, so you must wait for the price to reverse back above the trendline before initiating a trade. In this
example, we buy at-the-market and place a stop beneath the low. The market then rallys two points over the next hour!
127
EXHIBIT 15.5 Canadian Dollar-December 1995
Point 2 is our starting point for the count. (We can only find point 2 after points 1 and 3 have already formed.) Point 2
does not have to be a longterm trend reversal, only a significant swing high or low.
My friend Dan sent me this chart when point 5 had formed. 1 shook my head and said the market felt so strong-how
could it possibly break down! It came darned close to meeting the projection. I don't think anyone could have imagined
this scenario at the time. (Notice the spike and ledge pattem the market broke from!)
128
EXHIBIT 15.6 Boeing (BA)-1995
Here is an example on a stock chart. Point 2 is a significant swing low. Point 4 is lower than point 1. A trend line
connecting 1 and 3 projects point 5 where the market meets the price objective to the tick! Again, as in the Canadian
dollar, the trade did not quite meet its projected downside target. However, there was plenty of opportunity to take
some profits out of this 10-point drop.
129
EXHIBIT 15.7 SPZ-10-Tick
Wolfe Waves sometimes set up on Three Little Indians. Look back in Chapter 14 and see if you can see the waves on
Examples 14.7 and 14.8.
130
LINDA:
It took me awhile to get the hang of spotting this pattern. Now 1 try to look for them on all my charts. 1 have a lot of
fun watching them develop.
Everyone in my office was watching the 60-minute S&P example shown earlier take shape. None of us could believe it
when the projected objective was met. A local group of Wolfe Wave practitioners began to fax the chart to each other.
Of course, none of us actually caught the whole move. Some of us were lucky and used the pattem to exit a short trade
at point 5, but Brian actually went long right at the bottom!
Download Wolfe Waves
Wolfe Waves.pdf (PDF, 241.12 KB)
Download PDF
Share this file on social networks
Link to this page
Permanent link
Use the permanent link to the download page to share your document on Facebook, Twitter, LinkedIn, or directly with a contact by e-Mail, Messenger, Whatsapp, Line..
Short link
Use the short link to share your document on Twitter or by text message (SMS)
HTML Code
Copy the following HTML code to share your document on a Website or Blog
QR Code to this page

This file has been shared publicly by a user of PDF Archive.
Document ID: 0000332467.