AMman1.3 (PDF)
File information
This PDF 1.5 document has been generated by LaTeX with hyperref package / pdfTeX-1.40.14, and has been sent on pdf-archive.com on 21/01/2016 at 17:56, from IP address 193.1.x.x.
The current document download page has been viewed 516 times.
File size: 136.37 KB (6 pages).
Privacy: public file


File preview
Ancestry Mapper 2.0
Tiago R Magalh˜aes, Darren J. Fitzpatrick, Eoghan O’Halloran
January 19, 2016
Abstract
AncestryMapper is an R package that implements the methods described in Magalh˜
aes TR, Casey JP, Conroy J, Regan R, Fitzpatrick DJ,
et al. (2012) HGDP and HapMap Analysis by Ancestry Mapper Reveals
Local and Global Population Relationships. PLoS ONE 7(11): e49438.
Contents
1 Introduction
2 Package Functions
2.1 calculateAMids
2.2 plotAMids . . .
2.3 RefAdd . . . .
2.4 createMedoid .
1
.
.
.
.
.
.
.
.
.
.
.
.
.
.
.
.
.
.
.
.
.
.
.
.
.
.
.
.
.
.
.
.
.
.
.
.
.
.
.
.
.
.
.
.
.
.
.
.
.
.
.
.
.
.
.
.
.
.
.
.
.
.
.
.
.
.
.
.
.
.
.
.
.
.
.
.
.
.
.
.
.
.
.
.
.
.
.
.
.
.
.
.
.
.
.
.
.
.
.
.
.
.
.
.
.
.
.
.
.
.
.
.
2
2
2
2
3
3 Producing a BED file
3
4 Example Data
4
5 Additional Data
4
6 Tutorial
4
1
Introduction
Knowledge of human origins, migrations and expansions is greatly enhanced
by the availability of large datasets of genetic information from different populations and by the development of bioinformatic tools used to analyze the data.
Ancestry Mapper assigns genetic ancestry to an individual and studies relationships between local and global populations. The principle function of the
method gives each individual an Ancestry Mapper Id (AMid), a genetic identifier
comprising genetic coordinates that corre- spond to its relationship to various
reference populations. The toy examples being from the Human Genome Diversity Project (HGDP). The AMid metrics have intrinsic biological meaning and
provide a tool to measure genetic similarity between world populations.
1
2
Package Functions
• calculateAMids: calculates and assigns Ancestry Mapper Ids (AMids) to
each individual
• plotAMids: produces a heatmap representation of AMids
• RefAdd: adds individuals and populations to reference file
• createMedoid: creates arithmetic medoid reference from BED file
2.1
calculateAMids
For each individual, calculateAMids computes the genetic distances amongst
that individual and the set of HGDP references. As input, the function requires
a PED formatted file. PED formatting is the standard file format required by
the PLINK software suite.
For details on the format see:
http://pngu.mgh.harvard.edu/ purcell/plink/.
It also requires a file containing the references with columns in the order of population, reference and order. As output, calculateAMids returns a dataframe
containing the genetic distance of each individual to the all HGDP references.
The genetic distance is computed as the Euclidean distance normalized by
the number of SNPs, between each individual and the 51-HGDP-based references. AMids for a single individual from any dataset can be computed provided
there is a reasonable overlap between the set of SNPs for that individual and the
HGDP references. The AMids can take values from 0 to 2. In our experience,
the values are in the range 0.4 to 1.1.
The normalized values of the distances are such that the highest reference
is scored as 100, the lowest as 0 and all others adjusted accordingly. These
indices place the individual in the genomic map, forcing it to be committed
to one reference, even if the absolute similarities, as indicated by the euclidean
distances, are not very big. Thus, they provide a global overview on the number
of relevant references for each individual.
2.2
plotAMids
The function plotAMids is used to visualize the relationship amongst individuals
and the 51 HGDP references. plotAMids takes as input the dataframe of genetic
distances returned by calculateAMids. The user can also provide a file with
phenotypes for each individual which will be visible in the plot. The colors for
the plot are from the BlBrewer and RedBl packages but are hard coded so there
are no dependencies.
2.3
RefAdd
RefAdd adds user-supplied references or data.
2
2.4
createMedoid
createMedoid constructs an arithmetic reference from a BED containing only
one population with at least 10 individuals.
3
Producing a BED file
The plink BED file should include individuals that will be taken as population
references that will be used to calculate the ancestry mapper indexes (AMIds)
for the user dataset. In our original work we used as references the 51 populations included in the Human Genome Diversity Project. The HGDP dataset
can be obtained at http://hagsc.org/hgdp/files.html.
PLINK files can be easily made from VCF files using VCFTools.
https://vcftools.github.io/man latest.html
In order to function, it is necessary for any BED files to be in the same strand
phase as the human reference genome. To do this you will need the ’All-00’ file
from dbSNP. This file can be obtained in vcf format here:
ftp://ftp.ncbi.nlm.nih.gov/snp/organisms/human 9606/VCF/00-All.vcf.gz
In order to merge the 00-All file with a BED formatted file use the –merge
command in PLINK; both files should be in the ACGT format.
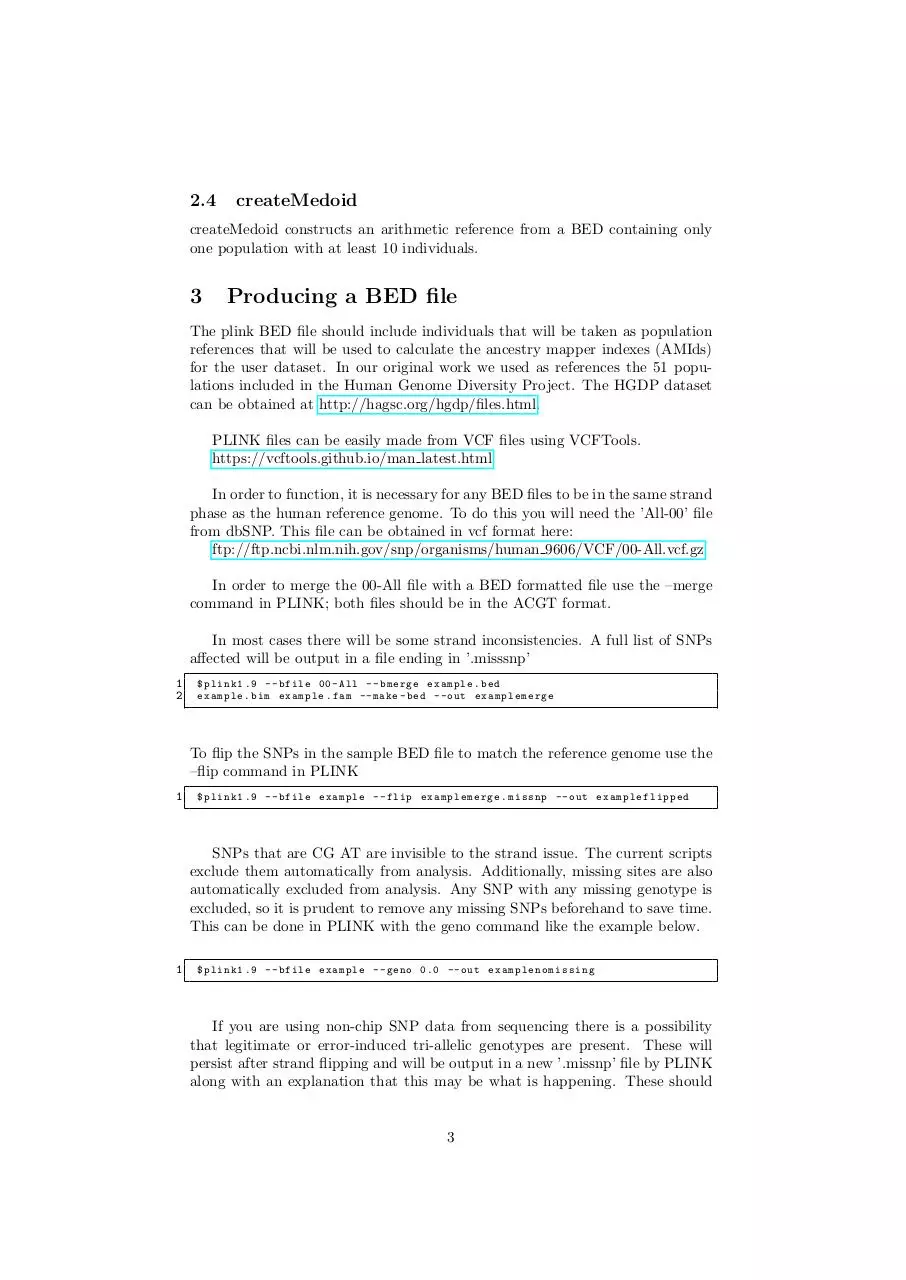
In most cases there will be some strand inconsistencies. A full list of SNPs
affected will be output in a file ending in ’.misssnp’
1
2
$ plink1 .9 -- bfile 00 - All -- bmerge example . bed
example . bim example . fam -- make - bed -- out examplemerge
To flip the SNPs in the sample BED file to match the reference genome use the
–flip command in PLINK
1
$ plink1 .9 -- bfile example -- flip examplemerge . missnp -- out exampl eflippe d
SNPs that are CG AT are invisible to the strand issue. The current scripts
exclude them automatically from analysis. Additionally, missing sites are also
automatically excluded from analysis. Any SNP with any missing genotype is
excluded, so it is prudent to remove any missing SNPs beforehand to save time.
This can be done in PLINK with the geno command like the example below.
1
$ plink1 .9 -- bfile example -- geno 0.0 -- out e x a m p l e n o m i s s i n g
If you are using non-chip SNP data from sequencing there is a possibility
that legitimate or error-induced tri-allelic genotypes are present. These will
persist after strand flipping and will be output in a new ’.missnp’ file by PLINK
along with an explanation that this may be what is happening. These should
3
be removed using the exclude command like the example below.
1
$ plink1 .9 -- bfile example -- exclude examplemerge . missnp -- out examplenotri
4
Example Data
Provided as toy data is a BED file containing 5000 SNPs of the samples from
the HGDP project. Due to the low number of SNPs, the plots will not look as
elegant, but will convey the general idea.
Additionally 45 medoids derived from the HGDP data are also included with
data for the same 5000 SNPs.
5
Additional Data
Full-sized medoids are currently being hosted at:
Any change in host will be accompanied by an update to the documentation.
6
Tutorial
In order to function, it is necessary to prepare any BED files as described above
in the section ’Producing a BED file’.
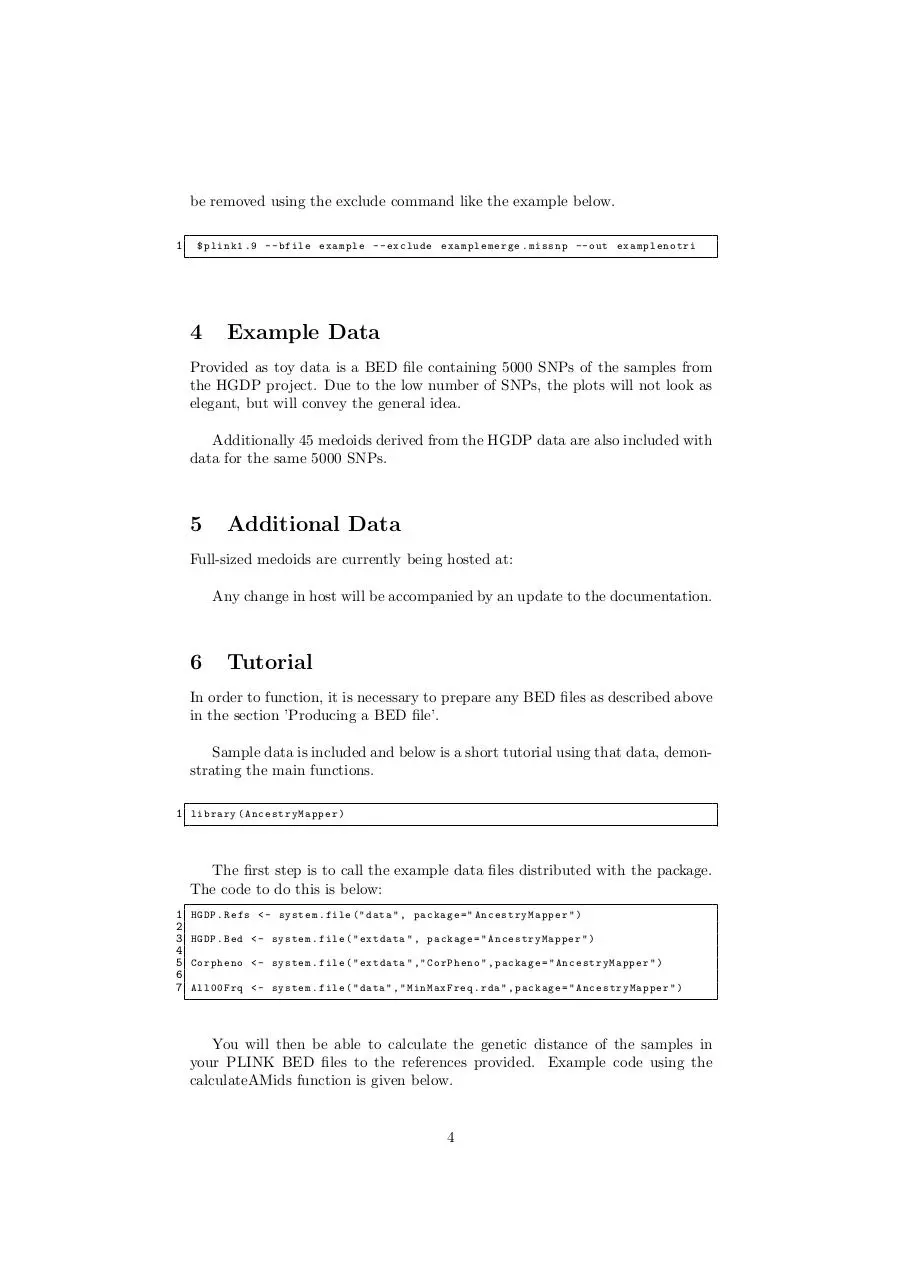
Sample data is included and below is a short tutorial using that data, demonstrating the main functions.
1 library ( Ance stryMapp er )
The first step is to call the example data files distributed with the package.
The code to do this is below:
1
2
3
4
5
6
7
HGDP . Refs <- system . file ( " data " , package = " An cestryMa pper " )
HGDP . Bed <- system . file ( " extdata " , package = " Ancest ryMapper " )
Corpheno <- system . file ( " extdata " ," CorPheno " , package = " Anc estryMap per " )
All00Frq <- system . file ( " data " ," MinMaxFreq . rda " , package = " Ancest ryMappe r " )
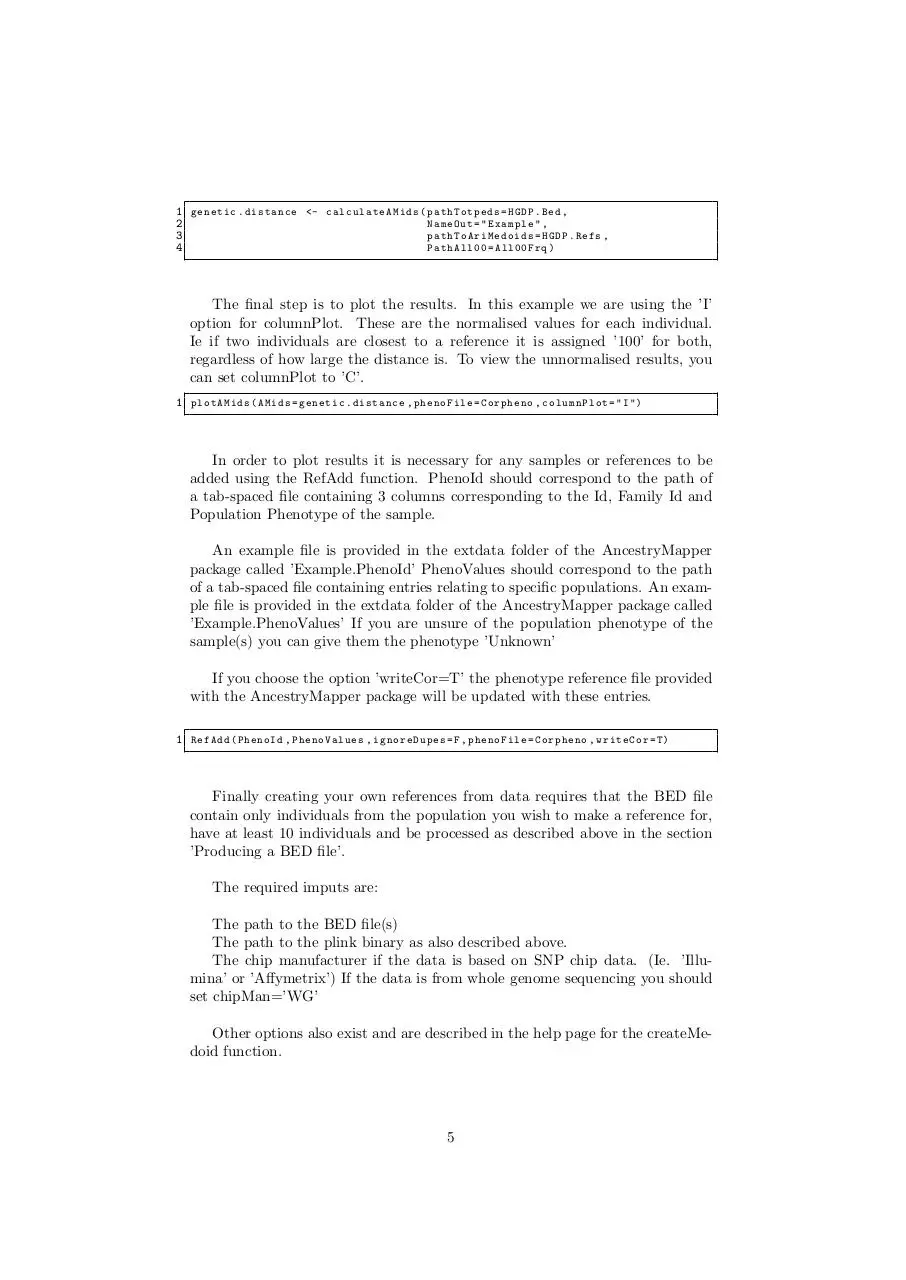
You will then be able to calculate the genetic distance of the samples in
your PLINK BED files to the references provided. Example code using the
calculateAMids function is given below.
4
1 genetic . distance <- ca lculateA Mids ( pathTotpeds = HGDP . Bed ,
2
NameOut = " Example " ,
3
p a t h T o A r i M e d o i d s = HGDP . Refs ,
4
PathAll00 = All00Frq )
The final step is to plot the results. In this example we are using the ’I’
option for columnPlot. These are the normalised values for each individual.
Ie if two individuals are closest to a reference it is assigned ’100’ for both,
regardless of how large the distance is. To view the unnormalised results, you
can set columnPlot to ’C’.
1 plotAMids ( AMids = genetic . distance , phenoFile = Corpheno , columnPlot = " I " )
In order to plot results it is necessary for any samples or references to be
added using the RefAdd function. PhenoId should correspond to the path of
a tab-spaced file containing 3 columns corresponding to the Id, Family Id and
Population Phenotype of the sample.
An example file is provided in the extdata folder of the AncestryMapper
package called ’Example.PhenoId’ PhenoValues should correspond to the path
of a tab-spaced file containing entries relating to specific populations. An example file is provided in the extdata folder of the AncestryMapper package called
’Example.PhenoValues’ If you are unsure of the population phenotype of the
sample(s) you can give them the phenotype ’Unknown’
If you choose the option ’writeCor=T’ the phenotype reference file provided
with the AncestryMapper package will be updated with these entries.
1 RefAdd ( PhenoId , PhenoValues , ignoreDupes =F , phenoFile = Corpheno , writeCor = T )
Finally creating your own references from data requires that the BED file
contain only individuals from the population you wish to make a reference for,
have at least 10 individuals and be processed as described above in the section
’Producing a BED file’.
The required imputs are:
The path to the BED file(s)
The path to the plink binary as also described above.
The chip manufacturer if the data is based on SNP chip data. (Ie. ’Illumina’ or ’Affymetrix’) If the data is from whole genome sequencing you should
set chipMan=’WG’
Other options also exist and are described in the help page for the createMedoid function.
5
PLINK is necessary for the function ’createMedoid’. PLINK can be downloaded at: https://www.cog-genomics.org/plink2 You will need to specify a path
to the plink binary executable like this:
1 plinkpath <- " / home / user / Plink / plink1 .9 "
1 createMedoid ( pathToBeds , plink , chipMan )
6
Download AMman1.3
AMman1.3.pdf (PDF, 136.37 KB)
Download PDF
Share this file on social networks
Link to this page
Permanent link
Use the permanent link to the download page to share your document on Facebook, Twitter, LinkedIn, or directly with a contact by e-Mail, Messenger, Whatsapp, Line..
Short link
Use the short link to share your document on Twitter or by text message (SMS)
HTML Code
Copy the following HTML code to share your document on a Website or Blog
QR Code to this page

This file has been shared publicly by a user of PDF Archive.
Document ID: 0000334053.