Labour Market Information (PDF)
File information
This PDF 1.4 document has been generated by , and has been sent on pdf-archive.com on 08/03/2016 at 20:17, from IP address 209.221.x.x.
The current document download page has been viewed 482 times.
File size: 159.39 KB (6 pages).
Privacy: public file


File preview
2/10/2016
Labour Market Information
Topics +
Labour Market Information
Software engineers and designers (2173)
Software Engineers and Designers research, design, evaluate, integrate and maintain
software applications, technical environments, operating systems, embedded software,
information warehouses and telecommunications software. They are employed in
information technology consulting firms, information technology research and development
firms, and information technology units throughout the private and public sectors, or they
may be self-employed.
Employment Prospect rating
Current (2013-2017): Average
Previous (2009-2013): Above Average
What do the employment prospects ratings mean?
Ontario Job Futures rates employment prospects as either “Above Average”,
“Average” or “Below Average”. These ratings focus on the recent labour market
conditions and projections of demand for new workers, but do not consider the
existing or potential supply of workers (such as new graduates and immigrants). The
employment prospect ratings are developed for Ontario as a whole, and may not
reflect the labour market outlook in every region of the province.
“Above Average" labour market conditions usually mean that, relative to the
employment situation overall, there is a better likelihood of finding stable work
in this occupation, and employment prospects are attractive or improving.
"Average" labour market conditions indicate that jobs are expected to be more
difficult to find; the probability of unemployment is higher; and wages and
salaries have recently increased at a slower pace than those occupations rated
as "Above Average." On the other hand, jobs are easier to find; unemployment
is less likely; and wages and salaries have recently increased at a faster pace
than in those occupations rated "Below Average".
"Below Average" labour market conditions mean that it is more difficult to find
stable work or employment prospects are not attractive or are deteriorating
relative to those in other industries or occupations. For new entrants, such as
people leaving school and immigrants, “Below Average” labour market
conditions mean a relatively low probability of finding stable work in this
occupation and lower potential for rising pay.
https://www.app.tcu.gov.on.ca/eng/labourmarket/ojf/profile.asp?NOC_CD=2173
1/6
2/10/2016
Labour Market Information
Hide
What are the employment requirements for this occupation?
A bachelor's degree, usually in computer science, computer systems
engineering, softwareengineering or mathematics or completion of a college
program in computer science is usuallyrequired.
A master's or doctoral degree in a related discipline may be required.
Licensing by a provincial or territorial association of Professional Engineers is
required to approveengineering drawings and reports and to practise as a
Professional Engineer (P.Eng.).
Engineers are eligible for registration following graduation from an accredited
educational program,three or four years of supervised work experience in
engineering and passing a professional practiceexamination.
Three-year diploma in technology from a College of Applied Arts and
Technology; or a bachelor’s degree in a relevant science area; or academic
qualifications deemed by the Canadian Council of Professional Engineers to be
equivalent to a diploma or degree is required
In Ontario, to practise professional engineering and to use the title 'Professional
Engineer', a licensefrom Professional Engineers Ontario is required. Those who
do not meet the requirements forlicensing, can work in engineering if a
Professional Engineer supervises this individual’s work andtakes responsibility
for it.
Hide
How quickly has employment grown for this occupation compared with others?
Figure 1 compares the trend in employment growth between 2001 and 2011.
Employment levels in 2011:
Software engineers and designers: 22,000
Professional Occupations in Natural and Applied Sciences:
336,000
All Occupations: 6,731,000
50
Percentage change from 2001
25
2011
2010
2009
2006
2005
2004
All Occupations: 0%
2003
2002
2001
-25
Software engineers and designers: 0%
-50
Professional Occupations in Natural and Applied Sciences: 0%
2008
0
2007
2001
Source: Statistics Canada
Notes: The data are based on the Labour Force Survey and consequently are subject
https://www.app.tcu.gov.on.ca/eng/labourmarket/ojf/profile.asp?NOC_CD=2173
2/6
2/10/2016
Labour Market Information
to sampling variability, which may overstate the actual changes in employment level.
As a result, estimates should be interpreted with caution.
Hide
How are job openings for this occupation expected to compare with those in other
occupations from 2013 to 2017?
Figure 2 shows the two components of projected job openings (new jobs and
attrition).
Share new jobs (2013-17)
Share attrition (2013-17)
80
60
40
66%
62%
51%
49%
38%
34%
20
0
Software engineers and
designers
Professional Occupations in
Natural and Applied Sciences
All Occupations
Source: Canadian Occupational Projection System
Note: Percentages may not sum to 100 due to rounding.
Hide
How do wages for this occupation compare with others?
Figure 3: Average Annual Employment Income, Employed Full-Time Full-Year in
2010, Ontario
Software engineers and designers
All Occupations
$100,000
$92,713
$75,000
$61,495
$50,000
$25,000
$0
Software engineers and designers
All Occupations
Source: Statistics Canada
https://www.app.tcu.gov.on.ca/eng/labourmarket/ojf/profile.asp?NOC_CD=2173
3/6
2/10/2016
Labour Market Information
Hide
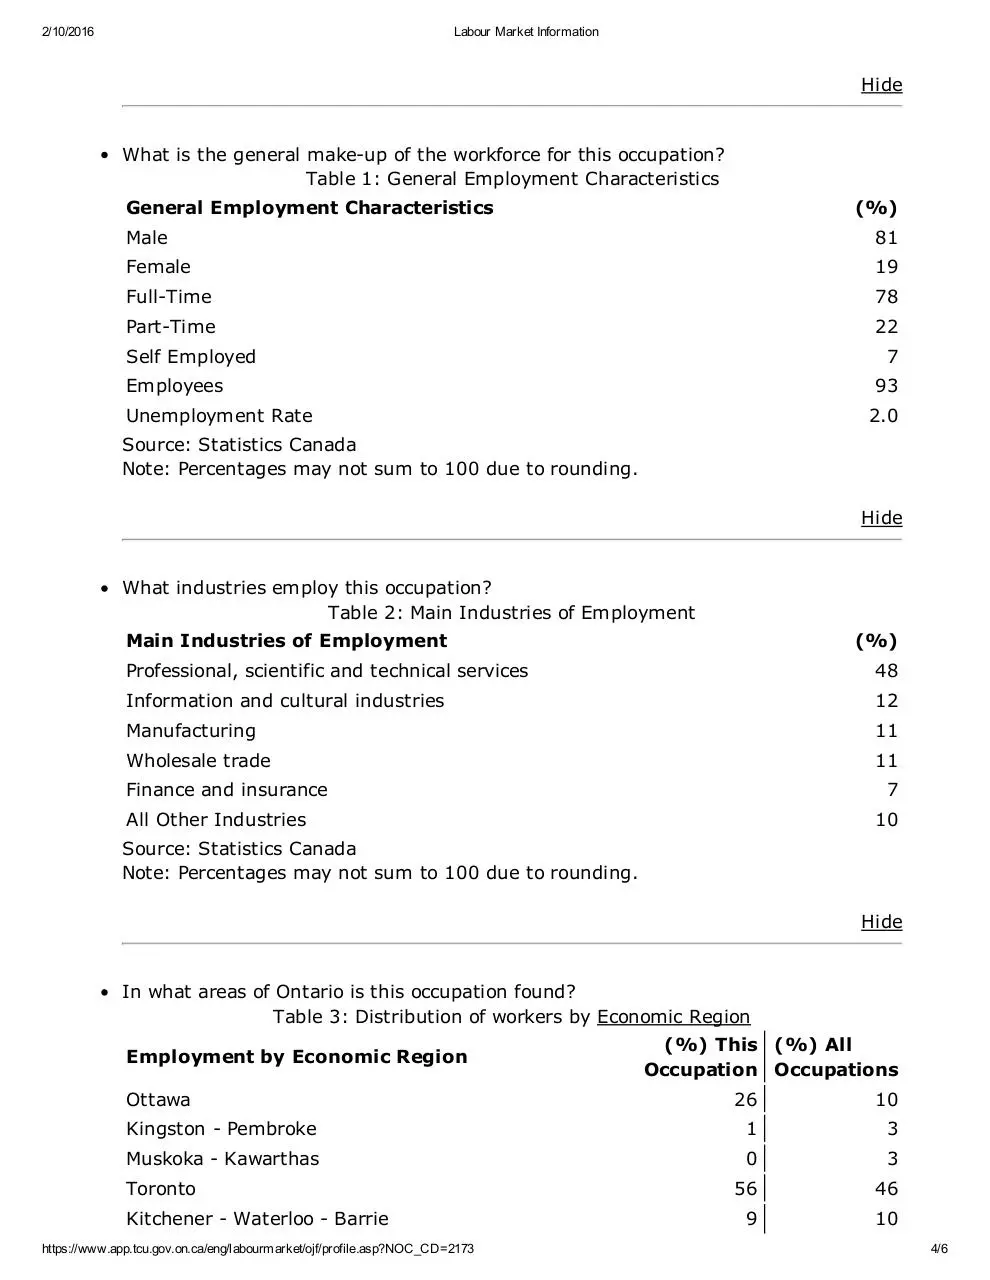
What is the general make-up of the workforce for this occupation?
Table 1: General Employment Characteristics
General Employment Characteristics
(%)
Male
81
Female
19
Full-Time
78
Part-Time
22
Self Employed
7
Employees
93
Unemployment Rate
2.0
Source: Statistics Canada
Note: Percentages may not sum to 100 due to rounding.
Hide
What industries employ this occupation?
Table 2: Main Industries of Employment
Main Industries of Employment
(%)
Professional, scientific and technical services
48
Information and cultural industries
12
Manufacturing
11
Wholesale trade
11
Finance and insurance
7
All Other Industries
10
Source: Statistics Canada
Note: Percentages may not sum to 100 due to rounding.
Hide
In what areas of Ontario is this occupation found?
Table 3: Distribution of workers by Economic Region
Employment by Economic Region
Ottawa
(%) This (%) All
Occupation Occupations
26
10
Kingston - Pembroke
1
3
Muskoka - Kawarthas
0
3
56
46
9
10
Toronto
Kitchener - Waterloo - Barrie
https://www.app.tcu.gov.on.ca/eng/labourmarket/ojf/profile.asp?NOC_CD=2173
4/6
2/10/2016
Labour Market Information
Hamilton - Niagara Peninsula
4
10
London
2
5
Windsor - Sarnia
1
4
Stratford - Bruce Peninsula
0
2
Northeast
0
4
Northwest
0
2
Source: Statistics Canada
Note: Percentages may not sum to 100 due to rounding.
Hide
What licensing bodies or associations are important for this occupation?
Canadian Information Processing Society
Engineers Canada
Information and Communications Technology Council
Information Technology Association of Canada (ITAC)
Institute for Certification of Computing Professionals
International Association for Management of Technology
Professional Engineers Ontario
TASSQ (Toronto Association of Systems and Software Quality)
The Information Systems Audit and Control Association, Toronto Chapter
Hide
How current is the information provided here?
Ontario Job Futures uses a variety of information sources. Most charts and
tables use data from the 2011 National Household Survey, and these are
updated every 5 years. "How quickly has employment grown..." also uses data
from the Labour Force Survey, which are updated every year. However, we use
2011 to be consistent with the National Household Survey data. The
Employment Prospect ratings are based on occupational projections developed
every two years, and these are also the source for the chart "How are job
openings for this occupation expected to compare...". Information on licensing
bodies and associations is updated as needed to add or remove groups, and
update links.
Hide
Read about the main duties, common titles and other information for this occupation
at the National Occupational Classification website
Site Help
https://www.app.tcu.gov.on.ca/eng/labourmarket/ojf/profile.asp?NOC_CD=2173
5/6
2/10/2016
Labour Market Information
Contact Us
Accessibility
Privacy
Site Map
Notices
© Queen's Printer for Ontario, 2016
Important Notices
- LAST MODIFIED: 18/01/16 2:20:58 PM
https://www.app.tcu.gov.on.ca/eng/labourmarket/ojf/profile.asp?NOC_CD=2173
6/6
Download Labour Market Information
Labour Market Information.pdf (PDF, 159.39 KB)
Download PDF
Share this file on social networks
Link to this page
Permanent link
Use the permanent link to the download page to share your document on Facebook, Twitter, LinkedIn, or directly with a contact by e-Mail, Messenger, Whatsapp, Line..
Short link
Use the short link to share your document on Twitter or by text message (SMS)
HTML Code
Copy the following HTML code to share your document on a Website or Blog
QR Code to this page

This file has been shared publicly by a user of PDF Archive.
Document ID: 0000347661.