Asius AES Paper (PDF)
File information
Title: Audio Engineering Society
Author: Bob Dukes
This PDF 1.5 document has been generated by Microsoft® Office Word 2007, and has been sent on pdf-archive.com on 31/03/2016 at 23:24, from IP address 173.12.x.x.
The current document download page has been viewed 1047 times.
File size: 803.27 KB (19 pages).
Privacy: public file


File preview
Audio Engineering Society
Convention Paper
Presented at the 130th Convention
2011 May 13–16
London, UK
The papers at this Convention have been selected on the basis of a submitted abstract and extended precis that have been peer
reviewed by at least two qualified anonymous reviewers. This convention paper has been reproduced from the author's advance
manuscript, without editing, corrections, or consideration by the Review Board. The AES takes no responsibility for the contents.
Additional papers may be obtained by sending request and remittance to Audio Engineering Society, 60 East 42 nd Street, New
York, New York 10165-2520, USA; also see www.aes.org. All rights reserved. Reproduction of this paper, or any portion thereof,
is not permitted without direct permission from the Journal of the Audio Engineering Society.
Sound Reproduction within a Closed Ear
Canal: Acoustical and Physiological Effects
Samuel P. Gido1,2, Robert B. Schulein1, and Stephen D. Ambrose1,*
1
2
Asius Technologies LLC, 1257 Whitehall Drive, Longmont, CO 80504
Polymer Science & Engineering Department, University of Massachusetts, Amherst, MA 01003
*
to whom correspondence should be addressed: Stephen.Ambrose@AsiusTechnologies.com
ABSTRACT
When a sound producing device such as insert earphones or a hearing aid is sealed in the ear canal, the fact that only
a tiny segment of the sound wave can exist in this small volume at any given instant, produces an oscillation of the
static pressure in the ear canal. This effect can greatly boosts the SPL in the ear canal, especially at low frequencies,
a phenomena which we call Trapped Volume Insertion Gain (TVIG). In this study the TVIG has been found by
numerical modeling as well as direct measurements using a Zwislocki coupler and the ear of a human subject, to be
as much as 50dB greater than sound pressures typically generated while listening to sounds in an open environment.
Even at moderate listening volumes, the TVIG can increase the low frequency SPL in the ear canal to levels where
they produce excursions of the tympanic membrane that are 100 to 1000 times greater than in normal open-ear
hearing. Additionally, the high SPL at low frequencies in the trapped volume of the ear canal, can easily exceed the
threshold necessary to trigger the Stapedius reflex, a stiffing response of the middle ear, which reduces its
sensitivity, and may lead to audio fatigue. The addition of a compliant membrane covered vent in the sound tube of
an insert ear tip was found to reduce the TVIG by up to 20 dB, such that the Stapedius reflex would likely not be
triggered.
1.
INTRODUCTION
From the 1960’s to the present, co-author Stephen D.
Ambrose has been investigating and developing
improved technology for coupling sound into the human
ear.[1] This effort began with his introduction and
refinement of the first in-ear monitors (IEM), by the
second half of the 1970’s. These devices, including
wireless links and ambient monitoring, were adopted
and used extensively by a wide range of top studio and
touring musicians.[2] Aside from the user benefits
provided by IEM devices over traditional stage
Gido, Schulein & Ambrose
Sound Reproduction within a Closed Ear Canal
monitors, the fact that he was both and engineer and a
vocal performer gave him a unique grasp of the full
range of drawbacks associated with sealing a speaker in
the ear. Among these were excessive SPL, audio
fatigue, the occlusion effect, and other serious issues
with pitch perception, frequency response, and dynamic
range, which do not exist in open-ear or natural
acoustics. Development and experimental efforts
undertaken throughout the 1970’s and 1980’s to
alleviate these issues, culminated in a previously issued
patent.[3], providing partial solutions. The present paper
provides a scientific explanation of Ambrose’s previous
observations about sealing sound producing devices in
the ear, and discusses his most recent technology to
mitigate these effects.
It seems particularly counter productive to have devices
intended to provide high fidelity audio (insert
headphones, ear buds, etc.), or aid to the hearing
impaired (hearing aids) that simultaneously reduce
hearing sensitivity by triggering the stapedius reflex. It
is possible that trapped volume insertion gain, which is
operating continuously as long as the device is sealed in
the ear canal, causes the Stapedius Reflex to be
triggered again and again. This is not a normal condition
for the stapedius muscle, and it significantly contributes
to and may even be the main cause of listener fatigue, in
which peoples’ ears begin to physically ache or hurt
after prolonged use of in-ear devices.
Audio speakers, when inserted and sealed in the human
ear, can produce large oscillations in pressure within the
ear canal, even when the speakers are operated at what
would normally be considered modest input power.
These pressures differ from acoustical sound pressures
as they normally exist in open air or in larger confined
volumes. The tiny confined volume of the ear canal,
which is much smaller than most acoustical
wavelengths, causes the sound pressure in the ear canal
to behave as if it is a static pressure, like the pressure
confined in an inflated balloon or the static pressure
employed in Tympanometry[4-6]. But, paradoxically,
this static pressure is also changing very rapidly, i.e. it is
oscillating at acoustical frequencies. The presence of
oscillating static pressure, when the ear canal is sealed
with a listening device, can produces a dramatic
increase in sound pressure levels (SPL), which we call
the Trapped Volume Insertion Gain (TVIG). Even when
the input power to the listening device, sealed in the ear,
is quite modest, the TVIG effect can subject the listener
to SPL levels that exceed the threshold for the Stapedius
Reflex[7-14]. This reflex is a natural mechanism by
which the contraction of the stapedius muscle in the ear
reduces the ear’s sensitivity in order to protect itself
from being damaged by loud noises and to widen its
dynamic range to tolerate higher sound pressure levels.
This reduction in hearing sensitivity has the potential to
diminish the dynamic quality of audio perception
through insert headphones or hearing aids. The
oscillating static pressure trapped in the ear canal is also
responsible for gross over-excursions of the tympanic
membrane (ear drum) that can be 100, or 1000, or more,
times greater than the normal oscillations of the ear
drum associated with sound transmitted through the
open air.
Here we also discuss new approaches to mitigate the
negative impacts of sealing a listening device in the ear.
These approaches essentially allow the trapped volume
in the ear canal to behave acoustically as if it is not
trapped, or at least less confined than it actually is. This
at least partially transforms the sound energy in the
trapped volume in the ear canal from an oscillating
static pressure back into a normal acoustic wave, which
is lower in amplitude and less punishing in its effects on
the ear drum, the stapedius muscle, and the ear in
general.
2.
SPEAKER SEALED IN THE EAR CANAL
When a speaker is sealed in the ear canal, creating a
small trapped volume of air, the familiar physics of
sound generation and sound propagation in open air is
altered dramatically. If the length of this trapped volume
in the ear canal is taken to be about 1 cm or less (values
vary by individuals and with the type of device and
depth of insertion in the ear), Figure 1 shows the length
of the trapped volume as a fraction of the wavelength of
sound across the frequency range. Especially for low
frequencies, but extending up into the mid-range, the
trapped volume in the ear canal is only a small fraction
of the wavelength of the sound.
Within this small trapped volume, only a tiny snippet at
a time of an oscillating pressure profile (what would be
a normal sound wave in open air) can exist. Especially
for lows and mid-range frequencies, the pressure across
this small trapped volume is very nearly constant
because the ear canal is only sampling a small section of
the “wave” at a given instant. As a result of the fact that
pressure maxima can no longer coexist in time with
pressure minima (as they do in open air sound waves)
the average static air pressure of the system is no longer
constrained to remain constant (as it is for sound wave
AES 130th Convention, London, UK, 2011 May 13–16
Page 2 of 19
Gido, Schulein & Ambrose
Sound Reproduction within a Closed Ear Canal
pressure, to distinguish it from the SPL employed in the
technique, which is oscillating at acoustical frequencies,
and is generally of much lower magnitude. As discussed
below, the static pressure induced when a headset or
hearing aid with a speaker is sealed in the ear canal, has
a dual character. It is simultaneously a static pressure,
like the pressure produced by pumping air into the ear
canal in tympanometry, and an oscillating sound
pressure which can be measured as SPL.
Ear Canal / Wavelength
1
0.1
0.01
0.001
0.0001
10
100
1000
10000
Frequency (Hz)
Figure 1: Size of the Trapped Volume (ear canal)
relative to the Wavelength of Sound
Speed of P Equilibration/
Speed of Speaker Motion
1,000,000
100,000
10,000
1,000
100
10
100
1000
10000
Frequency (Hz)
Figure 2: Speed of Pressure Equilibration in the Ear
Canal Relative to the Speed of Speaker Motion
propagation in open air). In fact, the overall pressure in
the trapped volume of the ear canal can oscillate
dramatically, and this results in excursions of the
tympanic membrane that are orders of magnitude larger
than in normal, open-ear listening.
We refer to this pressure, caused by a sealed speaker in
the ear canal, as a static pressure. One reason for doing
so is that this pressure bears some similarity in its effect
on the tympanic membrane to the static pressure applied
in the diagnostic technique of tympanometry.[4-6] In
tympanometry, the ear canal is sealed with an insert
earphone and air is pumped in and out of the sealed
volume to both increase and reduce the pressure in the
sealed volume relative to atmospheric pressure (and the
pressure in the middle ear). This pressurization of the
ear canal in tympanometry is referred to as static
The static pressure in the ear canal is the pressure that
results from a change in the volume (a compression or
rarefaction) of a fixed amount of air trapped in the ear
canal. This static pressure may, at any instant, be greater
than, equal to, or less than the barometric pressure
outside the ear. The static pressure may be changing
(oscillating) rapidly, and thus the use of the term static
may seem strange. However, the term static refers to the
fact that this pressure is not a transient oscillation in
pressure (i.e. a sound wave in open air) but rather is a
thermodynamic, equilibrium property of the air mass
associated with its volume. If the volume of this fixed
mass of air is held constant (i.e. the speaker diaphragm
is frozen at any point of its motion) then the static
pressure will remain constant. If the volume of this air
mass is changing or oscillating with the speaker motion
then this thermodynamic, equilibrium property (static
pressure) will also be changing or oscillating. This is
true of the static pressure oscillations produced by a
speaker sealed in the ear canal, provided that the rate at
which pressure equilibrium is established at every
incremental position of the moving speaker diaphragm
is much faster than the motion of the diaphragm. The
static pressure equilibrates via molecular motions that
propagate across the 1 cm length of the trapped volume
at the speed of sound. Figure 2 plots the ratio of the
speed of pressure equilibration vs. the peak speed of
speaker motion across the frequency range. Clearly, the
equilibration of pressure is much faster (thousands to
hundreds of thousands of times faster) than the change
in pressure resulting from speaker motion, and thus the
pressure is at quasi-equilibrium, at any given instant,
with respect to the influence of the moving speaker
diaphragm, especially at lower frequencies.
2.1.
Acoustic Analysis
Beranek, analyzed the case of a rigid piston oscillating
in one end of a rigid tube, which is closed on the
opposite end.[15] His analysis focuses mainly on tubes,
which are long enough to set up standing wave patterns
with various locations of increased and decreased
AES 130th Convention, London, UK, 2011 May 13–16
Page 3 of 19
Sound Reproduction within a Closed Ear Canal
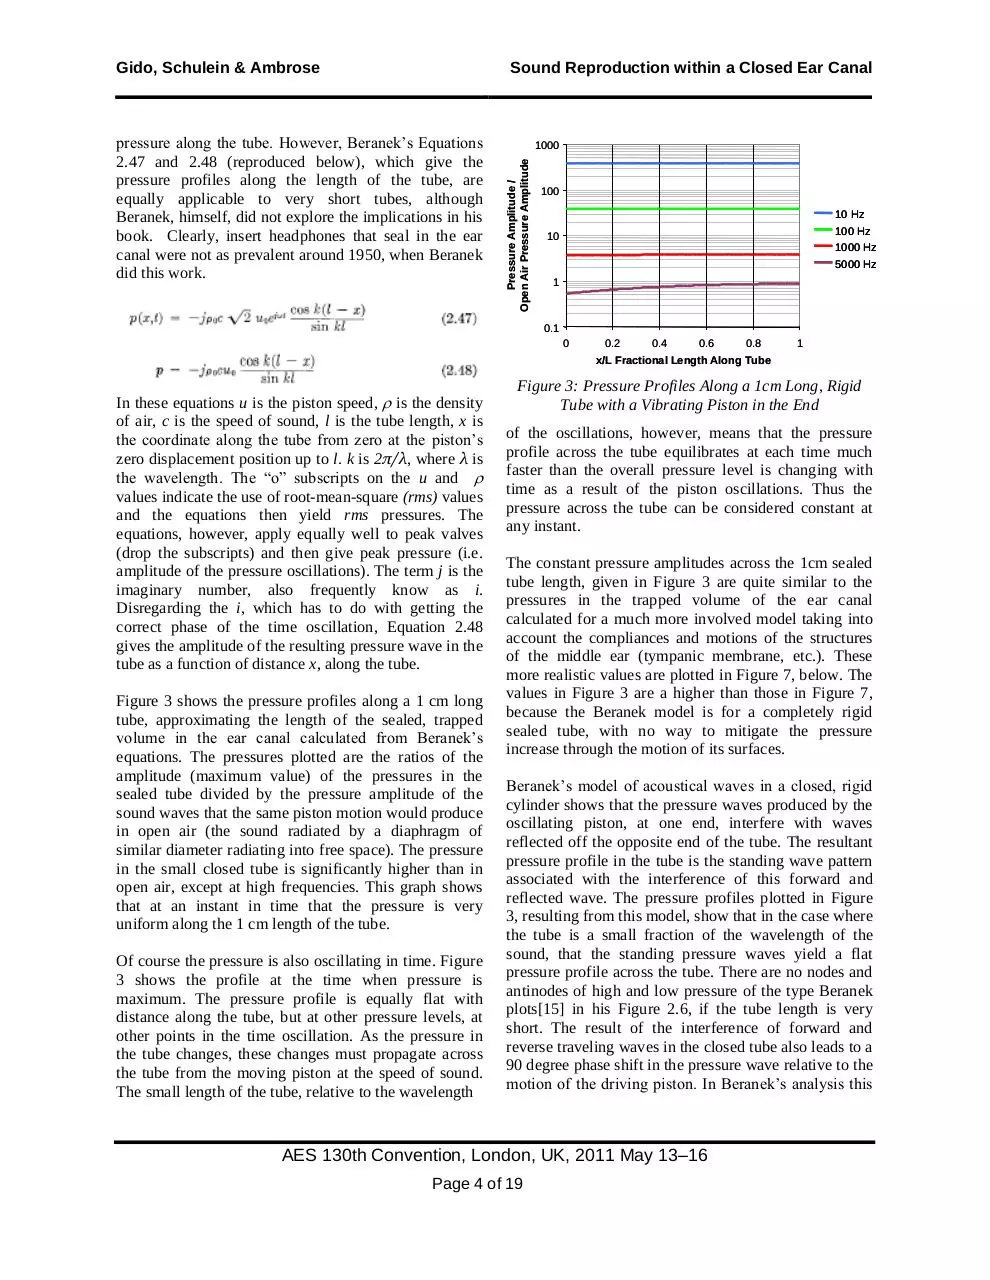
pressure along the tube. However, Beranek’s Equations
2.47 and 2.48 (reproduced below), which give the
pressure profiles along the length of the tube, are
equally applicable to very short tubes, although
Beranek, himself, did not explore the implications in his
book. Clearly, insert headphones that seal in the ear
canal were not as prevalent around 1950, when Beranek
did this work.
1000
Pressure Amplitude /
Open Air Pressure Amplitude
Gido, Schulein & Ambrose
100
10 Hz
100 Hz
1000 Hz
5000 Hz
10
1
0.1
0
0.2
0.4
0.6
0.8
1
x/L Fractional Length Along Tube
In these equations u is the piston speed, is the density
of air, c is the speed of sound, l is the tube length, x is
the coordinate along the tube from zero at the piston’s
zero displacement position up to l. k is 2π/λ, where λ is
the wavelength. The “o” subscripts on the u and
values indicate the use of root-mean-square (rms) values
and the equations then yield rms pressures. The
equations, however, apply equally well to peak valves
(drop the subscripts) and then give peak pressure (i.e.
amplitude of the pressure oscillations). The term j is the
imaginary number, also frequently know as i.
Disregarding the i, which has to do with getting the
correct phase of the time oscillation, Equation 2.48
gives the amplitude of the resulting pressure wave in the
tube as a function of distance x, along the tube.
Figure 3 shows the pressure profiles along a 1 cm long
tube, approximating the length of the sealed, trapped
volume in the ear canal calculated from Beranek’s
equations. The pressures plotted are the ratios of the
amplitude (maximum value) of the pressures in the
sealed tube divided by the pressure amplitude of the
sound waves that the same piston motion would produce
in open air (the sound radiated by a diaphragm of
similar diameter radiating into free space). The pressure
in the small closed tube is significantly higher than in
open air, except at high frequencies. This graph shows
that at an instant in time that the pressure is very
uniform along the 1 cm length of the tube.
Of course the pressure is also oscillating in time. Figure
3 shows the profile at the time when pressure is
maximum. The pressure profile is equally flat with
distance along the tube, but at other pressure levels, at
other points in the time oscillation. As the pressure in
the tube changes, these changes must propagate across
the tube from the moving piston at the speed of sound.
The small length of the tube, relative to the wavelength
Figure 3: Pressure Profiles Along a 1cm Long, Rigid
Tube with a Vibrating Piston in the End
of the oscillations, however, means that the pressure
profile across the tube equilibrates at each time much
faster than the overall pressure level is changing with
time as a result of the piston oscillations. Thus the
pressure across the tube can be considered constant at
any instant.
The constant pressure amplitudes across the 1cm sealed
tube length, given in Figure 3 are quite similar to the
pressures in the trapped volume of the ear canal
calculated for a much more involved model taking into
account the compliances and motions of the structures
of the middle ear (tympanic membrane, etc.). These
more realistic values are plotted in Figure 7, below. The
values in Figure 3 are a higher than those in Figure 7,
because the Beranek model is for a completely rigid
sealed tube, with no way to mitigate the pressure
increase through the motion of its surfaces.
Beranek’s model of acoustical waves in a closed, rigid
cylinder shows that the pressure waves produced by the
oscillating piston, at one end, interfere with waves
reflected off the opposite end of the tube. The resultant
pressure profile in the tube is the standing wave pattern
associated with the interference of this forward and
reflected wave. The pressure profiles plotted in Figure
3, resulting from this model, show that in the case where
the tube is a small fraction of the wavelength of the
sound, that the standing pressure waves yield a flat
pressure profile across the tube. There are no nodes and
antinodes of high and low pressure of the type Beranek
plots[15] in his Figure 2.6, if the tube length is very
short. The result of the interference of forward and
reverse traveling waves in the closed tube also leads to a
90 degree phase shift in the pressure wave relative to the
motion of the driving piston. In Beranek’s analysis this
AES 130th Convention, London, UK, 2011 May 13–16
Page 4 of 19
Gido, Schulein & Ambrose
Sound Reproduction within a Closed Ear Canal
phase shift is seen to be a result of the interference of a
forward and a reverse traveling acoustical wave.
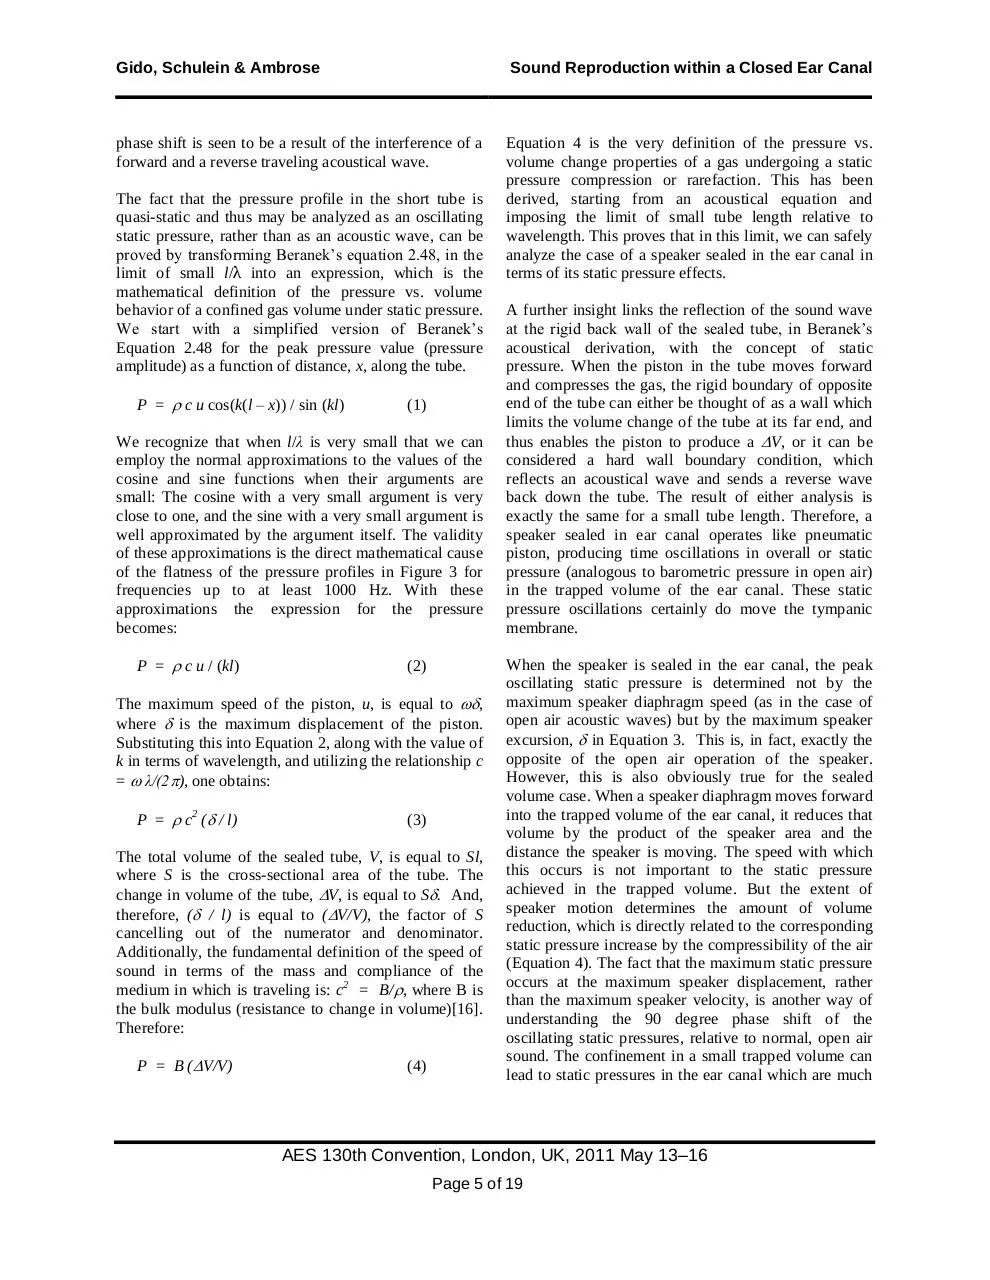
Equation 4 is the very definition of the pressure vs.
volume change properties of a gas undergoing a static
pressure compression or rarefaction. This has been
derived, starting from an acoustical equation and
imposing the limit of small tube length relative to
wavelength. This proves that in this limit, we can safely
analyze the case of a speaker sealed in the ear canal in
terms of its static pressure effects.
The fact that the pressure profile in the short tube is
quasi-static and thus may be analyzed as an oscillating
static pressure, rather than as an acoustic wave, can be
proved by transforming Beranek’s equation 2.48, in the
limit of small l/λ into an expression, which is the
mathematical definition of the pressure vs. volume
behavior of a confined gas volume under static pressure.
We start with a simplified version of Beranek’s
Equation 2.48 for the peak pressure value (pressure
amplitude) as a function of distance, x, along the tube.
P = c u cos(k(l – x)) / sin (kl)
(1)
We recognize that when l/λ is very small that we can
employ the normal approximations to the values of the
cosine and sine functions when their arguments are
small: The cosine with a very small argument is very
close to one, and the sine with a very small argument is
well approximated by the argument itself. The validity
of these approximations is the direct mathematical cause
of the flatness of the pressure profiles in Figure 3 for
frequencies up to at least 1000 Hz. With these
approximations the expression for the pressure
becomes:
P = c u / (kl)
(2)
The maximum speed of the piston, u, is equal to ,
where is the maximum displacement of the piston.
Substituting this into Equation 2, along with the value of
k in terms of wavelength, and utilizing the relationship c
= λ/(2), one obtains:
P = c2 ( / l)
(3)
The total volume of the sealed tube, V, is equal to Sl,
where S is the cross-sectional area of the tube. The
change in volume of the tube, V, is equal to S. And,
therefore, ( / l) is equal to (V/V), the factor of S
cancelling out of the numerator and denominator.
Additionally, the fundamental definition of the speed of
sound in terms of the mass and compliance of the
medium in which is traveling is: c2 = B/, where B is
the bulk modulus (resistance to change in volume)[16].
Therefore:
P = B (V/V)
(4)
A further insight links the reflection of the sound wave
at the rigid back wall of the sealed tube, in Beranek’s
acoustical derivation, with the concept of static
pressure. When the piston in the tube moves forward
and compresses the gas, the rigid boundary of opposite
end of the tube can either be thought of as a wall which
limits the volume change of the tube at its far end, and
thus enables the piston to produce a V, or it can be
considered a hard wall boundary condition, which
reflects an acoustical wave and sends a reverse wave
back down the tube. The result of either analysis is
exactly the same for a small tube length. Therefore, a
speaker sealed in ear canal operates like pneumatic
piston, producing time oscillations in overall or static
pressure (analogous to barometric pressure in open air)
in the trapped volume of the ear canal. These static
pressure oscillations certainly do move the tympanic
membrane.
When the speaker is sealed in the ear canal, the peak
oscillating static pressure is determined not by the
maximum speaker diaphragm speed (as in the case of
open air acoustic waves) but by the maximum speaker
excursion, in Equation 3. This is, in fact, exactly the
opposite of the open air operation of the speaker.
However, this is also obviously true for the sealed
volume case. When a speaker diaphragm moves forward
into the trapped volume of the ear canal, it reduces that
volume by the product of the speaker area and the
distance the speaker is moving. The speed with which
this occurs is not important to the static pressure
achieved in the trapped volume. But the extent of
speaker motion determines the amount of volume
reduction, which is directly related to the corresponding
static pressure increase by the compressibility of the air
(Equation 4). The fact that the maximum static pressure
occurs at the maximum speaker displacement, rather
than the maximum speaker velocity, is another way of
understanding the 90 degree phase shift of the
oscillating static pressures, relative to normal, open air
sound. The confinement in a small trapped volume can
lead to static pressures in the ear canal which are much
AES 130th Convention, London, UK, 2011 May 13–16
Page 5 of 19
Gido, Schulein & Ambrose
Sound Reproduction within a Closed Ear Canal
larger (up to hundreds of times larger) than the sound
pressures present in open air sound waves. This can
trigger the stapedius reflex, thereby reducing the
sensitivity of human hearing, and results in strong
motions of the tympanic membrane, which are also
much larger than those in normal open ear hearing.
associated with pressure equilibration, l, to the length
scale associated with pressure variation, λ, due to sound.
Exactly the same criterion can also be expressed as the
ratio of the time scale of pressure equilibration in the
trapped volume to the time of sound wave pressure
variation, or (l /c), where is the frequency.
An oscillating speaker sealed in the ear canal produces
large amplitude, static pressure waves associated with
the maximum displacement of speaker motion.
However, the acoustical science view of what is
happening, as embodied in Beranek’s analysis above,
indicates that acoustical pressure disturbances are
simultaneously being generated and are associated with
the maximum speed of the speaker diaphragm. It is the
interaction of the forward and reverse traveling
acoustical waves that generates the static pressure in the
small confined volume, and makes the overall
phenomenon appear to be related to speaker
displacement and to be 90 degrees out of phase with the
speaker velocity. Thus the phenomena occurring in a
small trapped volume, such as the ear canal, has a dual
character. The oscillating pressure effects in the sealed
ear canal are both acoustical waves and static pressure
oscillations at the same time. Which of these two
aspects of the phenomena is dominant, depends on the
conditions. For instance, smaller confined volumes and
lower frequencies (longer wavelengths) produce an
oscillating-static-pressure-like behavior, while larger
trapped volumes and higher frequencies yield an
acoustical-wave-like behavior.
It would be convenient to define a criteria or parameter
that governs whether or not sound waves in a particular
medium, at a particular frequency, can be interpreted as
an oscillating static pressure in a confined volume of a
specific size. The most rigorous test of static pressure
character is that the standing wave pressure profile
calculated from Beranek’s Equantion 2.48 (Eqn. 1) is
nearly constant at every location, x, along the length of
the trapped volume. This profile as calculated from the
Equations will never be mathematically, exactly
constant due to the nature of the mathematics employed.
However, the profile can be considered functionally
constant, when the calculated variations in the pressure
profile are smaller than what can be measured
experimentally, or alternatively are smaller than the
random and transient, natural thermal fluctuations in the
pressure that are always present in any system. This is
equivalent to the condition that kl is very small, which is
in turn equivalent to the condition that l/λ is very small.
The criterion is expressed as the ratio of the length scale
2.2.
Modeling a Speaker with a Trapped Ear
Canal Volume
2.2.1. Static Pressure Model
A model, shown schematically in Figure 4, was
analyzed to get an indication of the responses and the
trends associated with the static pressure effects of
sealing a speaker in the ear canal. This model consists
of a tube of length and diameter intended to
approximate the dimensions of the trapped volume in
the ear canal. It is taken to be 7 mm in diameter and the
length, L (the same parameter as l used in Beranek[15]),
can be varied to simulate different speaker insertion
depths resulting in different trapped volume sizes. Tube
lengths of 1.0 and 0.5 cm were used for illustrative
calculations.
L (Trapped Vol.)
D (Ear Canal)
D (Diaphragm)
D (Tympanic Mem.)
Middle Ear Vol.
Middle Ear Vol.
Diaphragm
Displacement
Tympanic Mem.
Displacement
Figure 4: Schematic of Model for Trapped Volume in
the Ear Canal
One end of the tube is covered by a flexible membrane,
which has an initial hemispherical dome shape, 2 mm
higher in the middle than around its edges. This
represents a speaker geometry, and it can be displaced
along the direction of the tube axis to simulate the
motion of the speaker diaphragm. During displacement,
the speaker remains attached to the tube around its
edges, and this attachment does not move. The speaker
displacements quoted in this study refer to the
AES 130th Convention, London, UK, 2011 May 13–16
Page 6 of 19
Gido, Schulein & Ambrose
Sound Reproduction within a Closed Ear Canal
displacements of the center of the dome speaker. During
such displacements the overall speaker shape is adjusted
to remain hemispherical while remaining attached at its
edges to the tube.
Wada, Kobayashi and co-workers[18,19] have done
extensive measurements and mechanical modeling of
different components of the human middle ear. They
show that excursions of the tympanic membrane involve
deformation not just of the tympanic membrane itself,
but also of the connection between the tympanic
membrane and the ear canal, and of the ossicular chain,
which connects the tympanic membrane to the cochlea.
They have determined mechanical moduli associated
with these other aspects of tympanic membrane
deformation, which are included in the model described
in this section.
The other end of the tube is covered by a membrane
with an elastic modulus equal to an average value
measured for human tympanic membranes: E (Young’s
Modulus) = 3 N/m2.[17-19]. The tympanic membrane is
not flat, but rather an asymmetric, shallow, conical
shape, although this aspect of the real tympanic
membrane shape has only a minor effect on the static
pressure calculations presented here. The tympanic
membrane is modeled with a thickness of 0.8 mm, an
average value for humans. Both the speaker diaphragm
and the tympanic membrane are assumed to have the
same diameter as the tube. The pressure inside the
sealed tube (ear canal) is initially atmospheric pressure.
On the other side of the tympanic membrane is another
volume, which simulates that of the middle ear. This
middle ear volume is also initially at atmospheric
pressure, and it has a volume of 1.5 cm3, an average
value for the human population.[20] The computational
model, illustrated in Figure 4, is very similar to an
actual physical model of the ear canal used in recently
reported experiments on the acoustics of insert
headphones.[21]
When the speaker diaphragm is displaced toward the
trapped volume, decreasing the volume, the model
system distributes the effect of this disturbance between
the pressurization of air in the sealed volume of the ear
canal and the displacement of the tympanic membrane.
The displacement of the tympanic membrane also
displaces and pressurizes air in the middle ear cavity.
The pressurization of the air in the ear canal and in the
middle ear volume is resisted by the compressibility
modulus of the air, which is derived from the Ideal Gas
Law. The Ideal Gas Law is an excellent representation
of the behavior of air at body temperature and near
atmospheric pressure, as the compressibility factor (Z)
is essentially equal to one [22]. The stretching of the
tympanic membrane, due to the pressure differential
between the sealed ear canal volume and the middle ear
volume, is resisted by the stretching modulus of the
tympanic membrane, and is modeled as in Reference
[23]. The actual vibrational modes and extensional
geometries of the tympanic membrane may be quite
complex.[24,25] They are simpler and more similar to
the simple hemispherical deformation model used here,
at lower frequencies.
Modeling of the static pressure effects with a speaker
sealed in the ear depends only on the net change in
trapped volume associated with the combined motions
of the speaker diaphragm and the tympanic membrane.
These changes depend on speaker and tympanic
membrane geometry, but not on the ear canal geometry,
since the morphology of the ear canal along the trapped
volume remains the same as the volume changes. The
other piece of information required to do the model
calculation is the resistance to deformation of the
tympanic membrane, including all the modes of
deformation and the resistance to deformation of
structures attached to the tympanic membrane that must
move with it.
Wada and Kobayashi [18,19] give an equivalent
(spring-like) modulus for the attachment of the
tympanic membrane (kw = 4000 N/m2) and for the
ossicular chain connection between the tympanic
membrane and the cochlea (ks = 700 N/m2). The model
is evaluated, for a given speaker displacement, by
setting the pressure difference between the trapped
volume in the ear canal and the pressure in the middle
ear volume equal to the pressure across the deformed
tympanic membrane. The deformation of the tympanic
membrane is modeled to including the biaxial
deformation of the tympanic membrane itself, the
deformation of the attachment of the tympanic
membrane and the motion of the attached ossicular
chain.
Calculations based on this model were performed for a
range of speaker displacements from 1 to 400 microns,
and for frequencies ranging from 10 Hz to 1000 Hz. The
resulting tympanic membrane displacements and
pressure increases in the closed, ear canal volume were
calculated. The pressure increase in the closed, ear canal
volume was compared to the sound pressure in open air
that the same speaker motion would generate. In order
AES 130th Convention, London, UK, 2011 May 13–16
Page 7 of 19
Gido, Schulein & Ambrose
Sound Reproduction within a Closed Ear Canal
Figure 6 shows that the percentage of speaker
displacement transferred to the tympanic membrane is
fairly uniform with speaker displacement and has a
value of about 40 to 45% for the smaller trapped volume
and 25 to 27% for the larger tapped volume. These are
very large transfers of speaker motion to the tympanic
membrane. Equivalent speaker motions in open air,
even very pronounced motions, peak or rms sound
pressures that are only a small fraction of atmospheric
pressure. The peak and rms values of the oscillating
static pressure in the trapped volume of a sealed ear
canal, are higher at all speaker displacements than the
open air values.
180.00
160.00
140.00
120.00
1 cm Trapped Vol.
100.00
0.5 cm Trapped Vol.
80.00
60.00
40.00
20.00
0.00
0
100
200
300
400
Speaker Displacement (microns)
Figure 5: Tympanic Membrane Displacement as a
Function of Speaker Displacement
Detailed Model: TM motion as % of Speaker Displacement
Tympanic Membrane Displacement
(% of Speaker Displacement)
Figure 5, shows total tympanic membrane displacement
vs. speaker displacement. The tympanic membrane
displacement is in the multiple micron range and goes
up with increasing speaker displacement. Figure 6
shows the same tympanic membrane displacement vs.
speaker displacement data as Figure 5 except that the
tympanic membrane displacement is shown as a
percentage relative to the driving speaker displacement.
Note that there is no frequency dependence of the
tympanic membrane displacement, in these results,
since the displacement depends on static pressure,
which is related to speaker displacement, not to speaker
velocity. This will be shown, below to be a good
estimate for relatively low frequencies, specifically
those below about 100 Hz. Speaker displacements in the
micron range produce static-pressure-driven, tympanic
membrane excursions that are also in the micron range,
these are 100 to 1000 time the normal tympanic
membrane excursion amplitudes, which are tens to
hundreds of nanometers.[25] The tympanic membrane
displacements are significantly larger for the smaller
trapped volume (L = 0.5 cm) than for the larger trapped
volume (L = 1.0 cm). This is because the same speaker
displacement, giving the same volume change, V,
relative to a smaller trapped volume, V/V, produces a
greater fractional (or percentage) change in volume,
V/V, and this produces a greater pressure increase via
Equation 4.
50.00%
45.00%
40.00%
35.00%
30.00%
25.00%
1.0 cm Trapped Vol.
20.00%
0.5 cm Trapped Vol.
15.00%
10.00%
5.00%
0.00%
0
100
200
300
400
Speaker Displacement (microns)
Figure 6: Tympanic Membrane Displacement Relative
to Speaker Displacement, Expressed as a Percentage
Sealed Vol. Pressure / Open Air Sound Pressure
1,000.000
Sealed Vol. P / Open Air P
to perform the open air calculation, the speaker
displacement and frequency were used to calculate the
maximum diaphragm velocity assuming sinusoidal
diaphragm displacement vs. time. Under these
conditions the maximum diaphragm velocity is ω,
where ω is the angular frequency equal to 2π time the
frequency, and is the amplitude of speaker
displacement.
Tympanic Membrane Displacement (microns)
Detailed Model: TM displacment (microns) vs. Speaker
Displacement (microns)
10 Hz
100 Hz
100.000
1000 Hz
Max. 10 Hz
Max 100 Hz
10.000
Max 1000 Hz
1.000
0
100
200
300
Speaker Displacement (microns)
400
Figure 7: SPL in Sealed Volume Relative to Open Air
AES 130th Convention, London, UK, 2011 May 13–16
Page 8 of 19
Gido, Schulein & Ambrose
Sound Reproduction within a Closed Ear Canal
In Figure 7 the ratio of the sealed ear canal oscillating
static pressure (peak or rms value) to the corresponding
sound pressure (peak or rms value) that the same
speaker would radiate in open air (measured directly in
front of the diaphragm) is plotted vs. speaker
displacement. The sealed volume oscillating static
pressure is higher than the open air peak sound pressure
across the entire range of speaker displacements. The
maximum pressures that would occur if the tympanic
membrane could not move are also plotted in this figure.
These are equivalent to Figure 3 for Beranek’s sealed,
fully rigid tube. These values are always larger than the
actual pressures generated in the ear canal. However the
maximum pressures (Beranek model) in Figure 7 are
important reference values because they indicate the full
magnitude of the static pressure driving force that is
displacing the tympanic membrane. This pressure is not
realized, however, because the tympanic membrane is
already moving and relieving some of this static
pressure before the speaker reaches its full
displacement.
frequency dependence to the oscillating static pressure
in the trapped volume.
All the modeling in this section was couched in terms of
positive excursions of the speaker and tympanic
membrane that raise pressure in the trapped volume,
above the normal, unperturbed air pressure in the ear
canal. The converse analysis (in terms of negative
excursions of the speaker and the tympanic membrane
that lower the pressure in the trapped volume) yield
similar results in terms of negative displacement of the
tympanic membrane.
2.2.2. Oscillating Static Pressure Interacting
with the Dynamics of the Middle Ear
Even though the pressure in the ear canal resulting from
a sealed speaker in the ear is essentially uniform at any
given instant, it is oscillating rapidly, and this has the
potential to produce dynamic effects. In particular, the
tympanic membrane and the structures attached to it
have mass and inertia and therefore take a finite amount
of time to respond to the pressure exerted on them, by
the oscillating speaker diaphragm. This results in a
phase lag between the driving speaker oscillation and
the responding tympanic membrane oscillation.
Additionally, the real structures of the tympanic
membrane, the ossicular chain and the cochlea dissipate
energy as they move (i.e. there is a small friction-like
resistance to their motion). This damps the vibrational
response of the tympanic membrane. The presence of
these factors suggests that one should expect a
As discussed by Wada, Kobayashi and co-workers
[18,19,26,27] the displacement of the tympanic
membrane can be modeled with the following equation
of motion:
m (d2/dt2) + (d/dt) + k = S P sin t
(5)
Here m is the mass of the tympanic membrane and other
structures to which it is attached and which must move
with it. The damping parameter includes the damping
influences of the tympanic membrane as well as the
structures attached to it. The spring constant, k, includes
the spring like resistance to displacement of the
tympanic membrane and the structures attached to it.
The displacement of the tympanic membrane at any
given time, t, is given by the parameter . The first term
on the left-hand-side of this equation represents
Newton’s law that force is equal to mass times
acceleration. The second term adds the influence of
damping or resistance, which is proportional to velocity.
There is more resistance the faster one tries to move the
tympanic membrane. The final term on the left-hand
side gives the restoring, spring like, force associated
with the elasticity of the
motion the tympanic
membrane and associated structures.
This equation has the form of forced mechanical
vibrations with damping. The forcing function is
provided by the oscillation of the speaker diaphragm, as
transmitted to the tympanic membrane through the air in
the trapped volume. This driving function (right-handside of Equation 5) is represented by a sine wave with
angular frequency, , and an amplitude given by the
product of S, the area of the tympanic membrane, and P,
the pressure which drives the motion. The driving
pressure is the maximum pressure that would be
generated if the tympanic membrane were not able to
move, equivalent to the Beranek sealed-tube model.
This represents the total pressure driving force available
to cause the motion of the tympanic membrane as
governed by Equation 5.
Various literature references[17-19,25-29] provide
information on the masses, damping characteristics, and
spring constants of the tympanic membrane and all the
various structures to which it is connected. These values
were the results of measurements on live subjects and
on cadavers, as well as detailed finite element, computer
AES 130th Convention, London, UK, 2011 May 13–16
Page 9 of 19
Download Asius AES Paper
Asius_AES Paper.pdf (PDF, 803.27 KB)
Download PDF
Share this file on social networks
Link to this page
Permanent link
Use the permanent link to the download page to share your document on Facebook, Twitter, LinkedIn, or directly with a contact by e-Mail, Messenger, Whatsapp, Line..
Short link
Use the short link to share your document on Twitter or by text message (SMS)
HTML Code
Copy the following HTML code to share your document on a Website or Blog
QR Code to this page

This file has been shared publicly by a user of PDF Archive.
Document ID: 0000355420.