doc8 (PDF)
File information
This PDF 1.3 document has been generated by , and has been sent on pdf-archive.com on 03/05/2016 at 16:18, from IP address 178.10.x.x.
The current document download page has been viewed 883 times.
File size: 77.95 KB (9 pages).
Privacy: public file


File preview
RESTREINT EU/EU RESTRICTED
EUROPEAN COMMISSION
Directorate-General for Trade
Directorate F – WTO, Legal Affairs and Trade in Goods
Tariff and Non-Tariff Negotiations, Rules of Origin
Brussels, 20 November 2015
TRADE/CH
Subject: EU – US revised tariff offers, October 2015.
Background
The EU and the US exchanged revised1 tariff offers on 15 October, 2015, in which both parties
increased the number of tariff lines offered for duty elimination to 97%. Within the 97%, a new
staging category called “T” was introduced for 2% of tariff lines with staging modalities to be
agreed during the course of negotiations.
In addition to the 97% and 2% “T” benchmarks, the EU also sought to address imbalances in the
front-loading of duty elimination. The US gave however no assurances on front-loading. The EU
therefore took precautionary measures by back-loading a number of tariff lines from entry into force
to its 7-year category. The EU stated however that it was ready to reverse the backtracking on a
reciprocal basis.
In the end, the US offer included, despite reluctance to agree on a front-loading benchmark, a large
improvement on front-loading. Compared to its initial offer, the US offered an improvement of 13.1
percentage points at entry into force (87.5% vs 74.4% in the initial offer), close to the initial offer of
89.6%.
The EU therefore reversed most of its backtracking during the 11th negotiation round and matched
the US offer of 87.5% entry into force coverage. This has had the very positive effect of creating
numeric balance between the US and EU offers in the entry into force, T and OT/U categories, and
will facilitate subsequent tariff negotiations.
1. Summary
The two tariff offers are now globally balanced in terms of tariff line coverage, with an ambitious
entry into force and overall high duty elimination coverage. The situation is thus more stable and
equally ambitious from several perspectives. Total trade value coverage is however still unbalanced
1
1
Initial tariff offers were exchanged on 10 February, 2014.
RESTREINT EU/EU RESTRICTED
and will remain so until the US commits to tariff elimination for motor vehicles. The US has
signaled on a number of occasions that it will offer full duty elimination for automobile tariff lines.
However it has also underlined that for them it's an endgame issue. So while balance of concession
measured on trade value will be achieved in the end, balance cannot be a useful benchmark of
achievement during negotiations leading up to the endgame.
When adjusting for the motor vehicles on both sides, the offers appear however much more
balanced, also in value terms. Full liberalization is offered on 99.3% of US exports to the EU and
98% on EU exports to the US in absence of motor vehicles.
The outcome for other product sectors (such as EU defensiveness on energy-intensive chemicals)
may counter the trade value imbalance but only to a small extent, by one or two percentage points.
Other products such as textiles might however be fully balanced, with potentially all trade receiving
duty free treatment at entry into force. The US is also likely to stage a number of glass and ceramic
lines at extended staging, together with footwear and some mechanical products such as ball
bearings and motor vehicle parts. As regards agricultural products, the main sensitive issues in the
EU offer concern bovine meat, rice and sugar, while the US will maintain wine, sugar and cheese as
leverage.
2. Global comparison
2.1 Comparison of tariff line coverage
Both offers are now comparable in terms of ambition on tariff line coverage, with 97% of tariff lines
offered duty elimination. Both offers have 87.5% of tariff lines in the immediate duty elimination
basket (EIF). The EU offer at year 3 is at 3.7% some 1.7 percentage points higher than the US offer.
Consequently, the EU offer in the 7-year category is 1.7 percentage points lower than the US.
Table 1. Comparison of tariff line coverage
All sectors
Modality
Tariff lines
EU
US
Difference
Liberalized
97.0%
97.0%
0.0 pp
EIF
87.5%
87.5%
0.0 pp
- of which MFN zero
25.0%
36.1%
-11.2 pp
- of which additional EIF
62.6%
51.3%
11.2 pp
Y3
3.7%
2.0%
1.7 pp
Y7
3.8%
5.5%
-1.7 pp
T basket
2.0%
2.0%
0.0 pp
Not fully liberalized
3.0%
3.0%
0.0 pp
OT/U
3.0%
3.0%
0.0 pp
2
RESTREINT EU/EU RESTRICTED
2.2. Comparison of trade value coverage
In terms of value coverage, the offers are however still unbalanced. The EU liberalizes 10
percentage points more trade in total and 14 percentage points more at entry into force. This is due
to the high concentration of EU exports of passenger cars. In total, some 8.9% of total EU exports
are located in 10 US tariff lines (of which 2 lines alone account for 8.5%) for which the US has not
yet offered a concession. This has of course a large impact when comparing the two offers, as the
US has indicated that these tariff lines are only up for discussion in the so-called endgame, which
therefore will leave the current imbalance in place until the endgame.
Table 2. Comparison of value coverage
All sectors
Modality
Trade value (2010-2012)
EU
US
Difference
Liberalized
99.3%
89.2%
10.1 pp
EIF
91.7%
77.7%
-14.0 pp
- of which MFN zero
66.6%
53.4%
13.2 pp
- of which additional EIF
25.0%
24.3%
0.8 pp
Y3
3.3%
5.7%
-2.5 pp
Y7
2.5%
3.4%
-0.9 pp
T basket
1.8%
2.3%
-0.5 pp
Not fully liberalized
0.7%
10.8%
-10.1 pp
OT/U
0.7%
10.8%
-10.1 pp
2.3 Comparison on value coverage when adjusted for motor vehicles
When adjusting for car, bus and truck trade on both sides (i.e. removing them from total trade and
respective staging categories), the offers appear much more balanced. Full liberalization is offered
on 99.3% of US exports to the EU and 98% on EU exports to the US.
EU entry into force value coverage is however considerably higher even in this scenario, by 6.8
percentage points. Consequently, the EU offer keeps less trade in the remaining staging categories
compared to the US offer.
Table 3. Comparison of value coverage excluding cars and trucks
All sectors minus cars &
trucks
Modality
Trade value (2010-2012)
EU
US
Difference
Liberalized
99.3%
98.0%
1.3 pp
EIF
92.2%
85.3%
6.8 pp
- of which MFN zero
67.0%
58.7%
8.3 pp
3
RESTREINT EU/EU RESTRICTED
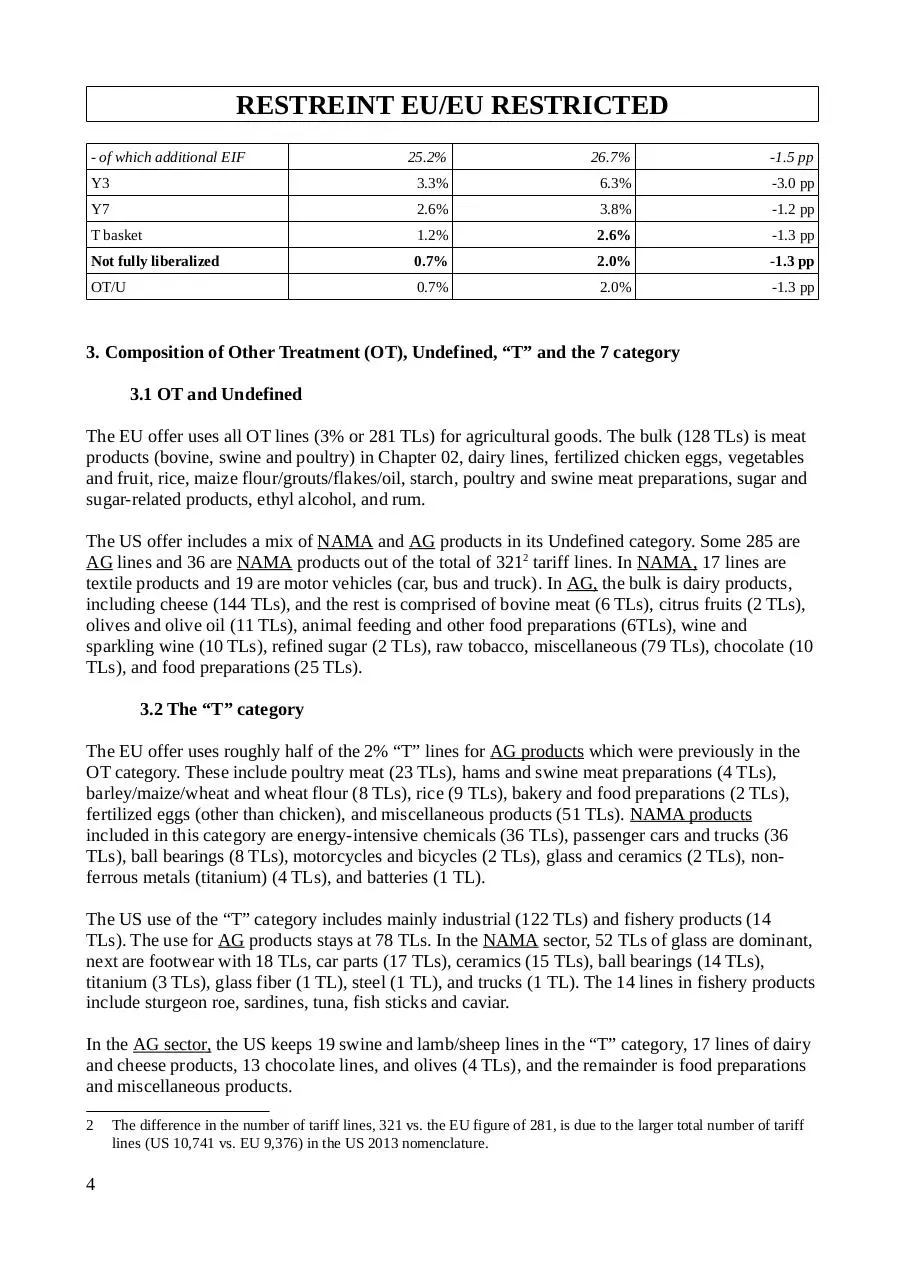
- of which additional EIF
25.2%
26.7%
-1.5 pp
Y3
3.3%
6.3%
-3.0 pp
Y7
2.6%
3.8%
-1.2 pp
T basket
1.2%
2.6%
-1.3 pp
Not fully liberalized
0.7%
2.0%
-1.3 pp
OT/U
0.7%
2.0%
-1.3 pp
3. Composition of Other Treatment (OT), Undefined, “T” and the 7 category
3.1 OT and Undefined
The EU offer uses all OT lines (3% or 281 TLs) for agricultural goods. The bulk (128 TLs) is meat
products (bovine, swine and poultry) in Chapter 02, dairy lines, fertilized chicken eggs, vegetables
and fruit, rice, maize flour/grouts/flakes/oil, starch, poultry and swine meat preparations, sugar and
sugar-related products, ethyl alcohol, and rum.
The US offer includes a mix of NAMA and AG products in its Undefined category. Some 285 are
AG lines and 36 are NAMA products out of the total of 3212 tariff lines. In NAMA, 17 lines are
textile products and 19 are motor vehicles (car, bus and truck). In AG, the bulk is dairy products,
including cheese (144 TLs), and the rest is comprised of bovine meat (6 TLs), citrus fruits (2 TLs),
olives and olive oil (11 TLs), animal feeding and other food preparations (6TLs), wine and
sparkling wine (10 TLs), refined sugar (2 TLs), raw tobacco, miscellaneous (79 TLs), chocolate (10
TLs), and food preparations (25 TLs).
3.2 The “T” category
The EU offer uses roughly half of the 2% “T” lines for AG products which were previously in the
OT category. These include poultry meat (23 TLs), hams and swine meat preparations (4 TLs),
barley/maize/wheat and wheat flour (8 TLs), rice (9 TLs), bakery and food preparations (2 TLs),
fertilized eggs (other than chicken), and miscellaneous products (51 TLs). NAMA products
included in this category are energy-intensive chemicals (36 TLs), passenger cars and trucks (36
TLs), ball bearings (8 TLs), motorcycles and bicycles (2 TLs), glass and ceramics (2 TLs), nonferrous metals (titanium) (4 TLs), and batteries (1 TL).
The US use of the “T” category includes mainly industrial (122 TLs) and fishery products (14
TLs). The use for AG products stays at 78 TLs. In the NAMA sector, 52 TLs of glass are dominant,
next are footwear with 18 TLs, car parts (17 TLs), ceramics (15 TLs), ball bearings (14 TLs),
titanium (3 TLs), glass fiber (1 TL), steel (1 TL), and trucks (1 TL). The 14 lines in fishery products
include sturgeon roe, sardines, tuna, fish sticks and caviar.
In the AG sector, the US keeps 19 swine and lamb/sheep lines in the “T” category, 17 lines of dairy
and cheese products, 13 chocolate lines, and olives (4 TLs), and the remainder is food preparations
and miscellaneous products.
2
4
The difference in the number of tariff lines, 321 vs. the EU figure of 281, is due to the larger total number of tariff
lines (US 10,741 vs. EU 9,376) in the US 2013 nomenclature.
RESTREINT EU/EU RESTRICTED
3.3 The 7-year category
The US offer contains 5.5% tariff lines, while the EU offers 3.8%. The number of lines are too
numerous (the EU with 353 and the US with 589) to provide a detailed readout. However, the most
important lines in each offer include the following:
The EU offer uses 43 lines for engines, 24 lines for aluminum, 34 lines for consumer electronics, 34
lines for textiles, 12 bus and truck lines, and 12 wood lines. Four lines are fishery products (caviar
and shrimps). Some 175 tariff lines are AG lines with miscellaneous products (live cattle, goat
meat, milk and cream, nuts, fruit jam and fruit juice, animal feeding and glues).
The US offer contains 49 lines of car parts, 27 textile lines, 14 steel lines, 13 jewelery lines, 3
chemicals, 5 leather articles, 4 glass, 4 ceramics, 10 footwear, and 2 aluminum , to name the
economically largest groups.
4. Conditionalities
Both sides maintained their respective initial conditionalities linked to the tariff offers. The EU
added two new conditionalities. One is for car tariff lines, for which it only committed to discuss
these when the US is ready to offer duty elimination on its car tariff lines. The second new
conditionality is a link to animal welfare for egg-laying hens on a few egg tariff lines (other poultry
than chicken). A more general language on EU expectations of an “economically meaningful”
procurement offer by the US in February 2016 is also added. The full set of conditionalities is
annexed (Annex 1) in a comparative table.
5. Comparison of main sectors
The EU defines its three main sectors as follows: Agricultural (basic and processed), Fishery, and
Industrial. The US defines its negotiation clusters, except for agricultural goods, somewhat
differently. The US industrial sector definition includes fishery but excludes textiles, which has a
slightly broader scope of products the EU would consider industrial products (e.g. suitcases, bags
and the like with textile outers, plastic with man-made fiber, a few footwear products, hats, glass
fiber, diapers, and other products with a component of textile materials).
5.1 Industrial goods (EU definition)
Tariff line comparison shows a balanced situation with full duty elimination in the sector, with the
US exception of 19 car, bus and truck tariff lines and 17 textile tariff lines, which are placed in the
US Undefined category. The US offers some 2.7 percentage points more at entry into force while
the EU keeps 2.4 percentage points more in the 3-year category. The remaining differences are less
than a percentage point in the other categories.
5
RESTREINT EU/EU RESTRICTED
Table 4. Comparison of the industrial goods sector in tariff lines
Industrial
Tariff lines
Modality
EU
Liberalized
US
Difference
100.0%
99.6%
0.4 pp
92.6%
95.4%
-2.7 pp
- of which MFN zero
28.1%
38.0%
-9.9 pp
- of which additional EIF
64.5%
57.3%
7.2 pp
Y3
3.5%
1.1%
2.4 pp
Y7
2.6%
1.7%
0.9 pp
T basket
1.3%
1.4%
-0.1 pp
Not fully liberalized
0.0%
0.4%
-0.4 pp
OT/U
0.0%
0.4%
-0.4 pp
EIF
Value coverage is however unbalanced, as explained above, as car tariff lines have a large impact
with close to a 10 percentage-point difference. The EU offer at entry into force is also substantially
better, with close to 14 percentage points more trade liberalized. The bulk of this difference,
excluding cars, is located in the 3-year category.
Table 5. Comparison of the industrial goods sector in value
Industrial
Modality
Liberalized
Trade value (2010-2012)
EU
US
Difference
100.0%
90.2%
9.8 pp
92.8%
79.0%
13.8 pp
- of which MFN zero
68.3%
53.5%
14.8 pp
- of which additional EIF
24.6%
25.5%
-0.9 pp
Y3
3.3%
6.0%
-2.7 pp
Y7
2.0%
3.1%
-1.1 pp
T basket
1.8%
2.1%
-0.2 pp
Not fully liberalized
0.0%
9.8%
-9.8 pp
OT/U
0.0%
9.8%
-9.8%
EIF
5.2. Agricultural goods
Tariff line comparison shows that the EU offers slightly more (1.5 pp) tariff lines but substantially
more at entry into force (16.5 pp). Both parties keep roughly the same share of tariff lines in the
OT / Undefined categories. The US focus in its Undefined category is on dairy, food preparations,
and wine, while the EU keeps mostly meats and rice in its Other Treatment category. The “T” and
3-year category is also roughly the same in both offers. However, the US offer is heavily back6
RESTREINT EU/EU RESTRICTED
loaded with 14.4 percentage points more tariff lines in the 7-year category. The US AG tariff lines
in the 7-year category include rather limited trade due to prohibitive duties, NTBs or SPS measures.
In this group there are poultry (24 TLs), dairy (25 TLs), fruits and vegetables (88 TLs), wheat and
rice (4 TLs), peanuts (7 TLs), oils from various seeds (17 TLs), sugar-related products (25 TLs),
chocolate (38 TLs), food preparations, tobacco, wool and cotton.
Table 6. Comparison of the agricultural goods sector in tariff lines
Agricultural
Modality
Tariff lines
EU
US
Difference
Liberalized
86.4%
85.0%
1.5 pp
EIF
68.1%
51.7%
16.5 pp
- of which MFN zero
18.6%
20.8%
-2.2 pp
- of which additional EIF
49.6%
30.9%
18.7 pp
Y3
5.0%
6.3%
-1.3 pp
Y7
8.5%
22.9%
-14.4 pp
T basket
4.8%
4.1%
0.7 pp
Not fully liberalized
13.6%
15.0%
-1.5 pp
OT/U
13.6%
15.0%
-1.5 pp
A comparison of trade value is, for the above reasons (prohibitive duties, NTBs or SPS measures),
not an indiction of real economic interests. However, having said that, the EU offer is, on what is
actually traded, despite NTBs, SPS and prohibitive duties, still substantially better, with 12
percentage points more trade liberalized. The main culprit in the US Undefined category is wine,
which accounts for 58% of all trade in the Undefined category. Other products affected are olive oil
(14% of the “U” category) and dairy products (12% of the “U” category).
Table 7. Comparison of the agricultural goods sector in value
Agricultural
Modality
Trade value (2010-2012)
EU
US
Difference
Liberalized
85.2%
73.3%
11.9 pp
EIF
70.4%
57.8%
12.6 pp
- of which MFN zero
40.6%
51.1%
-10.5%
- of which additional EIF
29.8%
6.7%
23.2 pp
Y3
0.2%
1.6%
-1.3 pp
Y7
13.8%
7.7%
6.2 pp
0.7%
6.3%
-5.6 pp
Not fully liberalized
14.8%
26.7%
-11.9 pp
OT/U
14.8%
26.7%
-11.9 pp
T basket
7
RESTREINT EU/EU RESTRICTED
5.3 Fish and fishery goods
Both offers provide full duty elimination for the sector. However, the US offer keeps some 4.4% of
fishery tariff lines in the “T” category and close to 4% in the 7-year category. The EU keeps no
lines in the OT or “T” basket. The EU offer at EIF is also better, despite the rather large share of US
MFN zero rates (75% of tariff lines are already duty-free). Further improvements need to come
from the US side in order to restore some balance of concessions.
Table 8. Comparison of the fishery goods sector in tariff lines
Fishery
Tariff lines
Modality
EU
Liberalized
US
Difference
100.0%
100.0%
0.0 pp
98.0%
90.3%
7.6 pp
8.1%
75.2%
-67.1 pp
89.9%
15.1%
74.8 pp
Y3
1.2%
1.5%
-0.3 pp
Y7
0.8%
3.9%
-3.1 pp
T basket
0.0%
4.2%
-4.2 pp
Not fully liberalized
0.0%
0.0%
0.0 pp
OT/U
0.0%
0.0%
0.0 pp
EIF
- of which MFN zero
- of which additional EIF
Trade value coverage shows a similar picture, with high shares of already duty-free trade in the US
offer and a substantially better effort (despite a lower EIF rate) made by the EU at entry into force
as it has more trade subject to positive MFN duties. Main back-loaded lines in the US offer include
sturgeon roe, tuna, sardines, caviar, fish sticks, crabmeat, swordfish and salmon. The EU backloaded lines include caviar and shrimps.
Table 9. Comparison of the fishery goods sector in value
Fishery
Modality
Liberalized
Trade value (2010-2012)
EU
US
Difference
100.0%
100.0%
0.0 pp
74.2%
85.5%
-11.3 pp
5.3%
81.5%
-76.2 pp
68.9%
4.0%
64.9 pp
Y3
21.9%
2.5%
19.4 pp
Y7
3.9%
9.8%
-5.9 pp
T basket
0.0%
2.1%
-2.1 pp
Not fully liberalized
0.0%
0.0%
0.0 pp
0.0 pp OT/U
0.0%
0.0%
0.0 pp
EIF
- of which MFN zero
- of which additional EIF
8
RESTREINT EU/EU RESTRICTED
Annex 1. Head notes and conditionalities in the respective revised tariff offers.
9
Download doc8
doc8.pdf (PDF, 77.95 KB)
Download PDF
Share this file on social networks
Link to this page
Permanent link
Use the permanent link to the download page to share your document on Facebook, Twitter, LinkedIn, or directly with a contact by e-Mail, Messenger, Whatsapp, Line..
Short link
Use the short link to share your document on Twitter or by text message (SMS)
HTML Code
Copy the following HTML code to share your document on a Website or Blog
QR Code to this page

This file has been shared publicly by a user of PDF Archive.
Document ID: 0000368277.