PPD 360 Final Report Draft 3 WO Name (PDF)
File information
Author: Griffin Kantz
This PDF 1.5 document has been generated by Microsoft® Office Word 2007, and has been sent on pdf-archive.com on 10/05/2016 at 20:47, from IP address 76.91.x.x.
The current document download page has been viewed 615 times.
File size: 546.56 KB (27 pages).
Privacy: public file


File preview
Report
Alternatives Analysis:
California High-Speed Rail and Hyperloop
XXXXXXX
XXXXXXXX
XXXXXXXXXXXXXXXXXXXXXXX
18 December 2015
XXXXX 2
Cover images credits: Anil Verma Associates, Inc. (top); Claus Lunau (bottom)
Executive Summary
This report is an attempt to analyze the plausibilities and realities of the California High-Speed
Rail Project and the ‘Hyperloop’ project between Southern California and the Bay Area. Extreme
care has been given to present unbiased, albeit judicious, critique along dimensions considered
standard in the field of regional transportation planning. The five evaluative criteria used in this
report are:
(1) Mobility
(2) Accessibility
(4) Budget Impact
(5) Planning Impact
(3) Safety
not necessarily ranked in that order, as will be explained. Accordingly, these five criteria form
the analytical sections of this report. Readers with cursory background knowledge about the
California High-Speed Rail Project and the Hyperloop design plan are likely acutely aware of
how differently they perform in some of these criteria—such as budget, for example. But,
transportation projects are rarely chosen based on just one or two quality measurements. This
report seeks to assess the complex tradeoffs between the two alternatives by comparing them on
a level playing field.1 The chart on page 3 summarizes this report’s findings.
For particulars about the California High Speed Rail Project (CHSRP) in this report the
author has made use of California High Speed Rail Authority (CHSRA)’s own published
information on route location, station location, operational speed, operational frequency, etc.
However, there are not as many equivalent details in the public domain about Hyperloop
XXXXX 3
alternatives. In order to make direct comparisons between the HSR project and the Hyperloop
project in this report, the author has consulted the “Hyperloop Alpha” white paper released by
Elon Musk and Tesla Motors in August 2013.2 Musk and Tesla Motors have since distanced
themselves from direct management of the Hyperloop project, instead entrusting it to other
locally-based companies including Hyperloop Transportation Technologies and Hyperloop Tech
both based in Los Angeles, but we can safely assume that the design efforts of these independent
firms will strive for the logistical and spatial goals established by “Hyperloop Alpha.”
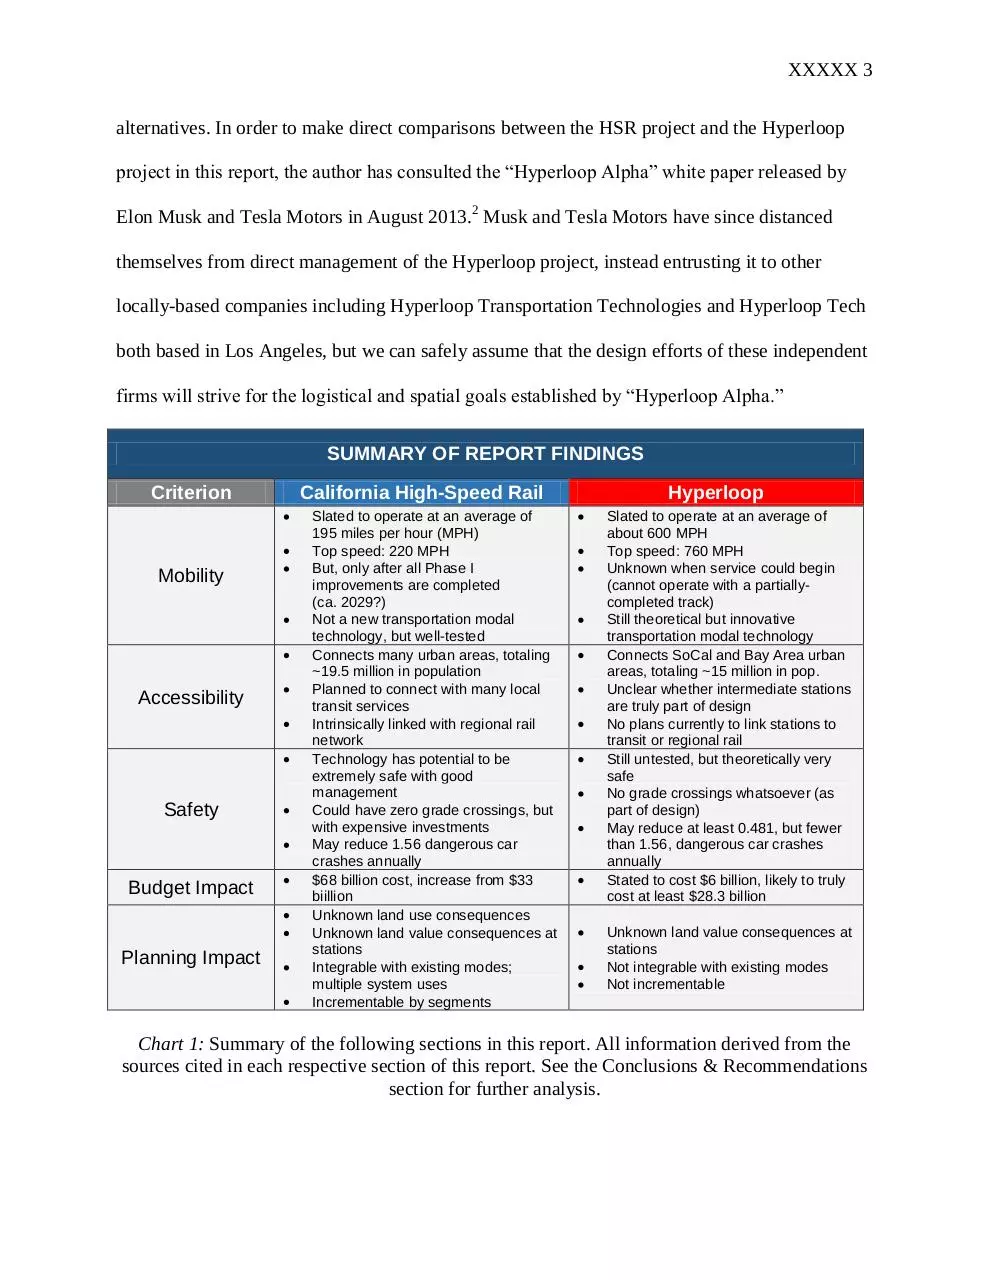
SUMMARY OF REPORT FINDINGS
Criterion
Mobility
Accessibility
Safety
Budget Impact
Planning Impact
California High-Speed Rail
Slated to operate at an average of
195 miles per hour (MPH)
Top speed: 220 MPH
But, only after all Phase I
improvements are completed
(ca. 2029?)
Not a new transportation modal
technology, but well-tested
Connects many urban areas, totaling
~19.5 million in population
Planned to connect with many local
transit services
Intrinsically linked with regional rail
network
Technology has potential to be
extremely safe with good
management
Could have zero grade crossings, but
with expensive investments
May reduce 1.56 dangerous car
crashes annually
$68 billion cost, increase from $33
biillion
Unknown land use consequences
Unknown land value consequences at
stations
Integrable with existing modes;
multiple system uses
Incrementable by segments
Hyperloop
Slated to operate at an average of
about 600 MPH
Top speed: 760 MPH
Unknown when service could begin
(cannot operate with a partiallycompleted track)
Still theoretical but innovative
transportation modal technology
Connects SoCal and Bay Area urban
areas, totaling ~15 million in pop.
Unclear whether intermediate stations
are truly part of design
No plans currently to link stations to
transit or regional rail
Still untested, but theoretically very
safe
No grade crossings whatsoever (as
part of design)
May reduce at least 0.481, but fewer
than 1.56, dangerous car crashes
annually
Stated to cost $6 billion, likely to truly
cost at least $28.3 billion
Unknown land value consequences at
stations
Not integrable with existing modes
Not incrementable
Chart 1: Summary of the following sections in this report. All information derived from the
sources cited in each respective section of this report. See the Conclusions & Recommendations
section for further analysis.
XXXXX 4
Introduction
The linear distance between Los Angeles and San Francisco is 347 miles, and their shortest
distance by road is 382 miles. 115 passenger flights, 37,890 cars and buses, and 10 passenger
trains traverse the distance between Southern California and the Bay Area daily.3 4 5 By 2030, the
interregional transportation corridors of California are projected to carry 65% more travel
demand (a total of 2.50 million trips daily).6
It is abundantly clear that to handle growth in regional trips, regional transportation
capacity in California needs to increase. State policymakers should design ways of increasing
efficient and rapid interregional transportation capacity, or otherwise they shall have to identify
ways of reducing demand growth or ways to mitigate bottleneck costs (neither of these two latter
options are wise planning decisions).
But, capacity expansion within the modes Californians traditionally use will be
tremendously expensive. LAX airport is expected to reach its documented capacity threshold of
78.9 million passengers per year by the mid-2020s, and new runways will be needed at both
LAX and SFO if new modes of transportation do not at least partially absorb the projected
demand growth.7 Travel on interstate highways in California is increasing at a rate five times the
rate of highway capacity expansion.8 The California Transportation Commission estimated in
2011 with its Statewide Needs Assessment Report that $183 billion in infrastructural
improvements, including $79 billion for highways and $5 billion for airports, would be needed to
meet the state’s projected travel demand in 2020; the American Society of Civil Engineers
estimated that California needs to spend $365 billion more than currently budgeted over the next
10 years to meet demand.9 A multi-billion-dollar solution is needed, that much is clear. But,
California has the unique opportunity to venture into more efficient, more foreign, and more
XXXXX 5
futuristic modes of transportation to meet this looming demand surge.
In 2008, California voters passed Proposition 1A, a statewide referendum delegating tax
dollars to the creation of a high-speed rail (HSR) corridor between San Francisco and Los
Angeles via several cities in the Central Valley, with strict and ambitious guidelines for the final
product coded into the very funding channels supporting the corridor. Although the cost of the
project was initially estimated at $33 billion that year when the bonds were approved, that
amount has notoriously ballooned to $67.6 billion according to the latest budget plans approved
by the California High-Speed Rail Authority (CHSRA), and may be even greater for system
expansions to Sacramento and San Diego.10 The planning process of this rail corridor has been
laden with controversy over budget management and right-of-way acquisition hurdles, and seven
years later it is the subject of much politicizing.
In response to the technical challenges facing this project, billionaire innovator Elon
Musk of Tesla Motors and Space X teamed with engineering associates to propose an entirely
new form of transportation technology—a ‘hyperloop’—which according to their estimations
could outperform the California High-Speed Rail Project (CHSRP) in several ways. The
Hyperloop design calls for an extremely fast, short, windowless maglev train traversing the
distance between Los Angeles and San Francisco in a pair of elevated, sealed tube with low air
pressure. The white paper “Hyperloop Alpha” released by Musk and Tesla Motors in August
2013 alleges that a hyperloop system could be faster and safer, as well as quicker and cheaper to
construct.11
The California High-Speed Rail Authority has been accruing public funds from state and
federal sources for several years since, and now has around $20 billion in total probable funds by
the year 2030 (see the “Budget Impact” section). Construction began with geotechnical tests in
XXXXX 6
2006 and grade separation construction in Fresno in January 2014; now several projects between
Madera and Fresno are underway.12 Currently community impact meetings are being conducted
in several locations around the impacted areas of Los Angeles and Orange Counties, as part of
the process of compiling environmental impact reports for all the as-yet non-contracted
construction components. And, the land acquisition process is proceeding, at a very slow pace.13
In turn, development of the Hyperloop concept has mostly taken place behind closed
doors. The two companies Hyperloop Transportation Technologies and Hyperloop Tech were
founded in Los Angeles shortly after the release of “Hyperloop Alpha” and took control of the
Hyperloop’s conceptual and financial development, relying fully on private investment and
crowdsourced funds rather than public grants. HTT, however, has a unique employment structure
allowing it to minimize R&D costs: all of its 100 engineers work off-site, donating their free
time between other unrelated projects to develop the technical concept in exchange for stock
options.14 HTT plans to open a five-mile hyperloop test track in Kern County next year costing at
least $100 million, which the company announced in spring 2015 that they were hoping to
finance by going public by the end of this year—which they have yet to do.15 Engineers at both
firms anticipate an arrival of an operational hyperloop prototype model still at least a decade
away.16
XXXXX 7
Figure 1: The CHSRP and Hyperloop routes compared (map drawn by author). The HSR
corridor follows SR-99 through Central Valley and the Hyperloop follows I-5. The Hyperloop
route is thus more direct but meets fewer intermediate urban areas between Southern California
and the Bay Area.
Mobility
Mobility and accessibility are the two central measurements of a region or a transportation
mode’s performance in moving passengers. Susan Hanson of Clark University defines mobility
in “The Context of Urban Travel” as “the ability to move between different activity sites.”17
Samuel Staley, author of Mobility First, defines it as “moving people and goods from place-toplace.”18 According to Todd Litman of the Victoria Transport Policy Institute, mobility “assumes
that any increase in travel mileage or speed benefits society.”19 Similarly, Sam Schwartz, the
former New York City Department of Transportation chief engineer, allows mobility to simplify
XXXXX 8
into “faster vehicle operating speed” in urban contexts.20 In our comparison between high-speed
rail and the Hyperloop/maglev, since both modes have essentially parallel routes through the
Central Valley and have no grade crossings with other modes of traffic, mobility will simply
concern operating speed and frequency between any two points on each system.
Proposition 1A dictated that state funds would support a “clean, efficient 220 MPH
[miles per hour] transportation system”.21 The proposition promised “travel from Los Angeles to
San Francisco in about 2 ½ hours [2h 40m specifically]”.22 Funds have passed to the California
High Speed Rail Authority conditionally on the achievement of such a system. 220 MPH is an
ambitious but not unattainable top speed for a high-speed rail service. This is the approximate
high speed of the AVE high-speed rail service between Madrid and Barcelona which began
service in 2008, as well as some Japanese Shinkansen bullet trains.23 French TGV service in
some areas of Champagne attain speeds above 300 MPH, although regular TGV service even
along the fastest routes infrequently surpasses 300 MPH. But currently no HSR system in the
world meets the sustained average speed and safety goals stipulated by Proposition 1A.24
Moreover, the only currently operational high-speed service in the United States—the Amtrak
Acela on the Northeast Corridor between Boston South Station and Washington Union Station—
has a top speed of 150 MPH, which it maintains “for five or 10 minutes” between Westerly and
Cranston, Rhode Island.25 Its true average speed is around 80 MPH.
It is considerably doubtful whether or not the current California high-speed rail plan to
traverse the entire 490-mile San Francisco – Los Angeles route in 2 hours and 40 minutes is
feasible. This would require an average speed of 184 MPH. That average in turn implies a top
attainable speed much higher than the envisioned 220 MPH, and little or no time allowed for
acceleration, rest stops, or potential congestion at the endpoint stations, even CHSRA officers
XXXXX 9
report.26 Based on this report’s calculations, traveling 490 miles in 2 2/3 hours while sustaining a
top speed of 220 MPH would require accelerating to that top speed within 26 minutes of
departing the first station, decelerating to 0 MPH within the last 26 minutes of the trip, and not
stopping or slowing down once during the middle of the trip. Such acceleration is equivalent to
0.0064 g in lateral force. The CHSRA attempts to justify this in their business plans by calling
for express trains skipping a majority of intermediate stations, and several more local trains
serving all stations but on a 3+ hour schedule (see the chart on page 14 of this report).
Many wonder why the corridor chosen by the CHSRA does not follow a shorter and
more intuitive route along I-5 and via Tejon Pass, which would only be about 380 miles long.27
The fine text of Proposition 1A obligates the CHSRP to route through Fresno, Bakersfield, and
Palmdale.28 This adds a minimum of 90 miles to the length of a straight Los Angeles-Bay Area
route along I-5. Consequently any California high-speed rail proposal attempting to tap
Proposition 1A’s ample funding reserves must achieve an average speed of at least 176 MPH and
would face the same logistical constraints.
However, all things considered, even if we remain skeptical about taking these speed
figures at face value we can still conclude that the high-speed rail corridor will vastly improve
interregional mobility. In any respect, if the total journey duration from Los Angeles to San
Francisco turns out to be in the general vicinity of 3 or 3 1/2 hours, many travelers may still shift
their trips onto high-speed rail—consider: that is approximately the duration of a Pacific
Surfliner journey from Los Angeles to San Diego, and around 250,000 passengers each year find
that service a preferential alternative to driving.29 The author of this report already commutes
regularly between Los Angeles and Oakland on Amtrak’s San Joaquin service, which is currently
an 8-hour trip including a bus connection. In addition, the several slower local-stop trains
Download PPD 360 Final Report Draft 3 WO Name
PPD 360_Final Report_Draft 3_WO Name.pdf (PDF, 546.56 KB)
Download PDF
Share this file on social networks
Link to this page
Permanent link
Use the permanent link to the download page to share your document on Facebook, Twitter, LinkedIn, or directly with a contact by e-Mail, Messenger, Whatsapp, Line..
Short link
Use the short link to share your document on Twitter or by text message (SMS)
HTML Code
Copy the following HTML code to share your document on a Website or Blog
QR Code to this page

This file has been shared publicly by a user of PDF Archive.
Document ID: 0000370536.