ps05102016 Sw4b42d (PDF)
File information
Author: Vitelli, Theresa D.
This PDF 1.5 document has been generated by Microsoft® Word 2013, and has been sent on pdf-archive.com on 10/05/2016 at 23:04, from IP address 103.227.x.x.
The current document download page has been viewed 1055 times.
File size: 383.99 KB (9 pages).
Privacy: public file

File preview
Peter A. Brown, Assistant Director,
(203) 535-6203
Tim Malloy, Assistant Director
(203) 645-8043
Rubenstein Associates, Inc.,
Public Relations
Pat Smith (212) 843-8026
FOR RELEASE: MAY 10, 2016
CLINTON-TRUMP CLOSE IN FLORIDA, OHIO, PENNSYLVANIA,
QUINNIPIAC UNIVERSITY SWING STATE POLL FINDS
---
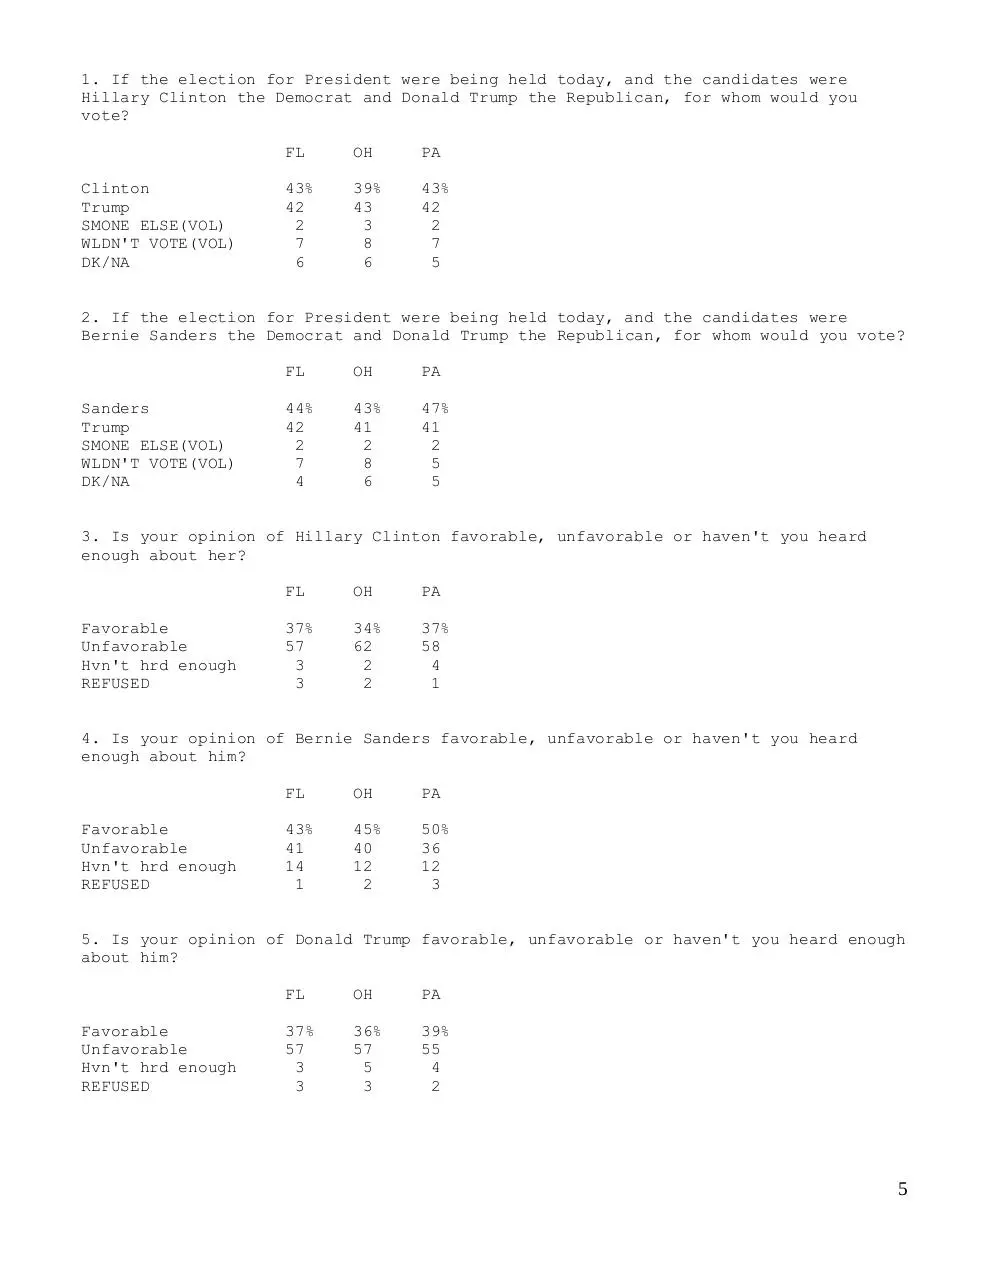
FLORIDA: Clinton 43 – Trump 42; Sanders 44 – Trump 42
OHIO: Clinton 39 – Trump 43; Sanders 43 – Trump 41
PENNSYLVANIA: Clinton 43 – Trump 42; Sanders 47 – Trump 41
In a race marked by wide gender, age and racial gaps, former Secretary of State Hillary Clinton and
Donald Trump are running neck and neck in the key presidential Swing States of Florida, Ohio and
Pennsylvania, but Sen. Bernie Sanders of Vermont runs stronger against the likely Republican
nominee, according to a Quinnipiac University Swing State Poll released today.
Clinton and Trump both have negative favorability ratings among voters in each state,
compared to Sanders’ split score, the independent Quinnipiac (KWIN-uh-pe-ack) University Poll
finds. The Swing State Poll focuses on Florida, Ohio and Pennsylvania because since 1960 no
candidate has won the presidential race without taking at least two of these three states.
The presidential matchups show:
Florida – Clinton at 43 percent, with 42 percent for Trump and Sanders at 44 percent to
Trump’s 42 percent;
Ohio – Trump edges Clinton 43 – 39 percent, while Sanders gets 43 percent to Trump’s 41
percent;
Pennsylvania – Clinton at 43 percent to Trump’s 42 percent, while Sanders leads Trump
47 – 41 percent.
“Six months from Election Day, the presidential races between Hillary Clinton and Donald
Trump in the three most crucial states, Florida, Ohio and Pennsylvania, are too close to call,” said
Peter A. Brown, assistant director of the Quinnipiac Poll.
“At this juncture, Trump is doing better in Pennsylvania than the GOP nominees in 2008 and
2012. And the two candidates are about where their party predecessors were at this point in Ohio and
Florida.”
-more-
Quinnipiac University Poll/May 10, 2016 – page 2
“This election may be good for divorce lawyers. The gender gap is massive and currently
benefits Trump,” Brown added. “In Pennsylvania, Clinton’s 19-point lead among women matches
Trump’s 21-point margin among men. In Ohio, she is up 7 points among women but down 15 points
with men. In Florida she is up 13 points among women but down 13 points among men.”
“Trump would do a better job handling the economy, voters say. He also would do a better
job handling terrorism, voters in Florida and Ohio say. Pennsylvania voters are divided.
“By wide margins, voters in all three states say Clinton is more intelligent than Trump and by
smaller margins, voters in all three states say she has higher moral standards.”
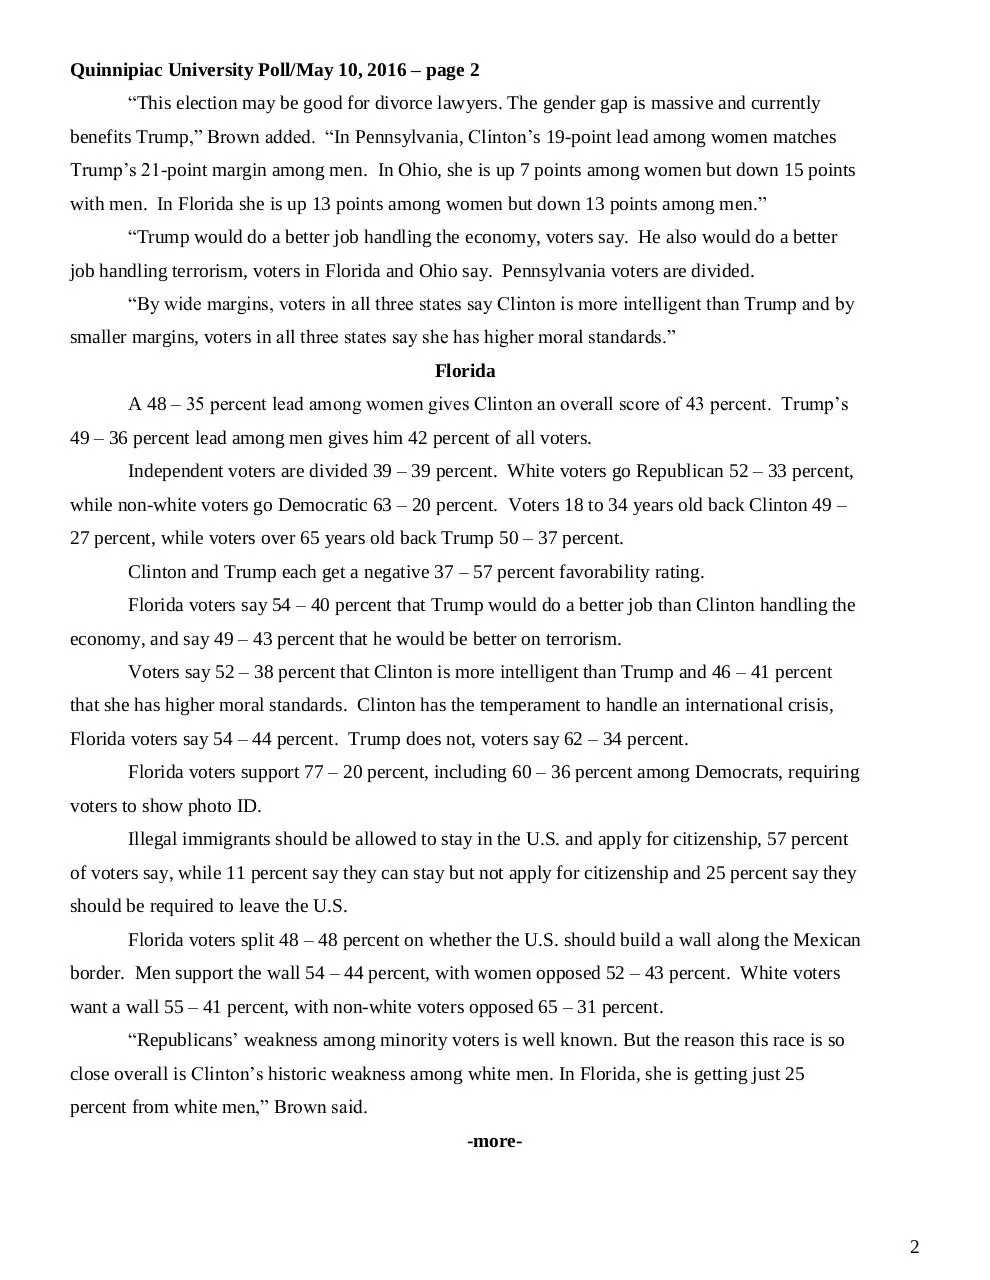
Florida
A 48 – 35 percent lead among women gives Clinton an overall score of 43 percent. Trump’s
49 – 36 percent lead among men gives him 42 percent of all voters.
Independent voters are divided 39 – 39 percent. White voters go Republican 52 – 33 percent,
while non-white voters go Democratic 63 – 20 percent. Voters 18 to 34 years old back Clinton 49 –
27 percent, while voters over 65 years old back Trump 50 – 37 percent.
Clinton and Trump each get a negative 37 – 57 percent favorability rating.
Florida voters say 54 – 40 percent that Trump would do a better job than Clinton handling the
economy, and say 49 – 43 percent that he would be better on terrorism.
Voters say 52 – 38 percent that Clinton is more intelligent than Trump and 46 – 41 percent
that she has higher moral standards. Clinton has the temperament to handle an international crisis,
Florida voters say 54 – 44 percent. Trump does not, voters say 62 – 34 percent.
Florida voters support 77 – 20 percent, including 60 – 36 percent among Democrats, requiring
voters to show photo ID.
Illegal immigrants should be allowed to stay in the U.S. and apply for citizenship, 57 percent
of voters say, while 11 percent say they can stay but not apply for citizenship and 25 percent say they
should be required to leave the U.S.
Florida voters split 48 – 48 percent on whether the U.S. should build a wall along the Mexican
border. Men support the wall 54 – 44 percent, with women opposed 52 – 43 percent. White voters
want a wall 55 – 41 percent, with non-white voters opposed 65 – 31 percent.
“Republicans’ weakness among minority voters is well known. But the reason this race is so
close overall is Clinton’s historic weakness among white men. In Florida, she is getting just 25
percent from white men,” Brown said.
-more-
2
Quinnipiac University Poll/May 10, 2016 – page 3
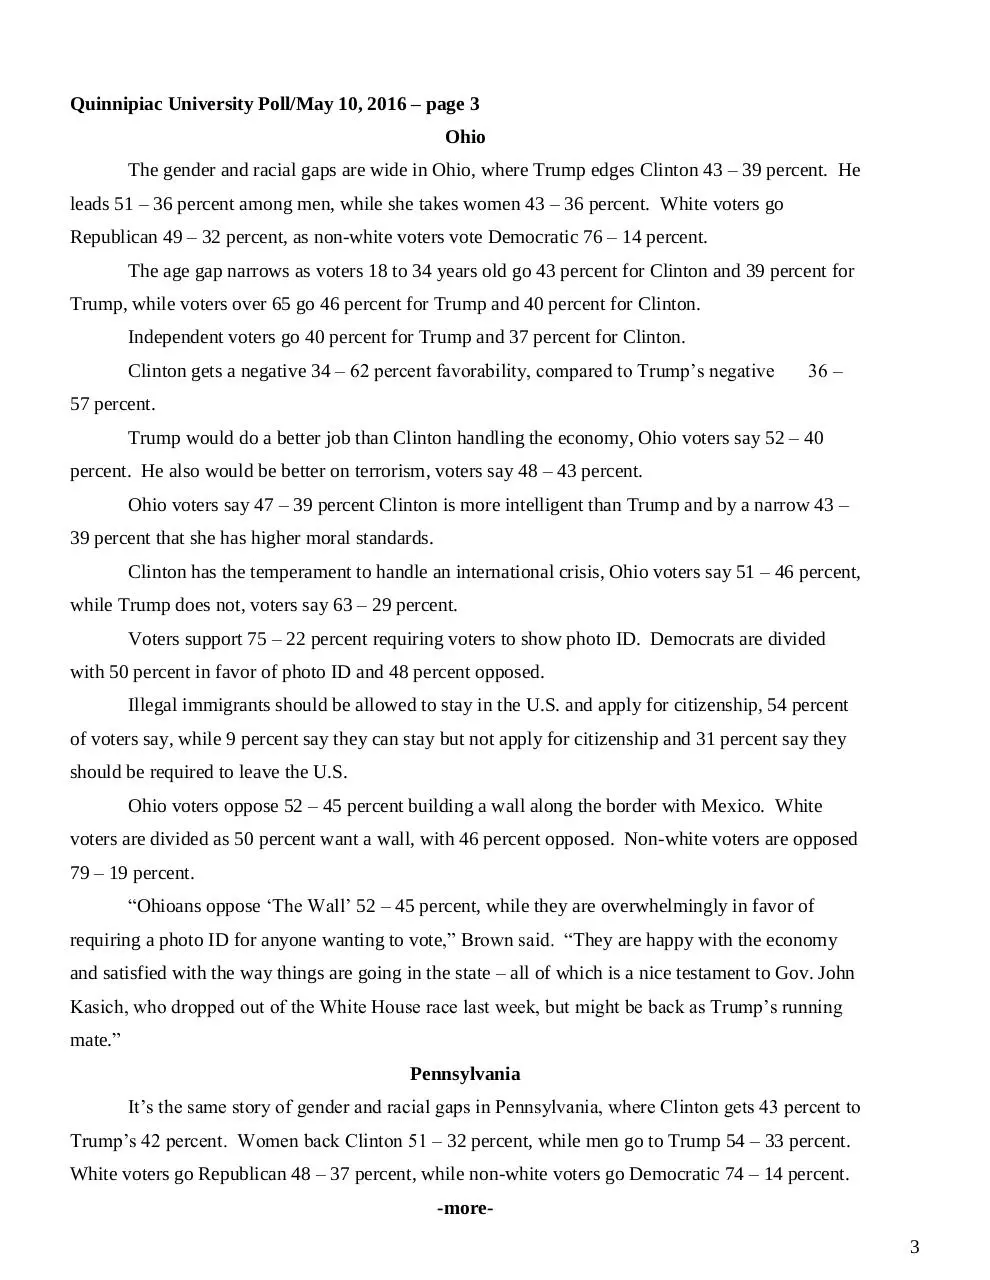
Ohio
The gender and racial gaps are wide in Ohio, where Trump edges Clinton 43 – 39 percent. He
leads 51 – 36 percent among men, while she takes women 43 – 36 percent. White voters go
Republican 49 – 32 percent, as non-white voters vote Democratic 76 – 14 percent.
The age gap narrows as voters 18 to 34 years old go 43 percent for Clinton and 39 percent for
Trump, while voters over 65 go 46 percent for Trump and 40 percent for Clinton.
Independent voters go 40 percent for Trump and 37 percent for Clinton.
Clinton gets a negative 34 – 62 percent favorability, compared to Trump’s negative
36 –
57 percent.
Trump would do a better job than Clinton handling the economy, Ohio voters say 52 – 40
percent. He also would be better on terrorism, voters say 48 – 43 percent.
Ohio voters say 47 – 39 percent Clinton is more intelligent than Trump and by a narrow 43 –
39 percent that she has higher moral standards.
Clinton has the temperament to handle an international crisis, Ohio voters say 51 – 46 percent,
while Trump does not, voters say 63 – 29 percent.
Voters support 75 – 22 percent requiring voters to show photo ID. Democrats are divided
with 50 percent in favor of photo ID and 48 percent opposed.
Illegal immigrants should be allowed to stay in the U.S. and apply for citizenship, 54 percent
of voters say, while 9 percent say they can stay but not apply for citizenship and 31 percent say they
should be required to leave the U.S.
Ohio voters oppose 52 – 45 percent building a wall along the border with Mexico. White
voters are divided as 50 percent want a wall, with 46 percent opposed. Non-white voters are opposed
79 – 19 percent.
“Ohioans oppose ‘The Wall’ 52 – 45 percent, while they are overwhelmingly in favor of
requiring a photo ID for anyone wanting to vote,” Brown said. “They are happy with the economy
and satisfied with the way things are going in the state – all of which is a nice testament to Gov. John
Kasich, who dropped out of the White House race last week, but might be back as Trump’s running
mate.”
Pennsylvania
It’s the same story of gender and racial gaps in Pennsylvania, where Clinton gets 43 percent to
Trump’s 42 percent. Women back Clinton 51 – 32 percent, while men go to Trump 54 – 33 percent.
White voters go Republican 48 – 37 percent, while non-white voters go Democratic 74 – 14 percent.
-more3
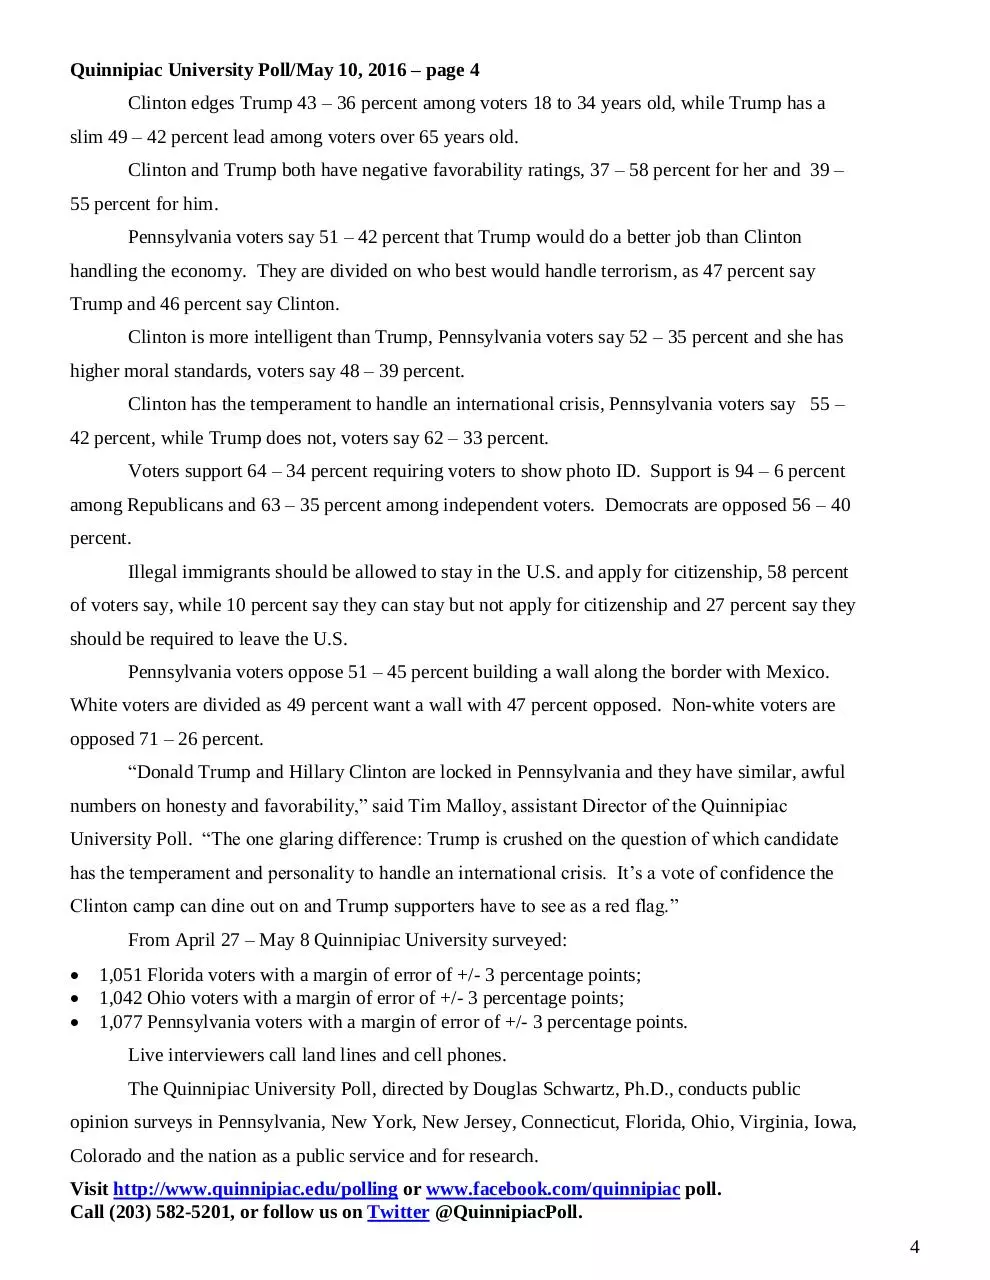
Quinnipiac University Poll/May 10, 2016 – page 4
Clinton edges Trump 43 – 36 percent among voters 18 to 34 years old, while Trump has a
slim 49 – 42 percent lead among voters over 65 years old.
Clinton and Trump both have negative favorability ratings, 37 – 58 percent for her and 39 –
55 percent for him.
Pennsylvania voters say 51 – 42 percent that Trump would do a better job than Clinton
handling the economy. They are divided on who best would handle terrorism, as 47 percent say
Trump and 46 percent say Clinton.
Clinton is more intelligent than Trump, Pennsylvania voters say 52 – 35 percent and she has
higher moral standards, voters say 48 – 39 percent.
Clinton has the temperament to handle an international crisis, Pennsylvania voters say 55 –
42 percent, while Trump does not, voters say 62 – 33 percent.
Voters support 64 – 34 percent requiring voters to show photo ID. Support is 94 – 6 percent
among Republicans and 63 – 35 percent among independent voters. Democrats are opposed 56 – 40
percent.
Illegal immigrants should be allowed to stay in the U.S. and apply for citizenship, 58 percent
of voters say, while 10 percent say they can stay but not apply for citizenship and 27 percent say they
should be required to leave the U.S.
Pennsylvania voters oppose 51 – 45 percent building a wall along the border with Mexico.
White voters are divided as 49 percent want a wall with 47 percent opposed. Non-white voters are
opposed 71 – 26 percent.
“Donald Trump and Hillary Clinton are locked in Pennsylvania and they have similar, awful
numbers on honesty and favorability,” said Tim Malloy, assistant Director of the Quinnipiac
University Poll. “The one glaring difference: Trump is crushed on the question of which candidate
has the temperament and personality to handle an international crisis. It’s a vote of confidence the
Clinton camp can dine out on and Trump supporters have to see as a red flag.”
From April 27 – May 8 Quinnipiac University surveyed:
1,051 Florida voters with a margin of error of +/- 3 percentage points;
1,042 Ohio voters with a margin of error of +/- 3 percentage points;
1,077 Pennsylvania voters with a margin of error of +/- 3 percentage points.
Live interviewers call land lines and cell phones.
The Quinnipiac University Poll, directed by Douglas Schwartz, Ph.D., conducts public
opinion surveys in Pennsylvania, New York, New Jersey, Connecticut, Florida, Ohio, Virginia, Iowa,
Colorado and the nation as a public service and for research.
Visit http://www.quinnipiac.edu/polling or www.facebook.com/quinnipiac poll.
Call (203) 582-5201, or follow us on Twitter @QuinnipiacPoll.
4
1. If the election for President were being held today, and the candidates were
Hillary Clinton the Democrat and Donald Trump the Republican, for whom would you
vote?
Clinton
Trump
SMONE ELSE(VOL)
WLDN'T VOTE(VOL)
DK/NA
FL
OH
PA
43%
42
2
7
6
39%
43
3
8
6
43%
42
2
7
5
2. If the election for President were being held today, and the candidates were
Bernie Sanders the Democrat and Donald Trump the Republican, for whom would you vote?
Sanders
Trump
SMONE ELSE(VOL)
WLDN'T VOTE(VOL)
DK/NA
FL
OH
PA
44%
42
2
7
4
43%
41
2
8
6
47%
41
2
5
5
3. Is your opinion of Hillary Clinton favorable, unfavorable or haven't you heard
enough about her?
Favorable
Unfavorable
Hvn't hrd enough
REFUSED
FL
OH
PA
37%
57
3
3
34%
62
2
2
37%
58
4
1
4. Is your opinion of Bernie Sanders favorable, unfavorable or haven't you heard
enough about him?
Favorable
Unfavorable
Hvn't hrd enough
REFUSED
FL
OH
PA
43%
41
14
1
45%
40
12
2
50%
36
12
3
5. Is your opinion of Donald Trump favorable, unfavorable or haven't you heard enough
about him?
Favorable
Unfavorable
Hvn't hrd enough
REFUSED
FL
OH
PA
37%
57
3
3
36%
57
5
3
39%
55
4
2
5
11. Regardless of how you intend to vote, who do you think would do a better job
handling the economy - Hillary Clinton or Donald Trump?
Clinton
Trump
DK/NA
FL
OH
PA
40%
54
6
40%
52
8
42%
51
7
12. Regardless of how you intend to vote, who do you think would do a better job
handling terrorism - Hillary Clinton or Donald Trump?
Clinton
Trump
DK/NA
FL
OH
PA
43%
49
7
43%
48
9
46%
47
7
13. In general, how satisfied are you with the way things are going in - (FL) Florida
/ (OH) Ohio / (PA) Pennsylvania - today; are you very satisfied, somewhat satisfied,
somewhat dissatisfied, or very dissatisfied?
Very satisfied
Smwht satisfied
Smwht dissatisfied
Very dissatisfied
DK/NA
FL
OH
PA
9%
49
26
15
1
13%
54
22
10
1
4%
40
33
21
1
14. Would you describe the state of - (FL) Florida's / (OH) Ohio's / (PA)
Pennsylvania's - economy these days as excellent, good, not so good, or poor?
Excellent
Good
Not so good
Poor
DK/NA
FL
OH
PA
5%
52
30
10
2
4%
57
29
9
1
1%
38
44
14
2
15. Do you think - (FL) Florida's / (OH) Ohio's / (PA) Pennsylvania's - economy is
getting better, getting worse, or staying about the same?
Better
Worse
The same
DK/NA
FL
OH
PA
34%
11
53
2
35%
12
52
2
16%
26
56
3
6
16. Would you say that you are better off or worse off financially than you were a
year ago?
Better off
Worse off
SAME(VOL)
DK/NA
FL
OH
PA
47%
28
24
1
50%
24
24
1
39%
34
26
2
17. Would you say that Hillary Clinton - is honest and trustworthy or not?
Yes
No
DK/NA
FL
OH
PA
29%
66
4
27%
69
4
30%
67
3
18. Would you say that Donald Trump - is honest and trustworthy or not?
Yes
No
DK/NA
FL
OH
PA
38%
57
5
35%
58
7
39%
55
6
19. Would you say that Hillary Clinton - has strong leadership qualities or not?
Yes
No
DK/NA
FL
OH
PA
53%
45
2
54%
44
2
58%
40
2
20. Would you say that Donald Trump - has strong leadership qualities or not?
Yes
No
DK/NA
FL
OH
PA
60%
37
3
61%
36
3
62%
37
1
21. Would you say that Hillary Clinton - cares about the needs and problems of people
like you or not?
Yes
No
DK/NA
FL
OH
PA
41%
56
2
44%
53
3
44%
52
4
7
22. Would you say that Donald Trump - cares about the needs and problems of people
like you or not?
Yes
No
DK/NA
FL
OH
PA
40%
58
3
37%
58
5
39%
58
3
23. Would you say that Hillary Clinton - has the right kind of temperament and
personality to handle an international crisis as President, or not?
Yes
No
DK/NA
FL
OH
PA
54%
44
2
51%
46
3
55%
42
3
24. Would you say that Donald Trump - has the right kind of temperament and
personality to handle an international crisis as President, or not?
Yes
No
DK/NA
FL
OH
PA
34%
62
3
29%
63
7
33%
62
5
25. Regardless of how you intend to vote, who do you think has higher moral
standards: Hillary Clinton or Donald Trump?
Clinton
Trump
DK/NA
FL
OH
PA
46%
41
12
43%
39
18
48%
39
13
26. Regardless of how you intend to vote, who do you think is more intelligent:
Hillary Clinton or Donald Trump?
Clinton
Trump
DK/NA
FL
OH
PA
52%
38
10
47%
39
15
52%
35
13
29. As you may know, there have been efforts in some states to require voters to show
a photo identification card to vote. Some people say this is needed to prevent people
from voting who are not eligible to vote. Other people say such efforts are designed
8
to suppress voting by minorities. What do you think: do you support or oppose efforts
to require voters to show a photo identification card to vote?
Support
Oppose
DK/NA
FL
OH
PA
77%
20
3
75%
22
3
64%
34
2
30. Which comes closest to your view about illegal immigrants who are currently
living in the United States? A) They should be allowed to stay in the United States
and to eventually apply for U.S. citizenship. B) They should be allowed to remain in
the United States, but not be allowed to apply for U.S. citizenship. C) They should
be required to leave the U.S.
A) Stay/Citizenship
B) Stay/Not citizen
C) Not stay
DK/NA
FL
OH
PA
57%
11
25
7
54%
9
31
5
58%
10
27
4
31. Would you support or oppose building a wall along the border with Mexico?
Support
Oppose
DK/NA
FL
OH
PA
48%
48
4
45%
52
3
45%
51
4
9
Download ps05102016 Sw4b42d
ps05102016_Sw4b42d.pdf (PDF, 383.99 KB)
Download PDF
Share this file on social networks
Link to this page
Permanent link
Use the permanent link to the download page to share your document on Facebook, Twitter, LinkedIn, or directly with a contact by e-Mail, Messenger, Whatsapp, Line..
Short link
Use the short link to share your document on Twitter or by text message (SMS)
HTML Code
Copy the following HTML code to share your document on a Website or Blog
QR Code to this page

This file has been shared publicly by a user of PDF Archive.
Document ID: 0000370560.