UdovicKennethProjectReport (PDF)
File information
This PDF 1.4 document has been generated by LaTeX with hyperref package / pdfTeX-1.40.3, and has been sent on pdf-archive.com on 13/06/2016 at 18:22, from IP address 47.23.x.x.
The current document download page has been viewed 337 times.
File size: 199.73 KB (5 pages).
Privacy: public file


File preview
Identifying Those NJ Homeowners Most Likely to Install
Grid-Tied Solar Power Systems
Upon Expiration of
the Federal 30% Investment Tax Credit Incentive
Kenneth D. Udovic
Computer Science Dept., Rutgers University
New Brunswick, New Jersey
kennyudovic@gmail.com
1.
INTRODUCTION
The phrase “Green Energy” is used to identify those renewable energy sources which are constantly being replenished
by natural processes on earth and in the atmosphere. Unlike
green energy, fossil fuel (natural gas, oil, and coal) has taken
500 million years to produce, and is now being consumed by
mankind at a million times faster rate.
Burning fossil fuels for energy emits CO2 , a greenhouse
(global warming) gas which now has reached 400 parts per
million concentration in our atmosphere - a level never experienced since the start of the human species two million years
ago. If we continue to burn fossil fuels under a business-asusual scenario, the scientific consensus is that the mean temperature of the earth’s climate will rise 10 degrees Fahrenheit
over the next 100 years due to the fossil fuel CO2 emissions
released into the atmosphere. To avoid this possibility, it is
imperative that we transition from using fossil fuels to using
green energy sources as speedily as possible in a manner that
does not cause major disruption to the world’s economies.
2.
RELATED WORK
Both the Federal and NJ State governments offer financial
incentives in the form of subsidies to early adopters who
produce clean energy. Without these subsidies, far fewer
homeowners and investors could economically-justify ownership of solar power systems in New Jersey at this time.
Honeywell, Inc., as commissioned by the NJ Board of Public
Utilities (BPU), tracks and reports solar build-out progress
in the State by publishing a monthly updated list of all existing solar panel installations, with companion system and
location details.
I am unaware of anyone having combined the information
contained within Honeywell’s solar installation database with
the additional site and tax information provided in New Jersey’s public database of property tax records to produce a
machine learning system capable of identifying and quantifying those factors which have most influenced recent solar
panel owners in their choice of third party over self ownership of these panels.
The sale and installation of home solar power systems in
New Jersey is a recent and fast growing industry. As the
hard and soft costs of these systems continue to decline,
more homeowners will be financially able to install and use
solar power systems that provide free electricity in return
for their required up-front capital equipment investments.
If this can be accomplished, the resulting machine learning system could be used to estimate, as well as to track,
the changing probabilities and characteristics of those NJ
homeowners most likely to install solar panels after the 30%
federal clean energy investment tax credit incentive which
drives third party ownership expires on Dec. 31, 2016.
Until home solar panel systems become commodity items
at significantly lower prices, it remains important that the
solar industry efficiently identify and close sales to those NJ
residents best-positioned to adopt this green energy technology during its higher cost infancy stage of deployment.
3.
BACKGROUND INFORMATION
Being able to predict which NJ residents are currently the
best candidates for installing solar panel system as the Federal tax investment credit expiration date approaches is a
complex probability dependent upon factors such as the
physical size, roof orientation, and shade characteristics of
the property and structures, as well as the age and wealth
of the homeowner candidate under consideration.1 However, siting factors should be statistically independent of
the homeowner wealth factor being examined for identifying homeowners most likely to install solar panel systems
after 2016, when third party ownership of residential solar
panel systems become much less probable.
1
The largest grid-tied solar panel system a NJ homeowner
is allowed to install is 10 Kwatts. The average cost of such
a system is $28,000.
4.
PROPOSED APPROACH
Table 1: Relevant Data Fields in Experiments
My software system is capable of performing iterative Naive
Bayes and Logistic Regression analyses of existing solar panel
owners to help determine at what increase in relative frequency of self ownership, the solar industry should transition to the promoting and sale of self-owned solar power
systems.
My machine learning system first correlates information from
the BPU’s database of existing NJ solar panel systems with
information in the State’s database of property tax records
to pinpoint those tax records of properties where solar power
systems are earning NJ Solar Renewable Energy Credits
(SRECs) for the clean energy they produce.
I have written scripts for processing the solar panel database
by both county (NJ has 21 counties) and individual town
(NJ has 566 towns).
Each processed county has its own directory of files for each
town in the county that contains the tax records of all identified solar panel owners within that town. This partitioning
of solar panel owners and properties by county and town allows me to analyze and compare the characteristics of the
solar build-outs occurring within different towns or counties, a capability that may be of periodic interest to industry
stakeholders.
Data Field
ownertype
taxes
density
systemsize
5.
Description
Self or third party ownership boolean that
this experiment analyzed and classified.
The property taxes.
The population density of the installation
town.
The size of the solar panel system.
EXPERIMENTS
The data fields experimented on are identified and described
in Table 1 above.
The experiments were mainly performed on the properties in
Monmouth county, Morris county and Ocean county. Each
of these counties had about 700 solar panel installations consisting of about 600 financed solar panels and 100 personally
owned. The datasets of individual towns created by custom
scripts were programatically combined into a single file for
county-wide processing. The original objective of the project
was to classify third party ownership of solar panels using
logistic regression. This intention changed, however, when
the initial mechanisms provided predictions with almost zero
precision.
A considerable amount of preprocessing was required to obtain clean sets of data. The BPU’s solar panel installation
database provides the last name of each solar panel purchaser (but not the first name) and the county and town
where his panels were installed. When cross referencing the
tax database parsed by town and county code, all last names
with multiple matches had to be discarded. A series of algorithms were constructed to convert acerages to consistent
units and parse out properties that had zero values.
The general logistic regression model operating on the dataset
of Monmouth County provided the following confusion matrix:
Prediction
0
1
Reference
0
1
610 120
5
3
I wrote procedures in R programming language, executed
in an R-system application environment, that used these
available R-library provided learning algorithms to process
the data:
Accuracy:
Precison:
0.8292
0.024
• Naive Bayes Approximation, trained on a data split of
20%,
Likewise, running Naive Bayes Approximation MAP trained
on a data split of 20% provided the corresponding confusion
matrix:
Prediction
0
1
Reference
0
1
610 121
5
2
Accuracy:
Precison:
0.8293
0.0162
• Logistic Regression,
• Naive Bayes Approximation MAP, trained on a data
split of 20%,
• Logistic Regression on an equalised database, and
• Naive Bayes Approximation MAP with a 3 repeated
10-fold cross validation.
Certain splits of the data provided 100% predictions of financing panels. The results proved to be insightful but disappointing. Those who were predicted to be non-financers
of their solar panels were the properties with the outlyingly
high property taxes. A conclusion could be drawn at this
point saying that if one intends to install solar panels and
follow suit with the previous owners, one should more or less
only consider having a third party finance his panels.
The problem with that result is twofold. First, it is not an
economically sound conclusion, and second, investors will
no longer be adequately incented after to own the new solar
panel systems of future homeowners. Doing the research,
one would learn that third party ownernship of solar panels
is overall about 30% more expensive than self ownership over
the power system’s lifetime, even after discounting the time
value of future energy savings. Just by looking at the transaction of installing financed panels in a transparent light,
one can see that there is a middle man profiting. The results of previous data may point to always financing panels,
but logically the data needed to be considered differently.
from Monmouth county provided about 600 financed panels. By duplicating the 300 personally owned panel data
and combining with financed panel data in an experimental Monmouth County file, I created a 50% / 50% data set.
The following graph shows the density of each attribute.
The blue graph denotes self-ownership (1); the red graph
denotes third party (0) ownership.
Graphing the data provided insight into the results. The
following graph plots and compares the current probability
densities of owners and financers of panels. The blue graph
denotes self-ownership (1); the red graph denotes third party
(0) ownership.
Figure 2. Naive Bayes - Equal Probability A Priori Weighting
The resulting confusion matrix was produced:
Figure 1. Naive Bayes Analysis - No A Priori Weighting
The overwhelming amount of past and current financers
skewed the results heavily. Readjustment of either the algorithm or the data was required to explore the consequence
of the expected drastic reduction after 2016 in the future
financing of solar power systems through third party owners. Drawing from the conclusions mentioned, the data
was next processed by running Naive Bayes Approximation
MAP trained on a data split of 20%. Maximum a posteriori
allowed for the data to be considered in a different light.
Setting the priors to account for 50% third party ownership,
50% personal ownership, a much more useful result was produced.
Prediction
0
1
Reference
0
1
528 82
87
41
Accuracy :
Precision:
0.771
0.33
Likewise I hoped to produce similar results with logistic regression. Combining owners from Monmouth County, Ocean
County and Morris County produced a file with more than
300 personally owned panels. Taking the financed panels
Prediction
0
1
Reference
0
1
434 295
181 320
Accuracy :
Precision:
0.61300813
0.52
There are a series of things inheritly wrong with this approach, mainly the duplicated data, and also the combining
of separate counties only on positives and not negatives, but
the results showed again that density was the main factor
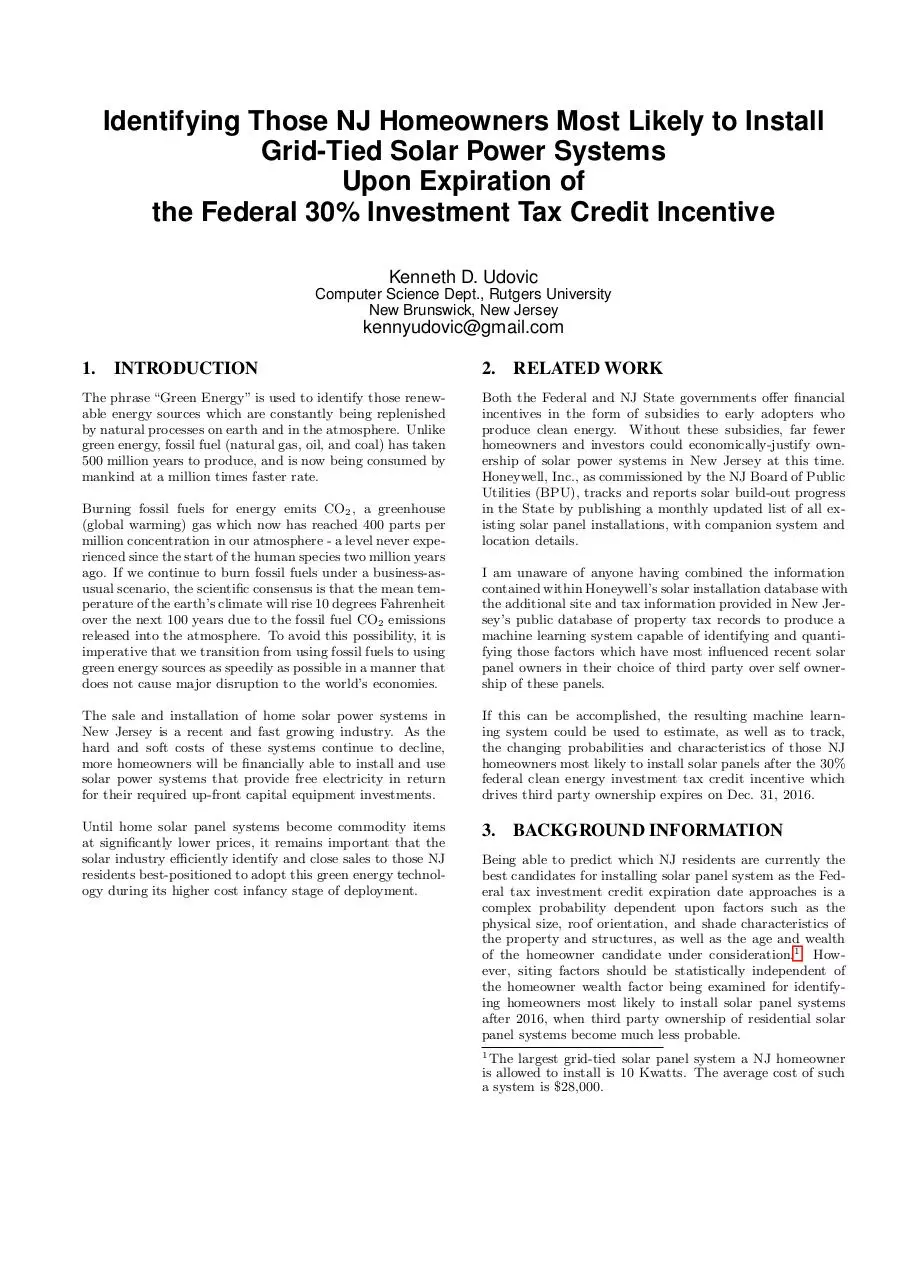
effecting the original results. One valuable thing logistic regression provided is the ability to graphically display the influence of certain attributes. The following graph shows how
taxes (a measure of individual wealth) affect the prediction.
It was created from the unmodified Monmouth County file,
setting all other attributes to their mean values and graphing the taxes against the logit function.
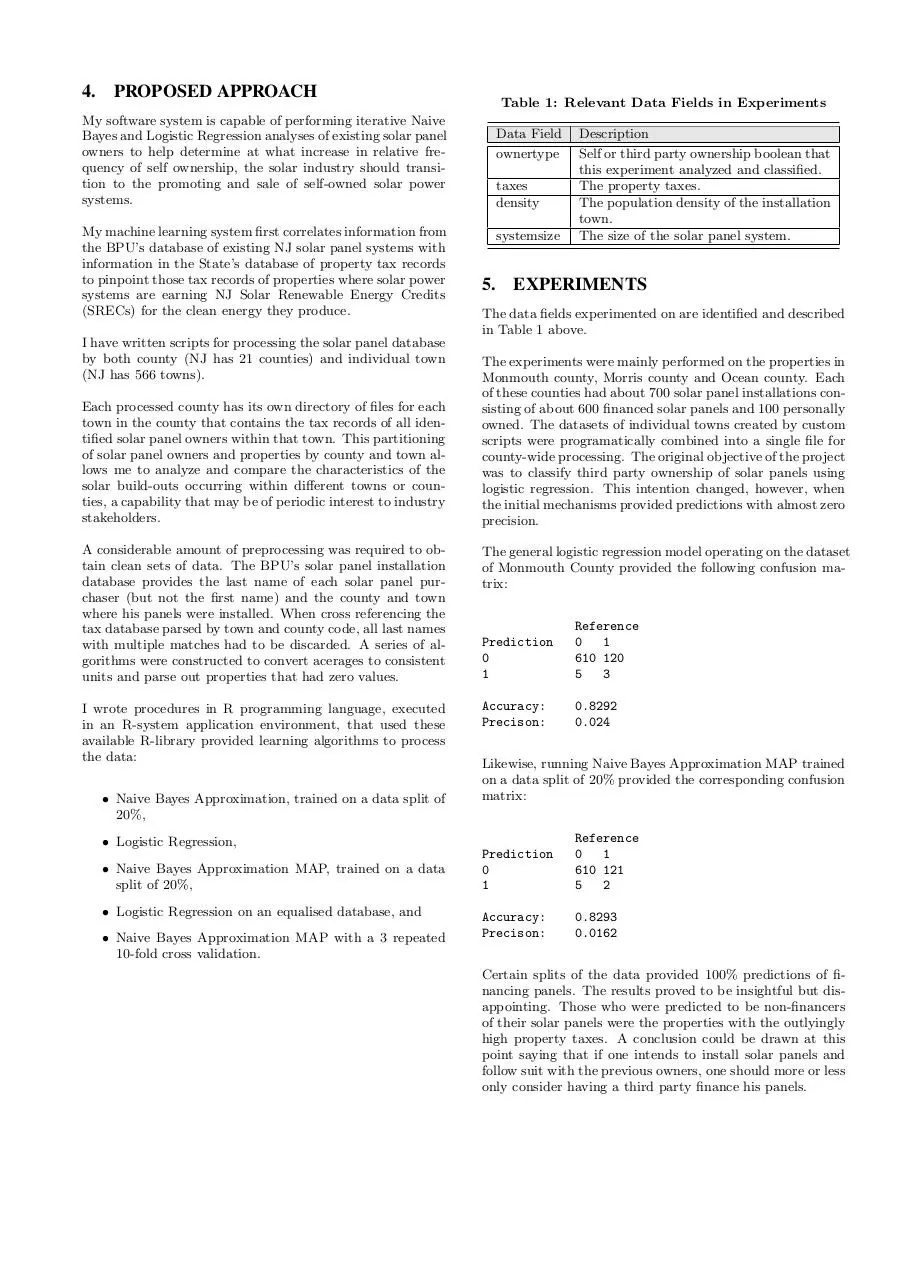
Finally, Naive bayes approximation MAP with a 3 repeated
10-fold cross validation was ran using the original unmodified Monmouth County dataset. The confusion matrix and
other pertaining data is as follows:
Prediction
0
1
Reference
0
1
502 71
113 52
Accuracy : 0.7507
Precision: 0.423
Cross-Validated (10 fold, repeated 3 times)
Summary of sample sizes: 664, 664, 664, 665, 664, 664, ..
Resampling results across tuning parameters:
Figure 3. Logistic Regression Analysis Results
usekernel
FALSE
TRUE
Accuracy
0.7104124
0.6865123
Kappa
0.1502179
0.1410064
Accuracy SD
0.08307406
0.06668849
Kappa SD
0.1046217
0.1455258
The 3 repeated 10-fold cross validation proved to be the best
results from any of the methods attempted. The method
was able to produce results with both high accuracy and
high precision on unaltered data.
6.
CONCLUSIONS AND FUTURE WORK
To date, 83% of all NJ homeowners with solar panel systems have chosen third party ownership to finance their system purchase at zero up-front cost to themselves. However,
third party ownership of new solar panel systems will rapidly
decline beginning 2017, after expiration of the 30% federal
investment tax credit incentive driving its availability and
popularity.
My machine learning experiment has successfully identified
wealth differences among the two populations (by ownership
type) of NJ solar panel owners and shows that that this
factor becomes increasingly important in predicting what
NJ homeowners will continue to install solar panel systems
after 2016, when the ratio of self to third party ownership
(i.e., financing mechanism) rapidly changes in favor of self
ownership.
My analysis predicts that at the point of parity of occurrence of self and third party ownership of new solar panel
systems, those homeowners with property taxes greater than
$11,000 per year will be the most probable source of new
residential solar build out after 2016, until solar panel system costs drop significantly as the technology matures and
achieves commodity-scale adoption rate. Those who live in
more dense towns also have a higher chance of purchasing
their solar panels.
Lastly, if run monthly to analyze the updated NJ solar installation database released for that month, my software
system can measure the actual change in new panel ownership ratio that has occurred, which then determines the
best product offering mix and associated NJ homeowners to
approach in order to maximize sales of solar panel sales for
that month.
7.
REFERENCES
1. NJ Solar Installation Report, February, 2015,
by Charlie Garrison, Honeywell, Inc., archived at:
http://edge1.pi-domains.com/kdu/NJ_Solar_Installations_as_of_022815.csv
2. NJ State Tax Record Database at:
http://www.state.nj.us/treasury/taxation/lpt/TaxListSearchPublicWebpage.shtml
3. R-system Software System, Ver. 3.1.3, with Packages:
klaR 0.6-12, caret 6.0-47, ggplot2 1.0.1,
lattice 0.20-30, and MASS 7.3-40 .
Download UdovicKennethProjectReport
UdovicKennethProjectReport.pdf (PDF, 199.73 KB)
Download PDF
Share this file on social networks
Link to this page
Permanent link
Use the permanent link to the download page to share your document on Facebook, Twitter, LinkedIn, or directly with a contact by e-Mail, Messenger, Whatsapp, Line..
Short link
Use the short link to share your document on Twitter or by text message (SMS)
HTML Code
Copy the following HTML code to share your document on a Website or Blog
QR Code to this page

This file has been shared publicly by a user of PDF Archive.
Document ID: 0000385939.