OccupancyStudies2 (4) (PDF)
File information
Title: OccupancyStudies2
This PDF 1.3 document has been generated by Keynote / Mac OS X 10.11.1 Quartz PDFContext, and has been sent on pdf-archive.com on 06/07/2016 at 18:53, from IP address 128.141.x.x.
The current document download page has been viewed 395 times.
File size: 410.97 KB (9 pages).
Privacy: public file


File preview
Strips Occupancies Studies
Alan Taylor
1
Introduction
•
Previously showed strips occupancies for the Inclined Barrel 4.0 layout
using a minimum bias sample.
•
These studies were inconsistent (~factor of 5) different with the LoI layout
results shown previously.
•
It was suggested that the sample I was looking at only had clusters
associated with tracks rather than all clusters in the event. This was the
case.
•
Analysis performed using InDetUpgradePerformanceAnalysis package.
This package is written for D3PDs. I have started to rewrite some of it for
xAOD and for the new geometries.
•
Results are scaled to <mu> = 200.
•
Use phi asymmetry and refer to modules with etaModuleID
Min bias sample
Previously used sample mc15_14TeV.
•
119995.Pythia8_A2MSTW2008LO_minbias_inelastic_low.recon.DAOD_IDTRKVALID.e1133_s
2846_s2850_r7878 — Inclined Barrel 4.0, Min bias <mu> = 0. Step 1.0.
•
The DAOD_IDTRKVALID format only stores hits associated to tracks and
not all hits. Uses InDetDxAOD.py —> ThinHitsOnTrack() function.
•
Produced 10k private sample using the RDO that was used to produce the
sample I was using previously.
•
Add flags:
InDetDxAODFlags.ThinHitsOnTrack.set_Value_and_Lock(False);InDetDxAODFlags.ThinTrack
Selection.set_Value_and_Lock(\”InDetTrackParticles.pt > 0.0*GeV\")"
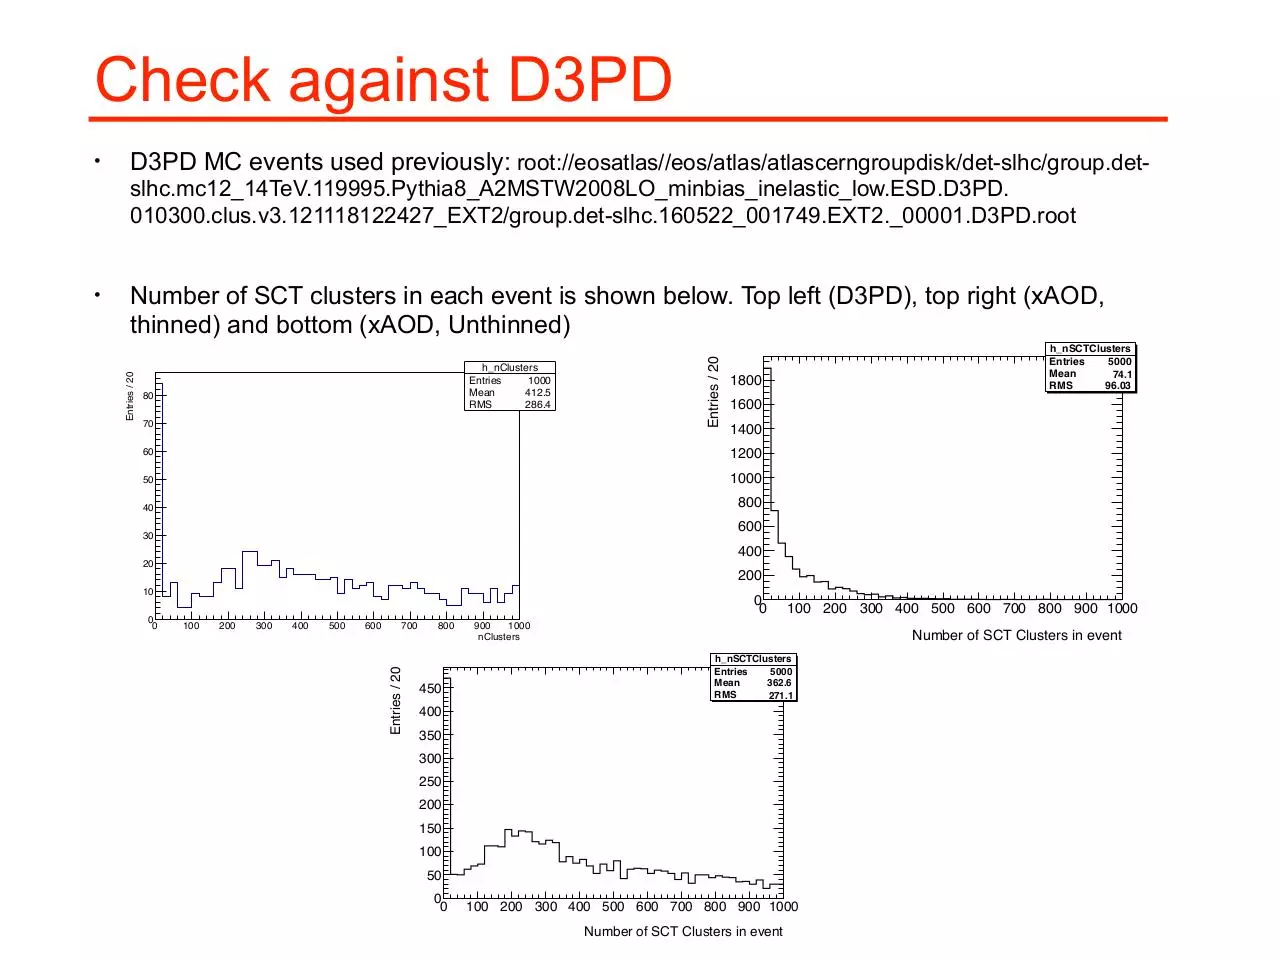
Check against D3PD
•
D3PD MC events used previously: root://eosatlas//eos/atlas/atlascerngroupdisk/det-slhc/group.detslhc.mc12_14TeV.119995.Pythia8_A2MSTW2008LO_minbias_inelastic_low.ESD.D3PD.
010300.clus.v3.121118122427_EXT2/group.det-slhc.160522_001749.EXT2._00001.D3PD.root
h_nClusters
Entries
1000
Mean
412.5
RMS
286.4
80
70
Entries / 20
Number of SCT clusters in each event is shown below. Top left (D3PD), top right (xAOD,
thinned) and bottom (xAOD, Unthinned)
h_nSCTClusters
Entries
5000
Mean
74.1
RMS
96.03
1800
1600
1400
60
1200
50
1000
40
800
600
30
400
20
200
10
0
0
0
0
100
200
300
400
500
600
700
Entries / 20
Entries / 20
•
800
450
100 200 300 400 500 600 700 800 900 1000
900
1000
nClusters
Number of SCT Clusters in event
h_nSCTClusters
Entries
5000
Mean
362.6
RMS
271.1
400
350
300
250
200
150
100
50
0
0
100 200 300 400 500 600 700 800 900 1000
Number of SCT Clusters in event
Check against D3PD
•
D3PD MC events used previously: root://eosatlas//eos/atlas/atlascerngroupdisk/det-slhc/group.detslhc.mc12_14TeV.119995.Pythia8_A2MSTW2008LO_minbias_inelastic_low.ESD.D3PD.
010300.clus.v3.121118122427_EXT2/group.det-slhc.160522_001749.EXT2._00001.D3PD.root
Number of SCT hits (using cluster size) in each event is shown below. Top left (D3PD), top
right (xAOD, thinned) and bottom (xAOD, Unthinned)
h_nSCTHits
Entries
1000
Mean
1596
RMS
1293
100
80
Entries / 100
# number of SCT hits
h_nSCTHits
Entries
5000
Mean
129.1
RMS
205.3
3500
3000
2500
2000
60
1500
40
1000
500
20
0
0
0
0
500
1000
1500
2000
2500
3000
Entries / 100
Entries / 100
•
3500
500
4000
500 1000 1500 2000 2500 3000 3500 4000 4500 5000
4500
5000
number of hits
Number of SCT Hits in event
h_nSCTHits
Entries
5000
Mean
1262
RMS
1124
400
300
200
100
0
0
500 1000 1500 2000 2500 3000 3500 4000 4500 5000
Number of SCT Hits in event
SCT Barrel Occupancy
Occupancies are calculated as N hits / N readout channels, averaged over
10,000 events and over phi.
Number of hits
•
Occupancy =
1.4
Channel Occupancy in %
Occupancies are calculated as N hits / N readout channels, averaged over
10,000 events and over phi.
•
Channel Occupancy in %
Number of readout channels
Layer 0
Layer 1
Layer 2
Layer 3
1.2
1
0.8
1.4
1.2
1
0.8
0.6
0.6
0.4
0.4
−1000
−500
0
500
1000
z [mm]
Layer 0
Layer 1
Layer 2
Layer 3
−60
−40
−20
0
20
40
60
etaModuleID
SCT Disk Occupancy
•
Occupancies are calculated as N hits / N readout channels, averaged over
10,000 events and over phi.
Number of hits
Occupancy =
Occupancy vs r. Each point is referenced by etaModuleID in xAOD. Left/
Right denotes the two end caps.
2
Channel Occupancy in %
Channel Occupancy in %
•
Number of readout channels
Disk 0(L)
Disk 1(L)
Disk 2(L)
Disk 3(L)
Disk 4(L)
Disk 5(L)
1.8
1.6
1.4
1.2
1
2
1.6
1.4
1.2
1
0.8
0.8
0.6
0.6
0.4
0.4
400
500
600
700
800
900
r [mm]
Disk 0(R)
Disk 1(R)
Disk 2(R)
Disk 3(R)
Disk 4(R)
Disk 5(R)
1.8
400
500
600
700
800
900
r [mm]
r [mm]
Comparison against LoI Occupancy
•
2D Occupancy Map for SCT Barrel + Disks.
•
On left, each bin is labelled by Layer/Disk + etaModuleID.
•
On right, each bin is for sensor.
1100
1.6
1000
1.4
900
1.2
800
1
700
0.8
600
0.6
0.4
500
0.2
400
−3000 −2000 −1000
0
1000
2000
3000
z [mm]
0
Conclusions
•
Resolved issue with sample being used. Can we get these samples made
centrally? Both for minimum bias (mu = 0) and ttbar (mu = 200).
•
Even if it is just a 5k sample for ttbar (mu = 200).
•
To do : resolve, increase in occupancy with respect to LoI.
•
Will extend average occupancies to pixels also (for all layouts) and then
look at maximum occupancies expected.
Download OccupancyStudies2 (4)
OccupancyStudies2 (4).pdf (PDF, 410.97 KB)
Download PDF
Share this file on social networks
Link to this page
Permanent link
Use the permanent link to the download page to share your document on Facebook, Twitter, LinkedIn, or directly with a contact by e-Mail, Messenger, Whatsapp, Line..
Short link
Use the short link to share your document on Twitter or by text message (SMS)
HTML Code
Copy the following HTML code to share your document on a Website or Blog
QR Code to this page

This file has been shared publicly by a user of PDF Archive.
Document ID: 0000398025.