Avigilon Corporation CFA Research Challenge Team E (1) (PDF)
File information
This PDF 1.3 document has been generated by PDFMerge! (http://www.pdfmerge.com) / Mac OS X 10.9.2 Quartz PDFContext, and has been sent on pdf-archive.com on 09/08/2016 at 04:13, from IP address 96.48.x.x.
The current document download page has been viewed 869 times.
File size: 2.39 MB (19 pages).
Privacy: public file


File preview
CFA Institute Research Challenge
Hosted in
Vancouver, British Columbia
Team E
avigilon
Avigilon Corporation |Technology, Hardware
AVO: TSX
Current Share Price: $20.93 (Feb 3 - Bloomberg)
February 2015
Team E
This report is published for educational purposes only by students
competing in the CFA
Global Investment Research Challenge.
Highlights
Recent Acquisitions:
Red cloud Security Inc. ($17M)
-Innovative provider of web-based,
physical and virtual access control
systems.
Video IQ ($32M)
-Provides high definition, dome,
and streaming cameras, as well as
encoders and adaptive analytics
products.
Object Video ($80M)
-Leading technology and Solutions
Company specializing in video content
analysis.
Figure 1: Avigilon Recent Acquisitions
Source: Company Data
Ratio
Cur
EV/T12EBITDA
Periodic EV to
T12M EBITDA 5 Year Average
Enterprise
Value/EBITDA
Adjusted
Price Earnings
Ratio (P/E)
Price / Earnings 5 Year Average
Trailing 12M
EBITDA Margin
EBITDA Margin
3 Yr Average
Price to Book
Ratio
Price/Sales
EV To Trailing
12M Sales
2015-01-24
16.23x
28.59x
17.14x
27.20x
42.52x
16.55%
18.69%
2.89x
3.18x
2.69x
Avigilon is ramping up the size and capability of its sales
force in order to enforce growth in undeveloped markets
around the globe.
Recommendation
We issue a buy recommendation of $28.55, which gives an upside of
36.4%.
Market Growth
Sales growth in the future can be seen as a summation of two parts:
global industry growth serving as the base, and AVO market share
growth providing further growth momentum on top of the market
trend. Avigilon’s main market growth driver is the potential for
increased revenue through an expansion of their sales force and
reseller distribution network.
EBITDA Margin Growth
The rapid expansion of Avigilon’s reseller network has required
high expansion costs that have reduced its operating margins.
Avigilon’s EBITDA margin is 17% versus the industry average of
23%. The firms per unit expansion costs will decline over the
next several years due to economies of scale, and this will result
in an increasing operating margin.
Firm Organic growth
Market share growth for Avigilon comes mainly from expansion
of its reseller network. As shown in Figure 9, Avigilon has
established reseller representatives in approximately half of
potential markets around the globe. We project that Avigilon will
continue to build out its reseller network for several years before
reaching its saturation point.
Acquisition strategy
As seen in Figure 1, Avigilon has made significant new acquisitions
to expand their technology capabilities. The firm has built up a
current cash position of $100 million, which will enable it to further
this strategy without the need to raise new capital from external
sources or with debt. We believe this strategy, along with the current
level of R&D investment, is important to maintain Avigilon’s
competitive position in a rapidly developing market.
Business Description.
Avigilon manufactures high definition surveillance equipment and
systems for network wide capture, transmission, recording and playback.
The company is a global leader in design, manufacturing and marketing
of HD network based video surveillance systems, video analytics and
access control. Subsidiaries include Avigilon UK, Middle East, USA and
Singapore.
Figure 2: Revenue growth
Source: Company Reports
Sales of HD surveillance constitute 100% of total sales of the company.
Main foreign destinations for Avigilon product are US, UK, EMEA and
Asia. The proportion of sales from each geographical region is fairly
stable over the last 3 years, with Canada accounting for 9%, US
contributing 51%, and EMEA accounting for 23% (Figure 3).
Avigilon manufactures and designs its products in Richmond, BC. This is
done in its 61,000 Sq.ft. facility, which has a capacity exceeding $500m
(company annual report). Avigilon’s 2013 revenue of $178m implies a
capacity utilization rate of 36%. This clearly shows Avigilon ability to
sustain growth for the short to medium term. This in-house production
and design facility enables them to deliver their products faster as well as
test various prototypes and designs without having to go through an
external manufacturer.
Avigilon systems have been installed at over 24,000 customer sites in
more than 113 countries, including school campuses, transportation
systems, healthcare centres, public venues, critical infrastructure, prisons,
factories, casinos, airports, financial institutions, government facilities and
retailers.
Figure 3: Regional revenue
breakdown
Source: Company Data
The company does not sell directly to the end user; instead it employs a
sophisticated re-seller network (Figure 4), which is continually expanding
its global reach. Its strategy for the foreseeable future consists of a)
Making acquisitions that further
develop AVO’s most profitable
segment of their business portfolio video analytics. Their acquisitions
allow them to enhance their capabilities
and enhance their portfolio of patents
and b) Marketing their products more
aggressively.
For
this
reason,
marketing expenses are expected to be
higher in the future of Avigilon.
Figure 4: Avigilon Distribution Model
Source: Company Analysis
2
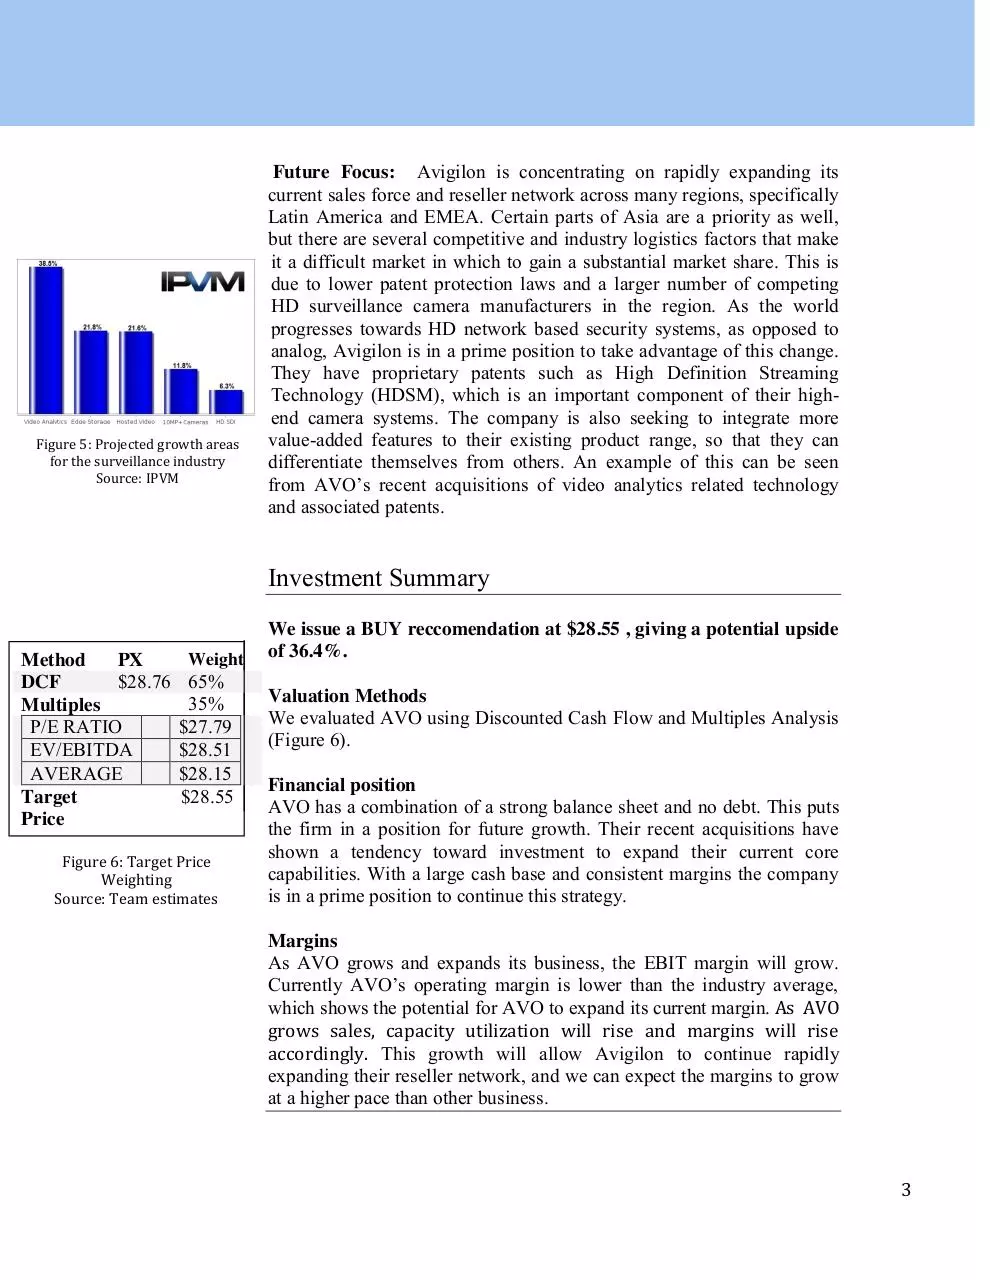
Figure 5: Projected growth areas
for the surveillance industry
Source: IPVM
Future Focus: Avigilon is concentrating on rapidly expanding its
current sales force and reseller network across many regions, specifically
Latin America and EMEA. Certain parts of Asia are a priority as well,
but there are several competitive and industry logistics factors that make
it a difficult market in which to gain a substantial market share. This is
due to lower patent protection laws and a larger number of competing
HD surveillance camera manufacturers in the region. As the world
progresses towards HD network based security systems, as opposed to
analog, Avigilon is in a prime position to take advantage of this change.
They have proprietary patents such as High Definition Streaming
Technology (HDSM), which is an important component of their highend camera systems. The company is also seeking to integrate more
value-added features to their existing product range, so that they can
differentiate themselves from others. An example of this can be seen
from AVO’s recent acquisitions of video analytics related technology
and associated patents.
Investment Summary
Method
PX
$28.76
DCF
Multiples
P/E RATIO
EV/EBITDA
AVERAGE
Target
Price
Weight
65%
35%
$27.79
$28.51
$28.15
$28.55
Figure 6: Target Price
Weighting
Source: Team estimates
We issue a BUY reccomendation at $28.55 , giving a potential upside
of 36.4%.
Valuation Methods
We evaluated AVO using Discounted Cash Flow and Multiples Analysis
(Figure 6).
Financial position
AVO has a combination of a strong balance sheet and no debt. This puts
the firm in a position for future growth. Their recent acquisitions have
shown a tendency toward investment to expand their current core
capabilities. With a large cash base and consistent margins the company
is in a prime position to continue this strategy.
Margins
As AVO grows and expands its business, the EBIT margin will grow.
Currently AVO’s operating margin is lower than the industry average,
which shows the potential for AVO to expand its current margin. As AVO
grows sales, capacity utilization will rise and margins will rise
accordingly. This growth will allow Avigilon to continue rapidly
expanding their reseller network, and we can expect the margins to grow
at a higher pace than other business.
3
Cutting Edge Technology
Avigilon seeks to remain competitive in its industry by making aqusitions
of relevant companies that have a portfolio of proprietory patents and
technology. This allows them to differentiate themselves in the market
with a unique value proposition.
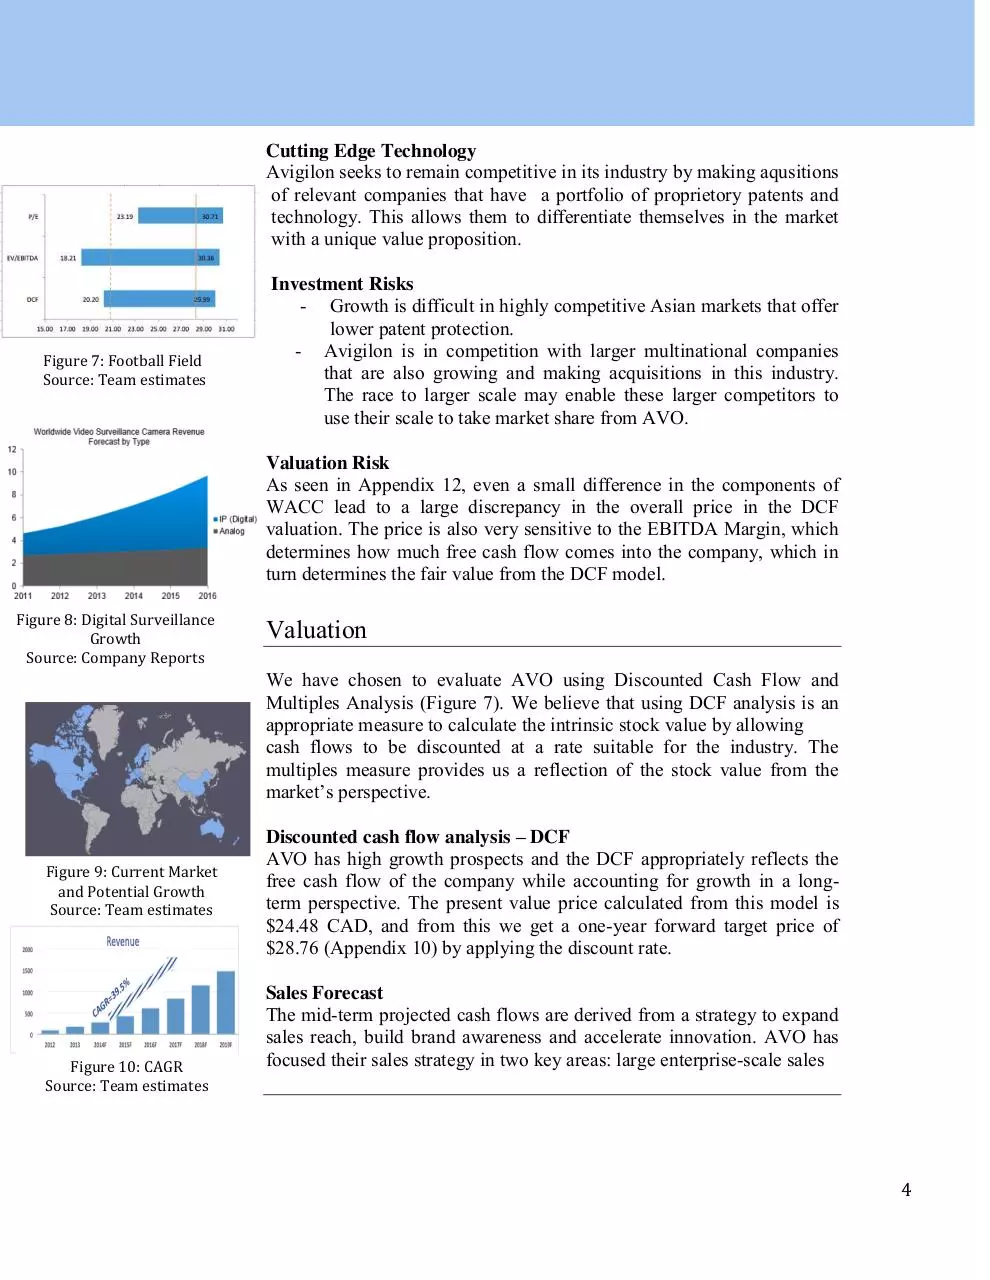
Figure 7: Football Field
Source: Team estimates
Investment Risks
- Growth is difficult in highly competitive Asian markets that offer
lower patent protection.
- Avigilon is in competition with larger multinational companies
that are also growing and making acquisitions in this industry.
The race to larger scale may enable these larger competitors to
use their scale to take market share from AVO.
Valuation Risk
As seen in Appendix 12, even a small difference in the components of
WACC lead to a large discrepancy in the overall price in the DCF
valuation. The price is also very sensitive to the EBITDA Margin, which
determines how much free cash flow comes into the company, which in
turn determines the fair value from the DCF model.
Figure 8: Digital Surveillance
Growth
Source: Company Reports
Valuation
We have chosen to evaluate AVO using Discounted Cash Flow and
Multiples Analysis (Figure 7). We believe that using DCF analysis is an
appropriate measure to calculate the intrinsic stock value by allowing
cash flows to be discounted at a rate suitable for the industry. The
multiples measure provides us a reflection of the stock value from the
market’s perspective.
Figure 9: Current Market
and Potential Growth
Source: Team estimates
Figure 10: CAGR
Source: Team estimates
Discounted cash flow analysis – DCF
AVO has high growth prospects and the DCF appropriately reflects the
free cash flow of the company while accounting for growth in a longterm perspective. The present value price calculated from this model is
$24.48 CAD, and from this we get a one-year forward target price of
$28.76 (Appendix 10) by applying the discount rate.
Sales Forecast
The mid-term projected cash flows are derived from a strategy to expand
sales reach, build brand awareness and accelerate innovation. AVO has
focused their sales strategy in two key areas: large enterprise-scale sales
4
in high growth markets and individual user sales (Figure 4). In order to
fulfill each customer’s needs, AVO has tailored their business
development team to focus on each key area’s value proposition.
Currently, AVO can develop global sales volumes by capitalizing on
sales and marketing investments to fuel further growth in North America
and other existing markets. But as the company experiences diminishing
returns (Appendix 13) on each additional customer in existing markets,
it will need to need to focus company expansion on new regions. As
shown in Figure 9, the non-highlighted regions indicate future
opportunities for development. Expanding the current reselling network
is a great opportunity for AVO to capture industry growth in these new
regions.
Figure 11: Video
Surveillance Industry
Growth
Source: Company Data
Figure 12: Industry Cycle
Source: Team Estimates
AVO’s growth comes from both the rapid development of underlying
industry growth and market share gains. As a result, sales are expected
to grow at the rate of 39.5% CAGR (Figure 10) over the next five years.
In the long term, sales growth will transition to the industry growth rate.
EBITDA Margin (Figure 13)
As AVO further expands its reach into
video analytic and video management
software, more profitable margins will be
realized as COGS per unit decreases with
increasing output of production. Early
investments with expansion of the business
have led to YoY increases in personnel to
support their business. However, with the
expansion, SG&A expenses will not rise at
a matching pace, as economies of scale will
be achieved. Therefore, the company’s
revenues will continue to grow at a stronger
pace than the associated operating costs.
Figure 13: EBITDA Margin
Source: Team Estimates
Terminal Value
The terminal growth rate that we have used in our DCF calculation is
represented by a perpetual growth of 3% from years 2030 onward to
reflect the growth rate of the global economy. Currently, we believe the
IP video surveillance industry has moved past the introduction phase of
the industry life cycle and is situated within a high growth period. We
project that this high growth period will move into the maturity stages
within roughly 5 to 10 years (Figure 12). During this maturity phase
AVO will begin to face constraints in capturing above industry growth,
and growth rate will decline toward the industry average. This aligns
with our valuation of a long-term perpetual growth rate for the global
economy.
5
Valuation Using P/E
Capex
As Avigilon attempts to target a larger global market share, it requires
significant investment in PPE to further develop their current sales
capacity of $500m (company annual report). The size of its warehouse in
Richmond, BC will be unable to sustain their projected future sales
growth. To reach these goals, Avigilon will need to upgrade the current
capacity of its warehouses and production facility, in order to compete on
a global scale. In the same line of thought, AVO’s end-to-end systems
require a significant capital investment into servers to accommodate a
larger customer base. Avigilons’ current Capex stands at 8.9 Million and
we estimate growth to 13 Million by end of 2015.
28.12x (80% Cost of Capital (WACC):
range: 23.47x- Cost of Capital is determined by the required return from both debt and
Peer Group P/E
31.08x)
equity. AVO currently does not hold debt in their capital structure and so
AVO's 1Yr
Projected EPS
AVO's 1Yr
Target Price
1 Yr Target
Price from DCF
$
0.99
$
27.79
$
28.76
Figure 14: P/E Valuation
Source: Team estimates
their fair value is discounted purely on equity financing. The cost of
equity is determined by the CAPM model, in which we have used a 10year Canadian government bond
WACC
risk-free rate of 1.60%. The
Portion of Debt = 0% Portion of Equity = 100%
expected market return is 11.46%
(Bloomberg) and AVO’s Beta has
Cost of Debt = 0% Cost of Equity = 17.50%
been calculated comparing against
= Risk Free Rate=1.60%
the S&P TSX and given us a value
+ (Beta x Market Risk Premium)=15.90%
of 1.6. Given our analysis we have
WACC = 17.50%
calculated a WACC of 17.50%
(Figure 16).
Figure 16: WACC Calculation
Source: Team Estimates
Valuation Using EV/EBITDA
Peer Group
EV/EBITDA
AVO's 1Yr
Projected
EBITDA
AVO's 1Yr
Target EV
AVO's 1Yr
Market Cap
AVO's 1Yr
Target Price
1 Yr Target
Price from DCF
17.14x (80% range:
10.55x-27.92x)
$ 70.72 Millions
$ 1212.03 Millions
$ 1327.47Millions
$ 28.51
$ 28.76
Figure 15: EV/EVIDTA
Valuation
Source: Team estimates
Multiples Valuation – Price to Earnings Ratio (Appendix 6)
Since there are no directly comparable peers to AVO, we have chosen to
base our trading multiples on a select peer group of companies. These
companies have been chosen on the basis of: product mix similarity and
level of equivalent product sales. Seven companies have been chosen and
historical P/E have been used to calculate an industry average P/E
multiple of 28.12x. Using this industry multiple and a forward EPS of
$0.99 we have calculated a fair value/share of $27.79 (Figure 14). This is
comparable to the valuation from our DCF model.
Multiples Valuation - EV/EBITDA (Appendix 7)
Using the same select peer group, we have reached an industry average
EV/EBITDA multiple of 17.14x. Using this multiple and a forward
EBITDA value of $70.7M we have reached a 1-year target EV of
$1,212M. From this value we calculate a market capitalization of
$1327.5M, which gives us a fair value/share of $28.51 (Figure 15). This
value is in line with both our DCF model and our P/E valuation.
6
Financial Summary
Figure 17: Firm/Industry
Growth
Source: Team estimates
Top Line Growth:
The revenue CAGR over the past 5 years (2008 – 2013) was 102%. This
impressive result was primarily driven by growth in market demand and
exceptionally high selling / marketing investments. Sales growth in the
future can be seen as a summation of two parts: global industry growth
serving as the base, and the firm’s market share gain providing further
growth momentum on top of the market trend (Figure 17). As the
company matures in the mid-term (2014 – 2018), we expect the company
can continue to grow market share to maintain two-digit internal growth,
but at a slower pace than at present. In the long term, we project that
AVO’s global market share will not surpass 5%. Currently, AVO has
established a network of resellers in approximately half of potential
geographic markets around the world; as the build out of the global
reseller network nears completion, the firm will face more difficulty in
achieving market share growth.
Margins:
As AVO grows and expands its
business we will see the ability to grow
its operating profitability. Currently
AVO’s EBITDA margin is 16%
compared to the industry average of
23% (Figure 18). The main driver in
increasing this margin is that the firm’s
per unit expansion costs will decline
Figure 18: EBITDA Margins
over the next several years due to
Source: Bloomberg
economies of scale. Another key factor in
AVO’s margins is the ability to maintain a
healthy level of SG&A (Appendix 11) while sustaining a higher level of
growth in revenues. Historical 5-year data shows that AVO’s SG&A as a
percentage of sales is 33.5% compared to the industry average of 27.6%.
In the course of the next 5 years we predict that AVO will be able to
moderately decrease this percentage and move closer to the industry
average.
Cash flow
Assessing the cash flow position of AVO, we see that they are
maintaining a relatively flat position in cash, due mainly to accounts
receivable staying at a constant proportion of revenues (Figure 19).
7
As well, with AVO’s necessary upgrading of capacity to expand business,
we have projected Capex to grow at a continuing percentage of sales.
This additional expenditure in combination with the constant proportion
of accounts receivable has given us an average growth in cash of roughly
4% per year.
Balance Sheet and Financing:
AVO has a strong balance sheet,
free of interest bearing debt and
with a substantial cash reserve. The
company is able to sustain its
operations and continue its growth
strategy without the need of external
financing. Their current financial
position has created a great deal of
flexibility and they can make use of
the cash reserve for acquisitions if
there are opportunities that arise in
the future.
Figure 19: Rev Growth vs A/R and
Cash Conversion Cycle
Source: Team estimates
Management
Alexander Fernandes – Cofounder and CEO: Fernandes has 20+ years
of experience leading companies that develop, manufacture and market
high-end digital imaging products, software and hardware. Fernandes was
previously CEO of Quantitative Imaging Corporation (“QImaging”).
QImaging was a developer and manufacturer of high performance
quantitative digital cameras and software for scientific imaging.
Wan Jung - CFO: Mr. Jung was Vice President of Finance for QImaging
from 2001 - 2004. Previously Jung was the Director of Finance for NIKE
Canada (14 years).
Mahesh Saptharishi – Chief Technology Officer: Served as Senior
Vice President, analytics and data science at Avigilon, and has been with
the company since its acquisition of VideoIQ Inc. He has over 17 years of
experience developing intelligent video analytics technology as well as
software and camera hardware specifically for the security industry.
Bryan Schmode - Chief Operating Officer: Mr. Schmode has
experience in sales, business development, systems engineering and the
development of growing companies in the security and software industry
(Source : Reuters).
8
Download Avigilon Corporation CFA Research Challenge Team E (1)
Avigilon Corporation_CFA Research Challenge_Team E (1).pdf (PDF, 2.39 MB)
Download PDF
Share this file on social networks
Link to this page
Permanent link
Use the permanent link to the download page to share your document on Facebook, Twitter, LinkedIn, or directly with a contact by e-Mail, Messenger, Whatsapp, Line..
Short link
Use the short link to share your document on Twitter or by text message (SMS)
HTML Code
Copy the following HTML code to share your document on a Website or Blog
QR Code to this page

This file has been shared publicly by a user of PDF Archive.
Document ID: 0000411702.