final poster ( Recovery ) (PDF)
File information
Title: Powerpoint template for scientific posters (Swarthmore College)
Author: Colin Purrington
This PDF 1.5 document has been generated by Microsoft® PowerPoint® 2010, and has been sent on pdf-archive.com on 16/08/2016 at 20:28, from IP address 197.33.x.x.
The current document download page has been viewed 388 times.
File size: 819.99 KB (1 page).
Privacy: public file
File preview
Ahmed Abd-Elbaset, Ahmed Abbas, Mohammed Tarek
Hassan Amer, Mohammed Adel, Mohammed El-Messiry
Class: 3-1, Group number: 53
STEM SCHOOL FOR BOYS
Keywords: AWL, DFG, CCS, Post-Combustion, Flue gas, Mathematical Model, CO2 Emissions.
Abstract
Methods
Results
Nowadays, our earth encounters a great increase in the
temperature causing what is called Global Warming. This beast has a
catastrophic intervention in our lifestyles, and threatens our future.
Moreover, it could destroy our current communities and put an
unexpected end to the world that we know. The overuse of fossil
fuels for industrial purposes has resulted in wide emission of
greenhouse gasses. Among theses gases is CO2 which is
considered the main factor causing negatively global warming. Our
suggested solution targets these emissions by the means of Carbon
capture and storage. The capture stage is based on sequestration of
co2 particles, in flue gas resulted from post-combustion technique,
using a chemical absorption process. Then, the products are
transported to the nearest water source and are directly injected on
the surface. These sequences are figured out through a
mathematical model describing the results after applying our solution
based on testable equations, relations and graphs. By testing our
model, we concluded that our solution can prevent an increase rate
of temperature by 0.02 Celsius by 2100.
We have chosen to apply Carbon, Capture, and Storage (CCS). First, we
will mimic the natural process, based on a chemical absorption techniques
relying on carbonate-based absorption.
Carbonate-based absorption:
Basic idea (natural process):
1- When the rain is formed, it reacts with Carbon Dioxide gas,CO2, previously
existing in the atmosphere, from flue gas, as the following chemical reaction:
(1)
2- When carbonic acid is formed, it briefly exists, in the form of H2CO3. Then,
it is carried by the air to one of the carboxylic rocks, located in the band of the
rivers. These rocks are full of silicate, and carbonate salts. One of the most
important carbonate salts is Calcium Carbonate (CaCO3).The reaction
occurs:
(2)
3- Then, Calcium Bicarbonate, Ca(HCO3)2, is drained into the river in its ionic
form, Ca2+, and (HCO3)-. Then, Bicarbonate ion moves along the river to the
ocean. There, the buffer capacity of the ocean, to uptake Carbon Dioxide from
atmosphere, will increase due to the increase in CO3 in the water. These
processes occur naturally as a carbon cycle and lead to the reduction of CO2
emissions.
Discussion
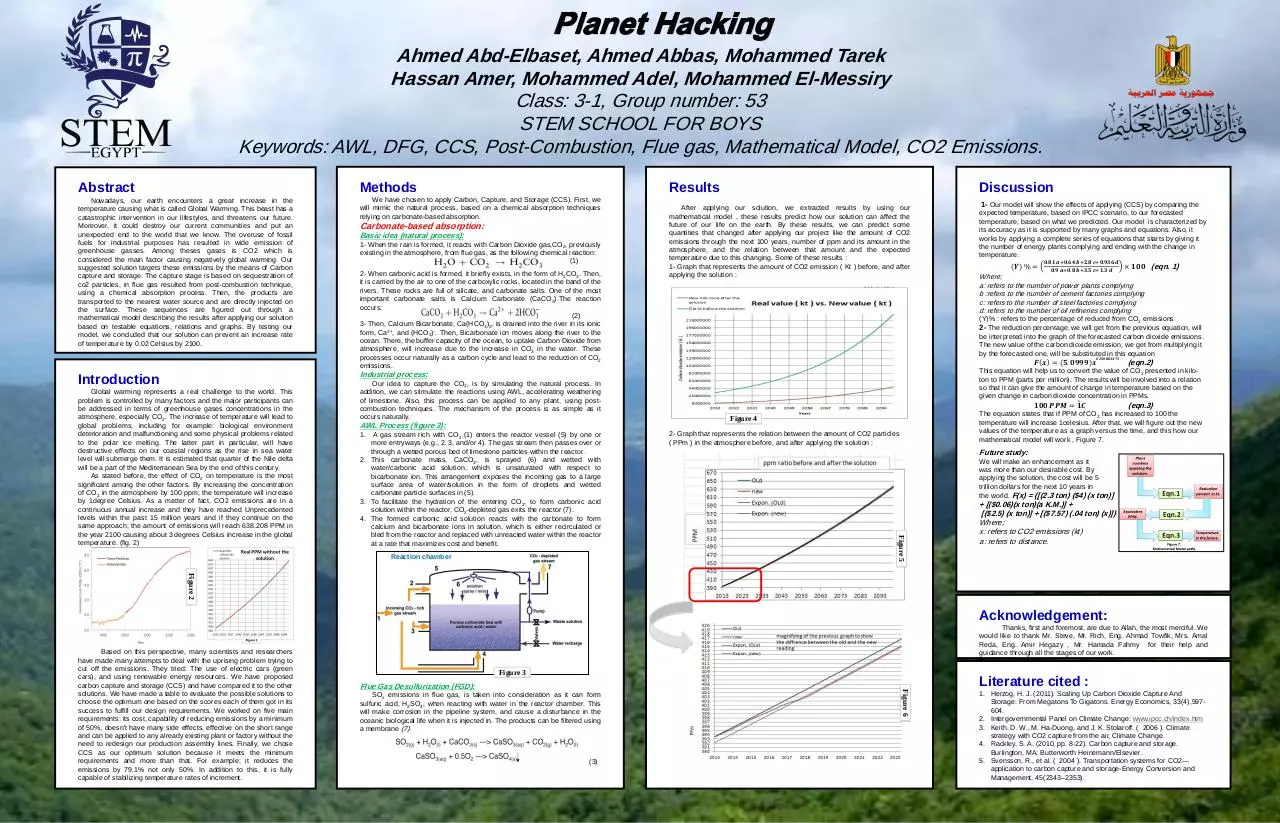
After applying our solution, we extracted results by using our
mathematical model , these results predict how our solution can affect the
future of our life on the earth. By these results, we can predict some
quantities that changed after applying our project like the amount of CO2
emissions through the next 100 years, number of ppm and its amount in the
atmosphere, and the relation between that amount and the expected
temperature due to this changing. Some of these results :
1- Graph that represents the amount of CO2 emission ( Kt ) before, and after
applying the solution :
AWL Process (figure 3):
1.
A gas stream rich with CO2 (1) enters the reactor vessel (5) by one or
more entryways (e.g., 2, 3, and/or 4). The gas stream then passes over or
through a wetted porous bed of limestone particles within the reactor.
2. This carbonate mass, CaCO3, is sprayed (6) and wetted with
water/carbonic acid solution, which is unsaturated with respect to
bicarbonate ion. This arrangement exposes the incoming gas to a large
surface area of water/solution in the form of droplets and wetted
carbonate particle surfaces in (5).
3. To facilitate the hydration of the entering CO2, to form carbonic acid
solution within the reactor, CO2-depleted gas exits the reactor (7).
4. The formed carbonic acid solution reacts with the carbonate to form
calcium and bicarbonate ions in solution, which is either recirculated or
bled from the reactor and replaced with unreacted water within the reactor
at a rate that maximizes cost and benefit.
(𝒀) % =
𝟎.𝟖𝟏 𝒂+𝟎.𝟔𝟒 𝒃+𝟐.𝟖 𝒄+𝟎.𝟗𝟑𝟔 𝒅
𝟎.𝟗 𝒂+𝟎.𝟖 𝒃+𝟑.𝟓 𝒄+𝟏.𝟑 𝒅
× 𝟏𝟎𝟎 (eqn. 1)
Where;
a: refers to the number of power plants complying
b :refers to the number of cement factories complying
c: refers to the number of steel factories complying
d: refers to the number of oil refineries complying
𝟎 𝟐𝟓𝟎𝟖𝟎𝟑𝟒𝟕𝟓
𝑭 𝒙 = (𝟓. 𝟎𝟗𝟗𝟗)𝒙
(eqn.2)
This equation will help us to convert the value of CO2 presented in kiloton to PPM (parts per million). The results will be involved into a relation
so that it can give the amount of change in temperature based on the
given change in carbon dioxide concentration in PPMs.
𝟏𝟎𝟎 𝑷𝑷𝑴 = 𝟏𝑪
(eqn.3)
The equation states that if PPM of CO2 has increased to 100 the
temperature will increase 1celesius. After that, we will figure out the new
values of the temperature as a graph versus the time, and this how our
mathematical model will work , Figure 7.
Figure 4
2- Graph that represents the relation between the amount of CO2 particles
( PPm ) in the atmosphere before, and after applying the solution :
Future study:
We will make an enhancement as it
was more than our desirable cost. By
applying the solution, the cost will be 5
trillion dollars for the next 10 years in
the world. F(x) = {[(2.3 ton) ($4) (x ton)]
Figure 5
Global warming represents a real challenge to the world. This
problem is controlled by many factors and the major participants can
be addressed in terms of greenhouse gases concentrations in the
atmosphere, especially CO2. The increase of temperature will lead to
global problems, including for example: biological environment
deterioration and malfunctioning and some physical problems related
to the polar ice melting. The latter part in particular, will have
destructive effects on our coastal regions as the rise in sea water
level will submerge them. It is estimated that quarter of the Nile delta
will be a part of the Mediterranean Sea by the end of this century.
As stated before, the effect of CO2 on temperature is the most
significant among the other factors. By increasing the concentration
of CO2 in the atmosphere by 100 ppm, the temperature will increase
by 1degree Celsius. As a matter of fact, CO2 emissions are in a
continuous annual increase and they have reached Unprecedented
levels within the past 15 million years and if they continue on the
same approach, the amount of emissions will reach 638.208 PPM in
the year 2100 causing about 3 degrees Celsius increase in the global
temperature. (fig. 2)
Our idea to capture the CO2, is by simulating the natural process. In
addition, we can stimulate the reactions using AWL, accelerating weathering
of limestone. Also, this process can be applied to any plant, using postcombustion techniques. The mechanism of the process is as simple as it
occurs naturally.
expected temperature, based on IPCC scenario, to our forecasted
temperature, based on what we predicted. Our model is characterized by
its accuracy as it is supported by many graphs and equations. Also, it
works by applying a complete series of equations that starts by giving it
the number of energy plants complying and ending with the change in
temperature.
(Y)% : refers to the percentage of reduced from CO2 emissions
2- The reduction percentage, we will get from the previous equation, will
be interpreted into the graph of the forecasted carbon dioxide emissions.
The new value of the carbon dioxide emission, we get from multiplying it
by the forecasted one, will be substituted
in this equation
.
Industrial process:
Introduction
1- Our model will show the effects of applying (CCS) by comparing the
Reaction chamber
+ [($0.06)(x ton)(a K.M.)] +
[($2.5) (x ton)] + [($7.57) (.04 ton) (x)]}
Where;
x: refers to CO2 emissions (kt)
a: refers to distance.
Figure 2
Acknowledgement:
Figure 3
Flue Gas Desulfurization (FGD):
SOx emissions in flue gas, is taken into consideration as it can form
sulfuric acid, H2SO4, when reacting with water in the reactor chamber. This
will make corrosion in the pipeline system, and cause a disturbance in the
oceanic biological life when it is injected in. The products can be filtered using
a membrane (7).
(3)
Acknowledgments
Thanks , first and foremost, are due to Allah, the most merciful. We’d
like to
Literature cited :
Figure 6
Based on this perspective, many scientists and researchers
have made many attempts to deal with the uprising problem trying to
cut off the emissions. They tried: The use of electric cars (green
cars), and using renewable energy resources. We have proposed
carbon capture and storage (CCS) and have compared it to the other
solutions. We have made a table to evaluate the possible solutions to
choose the optimum one based on the scores each of them got in its
success to fulfill our design requirements. We worked on five main
requirements: its cost, capability of reducing emissions by a minimum
of 50%, doesn't have many side effects, effective on the short range
and can be applied to any already existing plant or factory without the
need to redesign our production assembly lines. Finally, we chose
CCS as our optimum solution because it meets the minimum
requirements and more than that. For example; it reduces the
emissions by 79.1% not only 50%. In addition to this, it is fully
capable of stabilizing temperature rates of increment.
Thanks, first and foremost, are due to Allah, the most merciful .We
would like to thank Mr. Steve, Mr. Rich, Eng. Ahmad Towfik, Mrs. Amal
Reda, Eng. Amir Hegazy , Mr. Hamada Fahmy for their help and
guidance through all the stages of our work.
1. Herzog, H. J. (2011). Scaling Up Carbon Dioxide Capture And
Storage: From Megatons To Gigatons. Energy Economics, 33(4),597604.
2. Intergovernmental Panel on Climate Change: www.ipcc.ch/index.htm
3. Keith, D. W., M. Ha-Duong, and J. K. Stolaroff. ( 2006 ). Climate
strategy with CO2 capture from the air, Climate Change.
4. Rackley, S. A. (2010, pp. 8-22). Carbon capture and storage.
Burlington, MA: Butterworth Heinemann/Elsevier.
5. Svensson, R., et al. ( 2004 ). Transportation systems for CO2—
application to carbon capture and storage,Energy Conversion and
Management, 45(2343–2353).
Download final poster ( Recovery )
final poster ( Recovery ).pdf (PDF, 819.99 KB)
Download PDF
Share this file on social networks
Link to this page
Permanent link
Use the permanent link to the download page to share your document on Facebook, Twitter, LinkedIn, or directly with a contact by e-Mail, Messenger, Whatsapp, Line..
Short link
Use the short link to share your document on Twitter or by text message (SMS)
HTML Code
Copy the following HTML code to share your document on a Website or Blog
QR Code to this page

This file has been shared publicly by a user of PDF Archive.
Document ID: 0000414310.