Assignment2 (PDF)
File information
Title: Assignment2_1
Author: Parth Patki
This PDF 1.3 document has been generated by Preview / Mac OS X 10.12 Quartz PDFContext, and has been sent on pdf-archive.com on 07/09/2016 at 02:50, from IP address 199.204.x.x.
The current document download page has been viewed 282 times.
File size: 75.67 KB (2 pages).
Privacy: public file

File preview
ENGR 131
Name 1
Parth Patki
Purdue login 1 ppatki
Name 3
Purdue login 3
Name 2
Purdue login 2
Name 4
Purdue login 4
Section number
Team number
Assignment
Academic Integrity Statement: I/We have not used material obtained from any other unauthorized source, either modified or unmodified.
Neither have I/we provided access to my/our work to another. The solution I/we am/are submitting is my/our own original work.
Determine when the sensors are subjected to the same conditions if any differences exist in the temperature measurments.
Imported Data
Time (seconds) Sensor A Temperature (degrees F) Sensor B Temperature (degrees F)
0
120
120
10
121.4
123.4
20
122.6
125.7
30
123.5
127.8
40
124.8
128.5
50
125.9
128.9
60
126.4
129.3
70
126.9
129.8
80
127.2
129.9
90
128.3
130
100
128.9
130
110
129.4
130
120
129.6
130
130
129.8
130
140
129.9
130
150
130
130
160
130
130
170
130
130
180
130
130
Plot of Temperatures
Answers to Questions
a) The data generated by this test apparatus is continuous and numerical. This is because the data (both x
and y) can take on any value within a range. Hence a scatterplot is the best type of plot to represent this type
of data. Also the data is measured not theoretical because it is not calculated but instead measured.
Temperature of two sensors over time
131
130
b) Temperature sensor B has a faster response time. This is because temperature sensor B reaches 130
degrees F (maximum temperature) before Temperature sensor A.
129
128
Temperature (degrees F)
Problem
Description
c) Temperature sensor B has a faster response time than Temperature sensor A. Follow the diagram.
127
126
Sensor A
125
Sensor B
View from above
124
123
122
121
120
0
20
40
60
80
100
Time (seconds)
120
140
160
180
Sensor A
Sensor B
Size of Thermocouple = 0.35 in
Size of Thermocouple = 0.45 in
Size of Thermowell = 0.50 in
Size of Thermowell = 0.50 in
In Sensor A, there is more space between the thermowell and the thermocouple. When the temperature is
recorded, some heat may be lost in that space. On the other hand, in sensor B there is less space between
the thermowell and the thermocouple so the chances of heat being lost to the surroundings decreases and
leads to a more accurate response time.
Problem
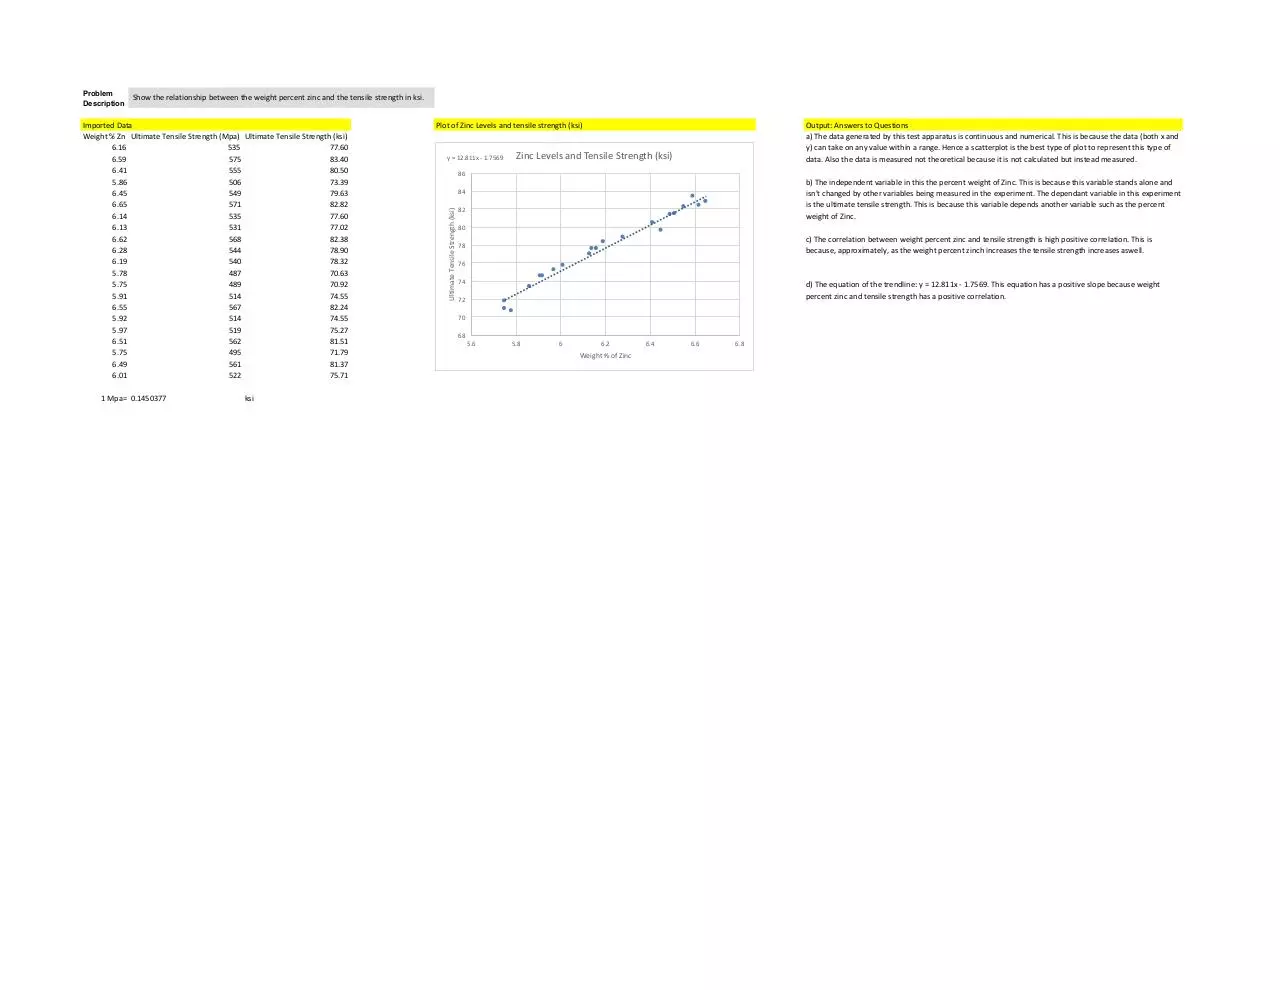
Show the relationship between the weight percent zinc and the tensile strength in ksi.
Description
1 Mpa= 0.1450377
ksi
Plot of Zinc Levels and tensile strength (ksi)
y = 12.811x - 1.7569
Output: Answers to Questions
a) The data generated by this test apparatus is continuous and numerical. This is because the data (both x and
y) can take on any value within a range. Hence a scatterplot is the best type of plot to represent this type of
data. Also the data is measured not theoretical because it is not calculated but instead measured.
Zinc Levels and Tensile Strength (ksi)
86
b) The independent variable in this the percent weight of Zinc. This is because this variable stands alone and
isn't changed by other variables being measured in the experiment. The dependant variable in this experiment
is the ultimate tensile strength. This is because this variable depends another variable such as the percent
weight of Zinc.
84
Ultimate Tensile Strength (ksi)
Imported Data
Weight % Zn Ultimate Tensile Strength (Mpa) Ultimate Tensile Strength (ksi)
6.16
535
77.60
6.59
575
83.40
6.41
555
80.50
5.86
506
73.39
6.45
549
79.63
6.65
571
82.82
6.14
535
77.60
6.13
531
77.02
6.62
568
82.38
6.28
544
78.90
6.19
540
78.32
5.78
487
70.63
5.75
489
70.92
5.91
514
74.55
6.55
567
82.24
5.92
514
74.55
5.97
519
75.27
6.51
562
81.51
5.75
495
71.79
6.49
561
81.37
6.01
522
75.71
82
80
c) The correlation between weight percent zinc and tensile strength is high positive correlation. This is
because, approximately, as the weight percent zinch increases the tensile strength increases aswell.
78
76
74
d) The equation of the trendline: y = 12.811x - 1.7569. This equation has a positive slope because weight
percent zinc and tensile strength has a positive correlation.
72
70
68
5.6
5.8
6
6.2
Weight % of Zinc
6.4
6.6
6.8
Download Assignment2
Assignment2.pdf (PDF, 75.67 KB)
Download PDF
Share this file on social networks
Link to this page
Permanent link
Use the permanent link to the download page to share your document on Facebook, Twitter, LinkedIn, or directly with a contact by e-Mail, Messenger, Whatsapp, Line..
Short link
Use the short link to share your document on Twitter or by text message (SMS)
HTML Code
Copy the following HTML code to share your document on a Website or Blog
QR Code to this page

This file has been shared publicly by a user of PDF Archive.
Document ID: 0000480665.