SFRAPStatsProject (PDF)
File information
This PDF 1.5 document has been generated by / Skia/PDF m55, and has been sent on pdf-archive.com on 12/10/2016 at 01:56, from IP address 75.145.x.x.
The current document download page has been viewed 447 times.
File size: 442.01 KB (8 pages).
Privacy: public file


File preview
AP Statistics Correlation Project
Questions:
1) How many pets do you have?
2) How many people live in your household (including you)?
Data Collection:
I created a Google Form with these questions that were answered using a number scale of
0 to 10 for number of pets and 1 to 10 for number of people. I then posted this form on
www.reddit.com/r/SampleSize/ for users to anonymously submit their data. This analysis is done
based on 300 responses to the survey.
1) Individual Variables
The histogram looking at the variable for pet ownership is generally skewed right. There
is a bump at 10 pets, but this is most likely because the instructions were to choose 10 for any
number greater than 10. With a maximum value, there are no noticeable outliers - it seems to just
standardly flatten out towards infinity. There might be outliers with more accurate data and more
responses, but none can be noticed here. The center lies towards the lower end of the spectrum,
as the median lies under 1 pet. The data has an interquartile range of 2, so most of the data
generally stays reasonably close to the center.
The shape of the graph is skewed right, as there are peaks towards the lower end of the
spectrum, and the data appears to flatten out as you approach the maximum. There do not seem
to be any outliers, as the data as a pretty standard skewed right shape, but there is the same
problem that 10 accounts for 10 or greater. From the information that we have, there appear to be
no outliers. The median lies under 3 people, and the interquartile range of 2 seems to show that
data rarely goes outside of that general center.
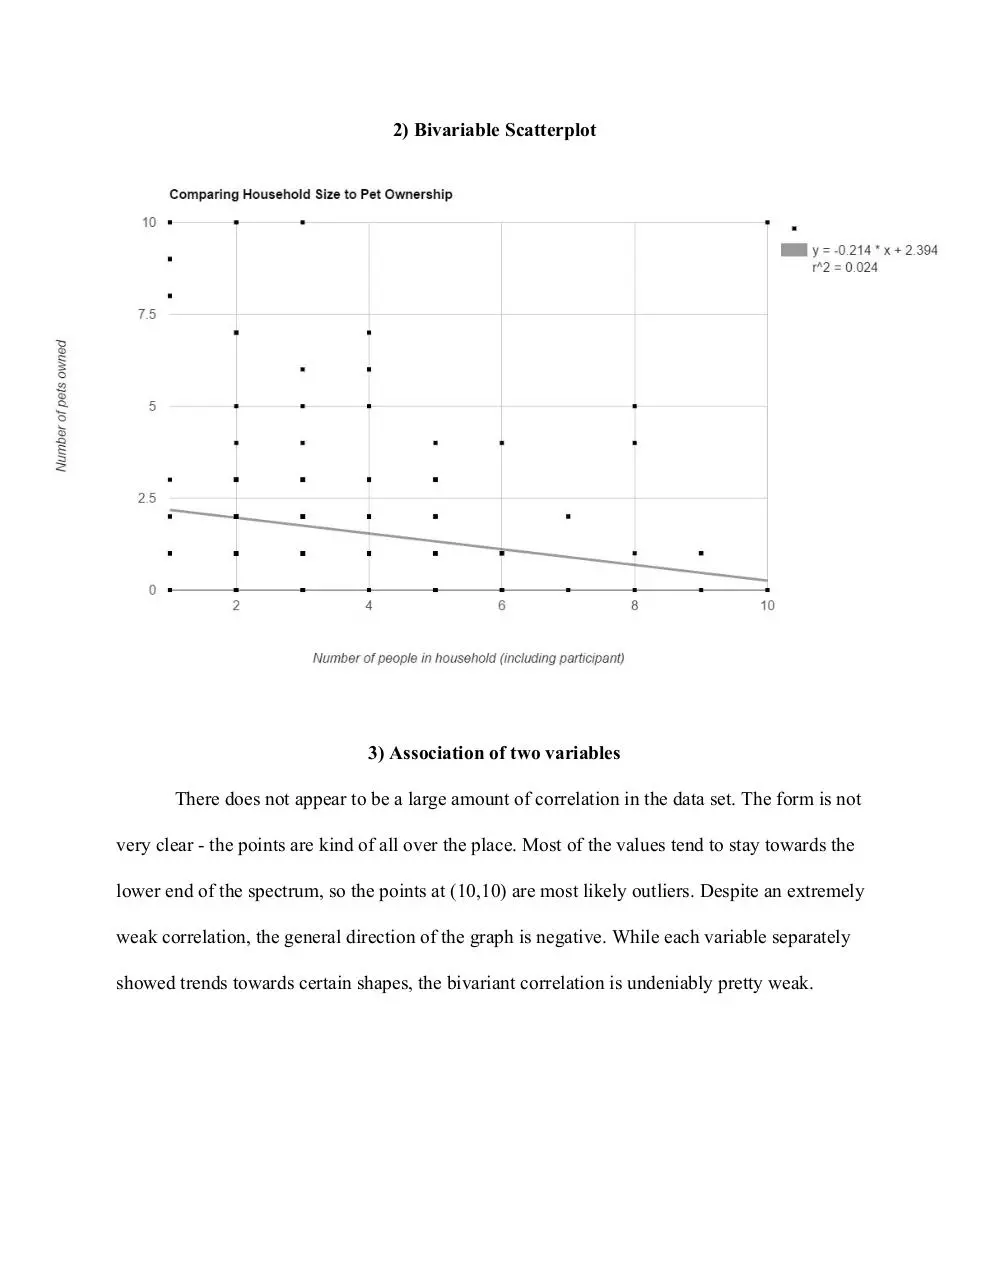
2) Bivariable Scatterplot
3) Association of two variables
There does not appear to be a large amount of correlation in the data set. The form is not
very clear - the points are kind of all over the place. Most of the values tend to stay towards the
lower end of the spectrum, so the points at (10,10) are most likely outliers. Despite an extremely
weak correlation, the general direction of the graph is negative. While each variable separately
showed trends towards certain shapes, the bivariant correlation is undeniably pretty weak.
4) Least Squares Regression Line
The least squares regression line (LSRL) is calculated to be Pets = 2.394 - 0.214 * People.
5) Correlation and Coefficient of Variation
The correlation of our data is indicated by our r value of approximately 0.155. Squaring
this value gives us only 0.024, meaning that the number of people in a household only explains
the number of pets owned by 2.4%. That is a very low percentage, and indicates that our initial
idea of a low correlation is likely true.
The coefficient of variation can help show how much each variable deviates in terms of
its own center. We find this by dividing the standard deviation of a data set by its mean:
Coefficient of Variation for people = σx / x̄= 1.717 / 3.337 = 0.514
Coefficient of Variation for pets = σy / ȳ = 2.386 / 1.687 = 1.415
This tells us that our data for people was less variable than our data for pets.
6) Interpolating the data
Let’s say we want to know how many pets I would have. I have three people in my
household: me, my mom, and my dad. This would be interpolation, since it falls within our data
range of 1 to 10 people. To find out my predicted number of pets, I would plug in my household
size into our LSRL equation:
Pets = 2.394 - 0.214 * People
Pets = 2.394 - 0.214 * 3
Pets = 1.752
Considering the fact that it would be gross to have a fraction of a pet, we can round and
assume that I have 2 pets. In reality I have 3 pets, which means that the LSRL is not very
indicative of a given piece of data.
7) Extrapolating the data
Now let’s say that we want to know how many pets a very large family would have. I’m
going to go with a household size of 25 people. This would be extrapolation, since it falls outside
our data range of 1 to 10 people. Extrapolation is oftentimes inaccurate, but it can sometimes
interesting to find out what our prediction would show. I would perform the same calculation
with my new number by plugging in my household size into the LSRL equation:
Pets = 2.394 - 0.214 * People
Pets = 2.394 - 0.214 * 25
Pets = -2.956
Clearly, this does not make a whole lot of sense. Even once we make it a little more
logical by rounding it to -3 pets, the idea of negative pets still does not seem to feel right. This is
a great example of how inaccurate extrapolation is, and also is an indicator of how weakly our
data is correlated.
8) Conclusion
Overall, it is pretty clear that there is not a strong correlation between the number of
people in a household and how many pets they own. There is a very small amount of
predictability, as the numbers for each variable seem to separately fall within their own general
ranges, but the reality is that one variable cannot reliably predict the other.
The main confounding factor would be the fact that a data value of 10 also counts any
value above 10, but considering 10 was 3.7% of the pet ownership data and 1% of the household
size data, it probably did not affect the overall correlation too heavily.
It is safe to say that this data does not imply that household size is at all indicative of pet
ownership.
Download SFRAPStatsProject
SFRAPStatsProject.pdf (PDF, 442.01 KB)
Download PDF
Share this file on social networks
Link to this page
Permanent link
Use the permanent link to the download page to share your document on Facebook, Twitter, LinkedIn, or directly with a contact by e-Mail, Messenger, Whatsapp, Line..
Short link
Use the short link to share your document on Twitter or by text message (SMS)
HTML Code
Copy the following HTML code to share your document on a Website or Blog
QR Code to this page

This file has been shared publicly by a user of PDF Archive.
Document ID: 0000493455.