Final Conservative Party Paper (PDF)
File information
Title: Microsoft Word - Final Conservative Party Paper.docx
This PDF 1.5 document has been generated by Word / Mac OS X 10.10.4 Quartz PDFContext, and has been sent on pdf-archive.com on 02/11/2016 at 11:44, from IP address 62.25.x.x.
The current document download page has been viewed 520 times.
File size: 60.75 MB (38 pages).
Privacy: public file


File preview
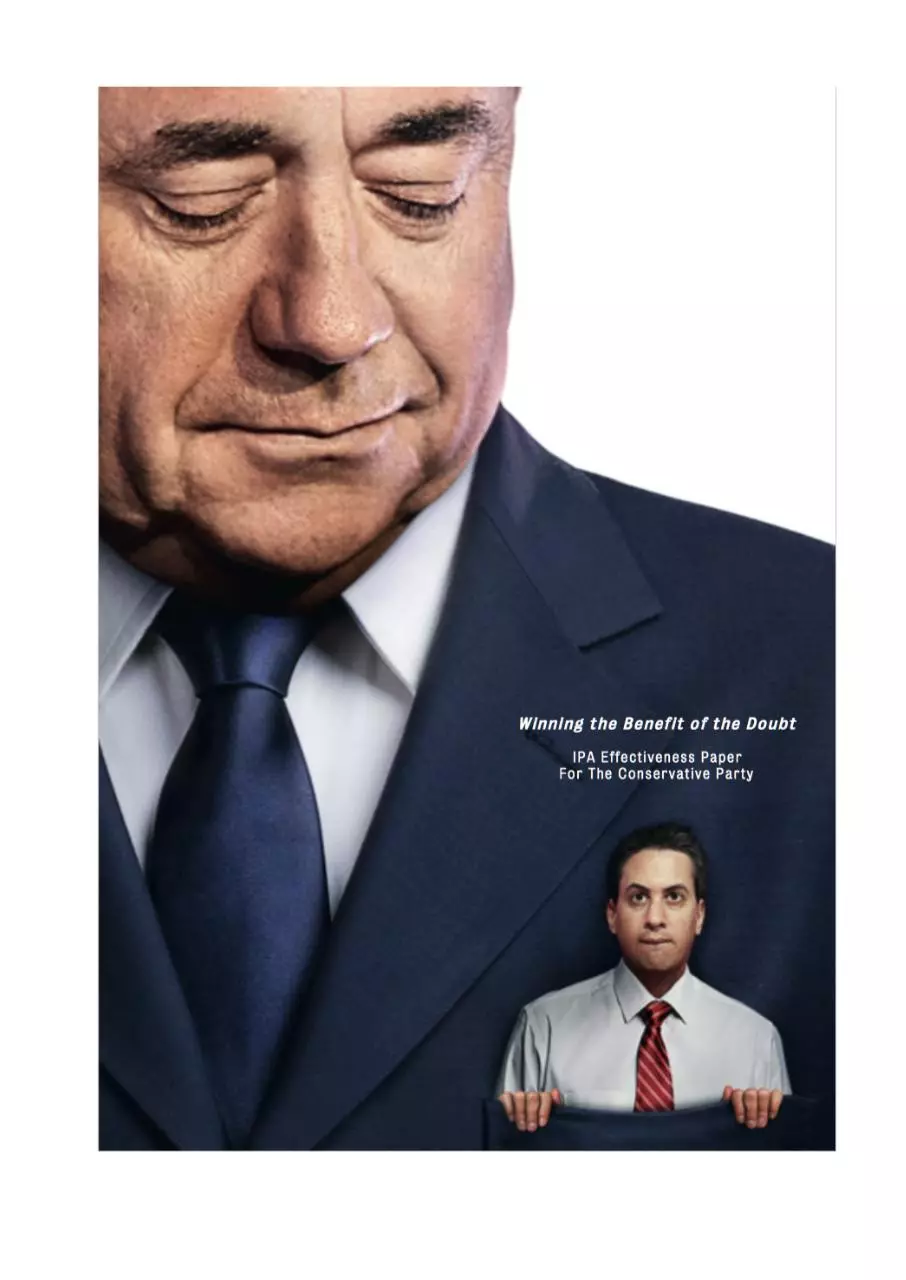
Winning the Benefit of the Doubt
IPA Effectiveness Paper
Client: The Conservative Party
Agency: M&C Saatchi
Principal Author: Richard Storey
Contributing Author: Steve Parker
2
3
Summary
This paper explores the role communications played in helping the Conservatives secure a General
Election victory most commentators, pollsters and voters didn’t expect.
Specifically, we show the marginal effect paid-for advertising had over and above the omni-channel
communications onslaught that characterises elections.
The 2015 Election was shaped by six parties, not the usual two or three. So, the concept of swinging
voters from Labour to Conservative was superseded by a strategy of swaying supporters of other
parties.
Forensic up-weighting of Target constituencies swayed the borderline decisions of marginal voters
considering voting for ‘others’.
Seat by seat analysis pinpoints the decisive contribution this activity made. Without it, an outright
majority would not have been won.
With the binary organisational objective met, we assess payback under the new criterion of
Reasonable Utilisation of Marketing Assets, against which the campaign made a more than
reasonable return.
4
5
An Abnormal Market
General Elections are quite unlike most markets evaluated for IPA Effectiveness submissions.
The product is sold over one 15 hour period every five years1.
Between these periods, there’s much influence, brand repositioning, packaging change, product
reformulation and a surfeit of brand tracking.
But sales on the day is the only measure that counts.
Purchase is ‘free’, but customers know there’s some cost to themselves, their families, communities
and country. Judging the nature, extent and personal impact of that cost is key to the purchase
decision.
Brands are fairly consistent nationally, but only offer ‘local’ products, with variation in delivery and
presentation.
Competitive choice varies locally. The constituency system makes this critical. Under ‘First past the
post’, the brand leader isn’t the one purchased most nationally, but the one purchased most in more
places.
Distribution of sales is therefore critical, especially relative to competitors.
Seat Distribution
General Election Result 2010
Source: BBC
This highlights the peculiarity that a customer’s choice doesn’t necessarily deliver them that choice.
Who they choose instead of can be as significant.
We’ll see the implication of this for the Conservatives’ 2015 strategy and its evaluation, beginning
with the prognosis.
1
The 2015 General Election was the first held since the 2011 Fixed Term Parliaments Act and so took place 5 years after the 2010
Election. Previously, scheduling of the election was at the incumbent’s choosing, (unless forced by a vote of no confidence), with the mean
interval of a little over 4 years.
6
Prognosis
The Conservatives weren’t expected to win.
Incumbent governments, irrespective of party, typically lose votes and seats. Since 1832, the
governing party seeking re-election lost on average 3.9% of the vote and 59 seats2.
Change in Votes and Seats of Incumbents Seeking Re-election
Change in number of seats held
Change in share of vote (%)
100%
5.0%
0%
0.0%
!100%
!5.0%
!200%
!10.0%
!300%
!15.0%
!400%
Vote
1835%
1837%
1841%
1847%
1852%
1857%
1859%
1865%
1868%
1874%
1880%
1885%
1886%
1892%
1895%
1900%
1906%
1910%
1910%
1918%
1922%
1923%
1924%
1929%
1931%
1935%
1945%
1950%
1951%
1944%
1959%
1964%
1966%
1970%
1974%
1974%
1979%
1983%
1987%
1992%
1997%
2001%
2005%
2010%
Share
!20.0%
Source: Politics Resources
The last Prime Minister in office for over 18 months who increased vote share was Lord Salisbury in
1900, at the height of the Boer war. Every established incumbent since, including Thatcher and Blair,
lost share3.
Polling suggested that would happen again, predicting a 33.7% Conservative share, compared to
36.1% in 2010, suggesting a loss of 34 seats4.
Furthermore, although relatively well funded, the Conservatives had less to spend than in previous
elections, with considerable less available for advertising5.
Conservative Campaign Spend & Proportion Spent on Advertising
17.9%
16.7%
15.6%
12.8%
Spend (£m)
8.2%
7.5%
Total%
4.4%
45.8%
Adver7sing%
3.6%
44.9%
34.4%
2001%
23.1%
2005%
2010%
2015%
Source: Electoral Commission
Effective asset deployment would be key.
2
Source: Politics Resources. With population and boundary changes, the number of seats in Parliament has varied between elections,
invalidating changes in seat numbers as a meaningful measure for some years.
3
John Major in 1992 was the last Premier to increase share of vote. But he was relatively newly installed as party leader.
4
Source: Poll of polls, 8 January 2015. The 2010 figure is actual, not a poll. As we’ll see, the distinction between the two is critical.
5
Source: Electoral Commission. Under Election rules, all campaign spend must be declared, together with invoices. This includes spend
on manifesto, PR, broadcasts, admin and overheads, transport, rallies and events, unsolicited materials and market research.
Conservative advertising spend was reduced in favour of, amongst other things, greater investment in market research. Advertising
spend includes paid-for digital activity.
7
Base strategy
The bedrock of the strategy was a national push to shore up Conservative votes by a). Increasing
Conservative voters’ likelihood to actually vote and b). Ensuring they didn’t defect.
The factor most likely to influence voters was confidence in handling the economy; This was twice as
influential for intending Conservative voters.
Labour voters were more influenced by cost of living and healthcare, which became central planks
of Labour’s strategy. However, wooing these voters wasn’t a key priority.
Importance of The Economy to Voting Intention
Single most important issue that
will influence how you vote (%)
40"
All"Voters"
Conserva3ve"
30"
20"
45.8%
10"
44.9%
34.4%
0"
Economy
23.1%
Immigration Healthcare Cost of living
Welfare
Education
Other
Housing
Pensions
Crime
Defence
Environment
Source: BMG, May 2015
Importance of The Economy to Voting Intention
Single most important issue that
will influence how you vote (%)
40"
All"Voters"
Labour"
30"
20"
10"
0"
Economy" Immigra2on" Healthcare" Cost"of"living" Welfare"
Educa2on"
Other"
Housing"
Pensions"
Crime"
Defence" Environment"
Source: BMG, May 2015
Labour were not well regarded on handling the economy amongst Conservative voters and a key
theme of the 2010-15 Coalition Government had been reducing the deficit and returning the
economy to growth.
The Recovering Economy
Annual GDP £ bn
1800$
1700$
1600$
1500$
2007$
2008$
2009$
2010$
2011$
2012$
2013$
2014$
2015$
Source: ONS,
8
So, the Conservatives adopted the narrative; ‘The economy is recovering, don’t let Labour wreck it
(again)’. This was tightly controlled across all communications channels, from party-election
broadcasts to hustings6.
Example Communications
The second most influential factor was suitability for Prime Minister, the leader of either party with
the higher rating having won the last nine elections.
Importance of Perceived Suitability for Prime Minister
Party leader satisfaction rating on eve of election, by ultimate outcome
Source: YouGov Dec 2014
David Cameron was a key asset compared with Ed Miliband or Nick Clegg. This was particularly true
amongst supporters of each party.
6
Most digital activity was created by Craig Elder and Tom Edmonds with the Conservative’s in house communications unit. Posters and
some election broadcasts were produced by M&C Saatchi. The remaining activity was created in house.
9
Download Final Conservative Party Paper
Final Conservative Party Paper.pdf (PDF, 60.75 MB)
Download PDF
Share this file on social networks
Link to this page
Permanent link
Use the permanent link to the download page to share your document on Facebook, Twitter, LinkedIn, or directly with a contact by e-Mail, Messenger, Whatsapp, Line..
Short link
Use the short link to share your document on Twitter or by text message (SMS)
HTML Code
Copy the following HTML code to share your document on a Website or Blog
QR Code to this page

This file has been shared publicly by a user of PDF Archive.
Document ID: 0000502583.