BWA 10 3Q StrongFutureSlides (PDF)
File information
Title: PowerPoint Presentation
This PDF 1.4 document has been generated by Acrobat PDFMaker 8.1 for PowerPoint / Acrobat Distiller 8.1.0 (Windows), and has been sent on pdf-archive.com on 10/11/2016 at 16:23, from IP address 217.111.x.x.
The current document download page has been viewed 326 times.
File size: 804.32 KB (37 pages).
Privacy: public file

File preview
A Proud Past
A Strong Future
October 2010
Our Beliefs
Respect
Collaboration
Excellence
Integrity
Community
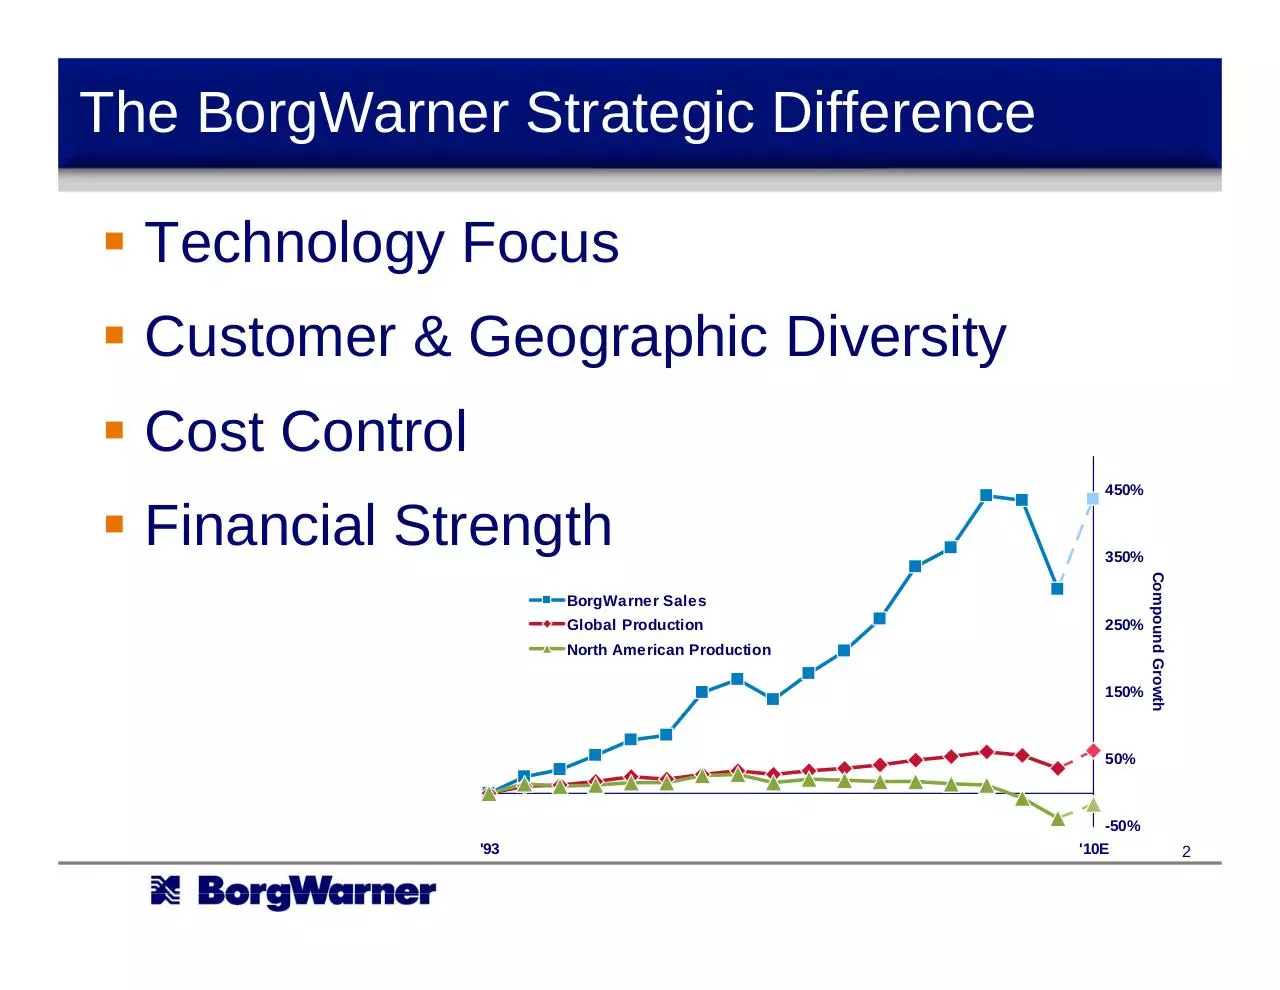
The BorgWarner Strategic Difference
Technology Focus
Customer & Geographic Diversity
Cost Control
Financial Strength
450%
350%
Global Production
250%
North American Production
150%
Compound Growth
BorgWarner Sales
50%
'93
-50%
'10E
2
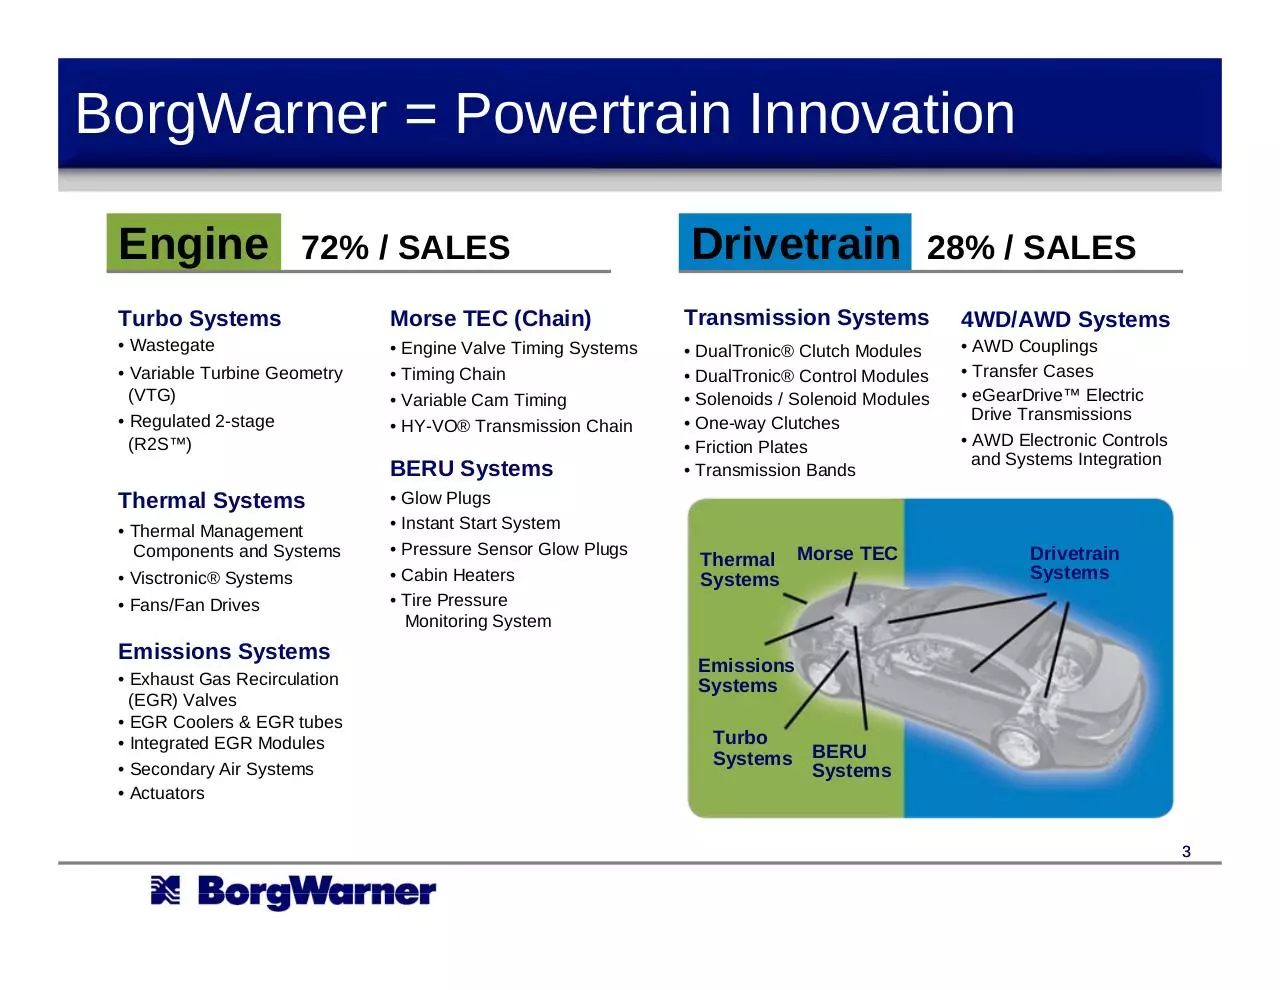
BorgWarner = Powertrain Innovation
Engine
72% / SALES
Drivetrain
28% / SALES
Turbo Systems
Morse TEC (Chain)
Transmission Systems
4WD/AWD Systems
• Wastegate
• Engine Valve Timing Systems
• Timing Chain
• Variable Cam Timing
• HY-VO® Transmission Chain
• DualTronic® Clutch Modules
• DualTronic® Control Modules
• Solenoids / Solenoid Modules
• One-way Clutches
• Friction Plates
• Transmission Bands
• AWD Couplings
• Transfer Cases
• eGearDrive™ Electric
Drive Transmissions
• AWD Electronic Controls
and Systems Integration
• Variable Turbine Geometry
(VTG)
• Regulated 2-stage
(R2S™)
BERU Systems
Thermal Systems
• Thermal Management
Components and Systems
• Visctronic® Systems
• Fans/Fan Drives
Emissions Systems
• Exhaust Gas Recirculation
(EGR) Valves
• EGR Coolers & EGR tubes
• Integrated EGR Modules
• Secondary Air Systems
• Actuators
• Glow Plugs
• Instant Start System
• Pressure Sensor Glow Plugs
• Cabin Heaters
• Tire Pressure
Monitoring System
Thermal Morse TEC
Systems
Drivetrain
Systems
Emissions
Systems
Turbo
Systems
BERU
Systems
3
Customer Diversity Worldwide
2010 Sales Outlook*
Toyota 6%
VW/Audi 16%
Daimler
6%
Ford
4%
BMW
3%
3%
Fiat
Renault/
3%
Nissan
1%
GM
1%
PSA
Commercial
Vehicles 3%
10%
Other
Americas
Asia
Europe
~25%* 29%**
~25%* 15%**
~50%* 56%**
Hyundai/Kia 3%
Honda 2%
Renault/Nissan 1%
China 5%
Other 7%
Ford
GM
Chrysler
Asian OEMs
Aftermarket
Commercial Vehicles
Other
7%
3%
2%
2%
1%
6%
5%
4
*
**
NSK-Warner included
NSK-Warner excluded
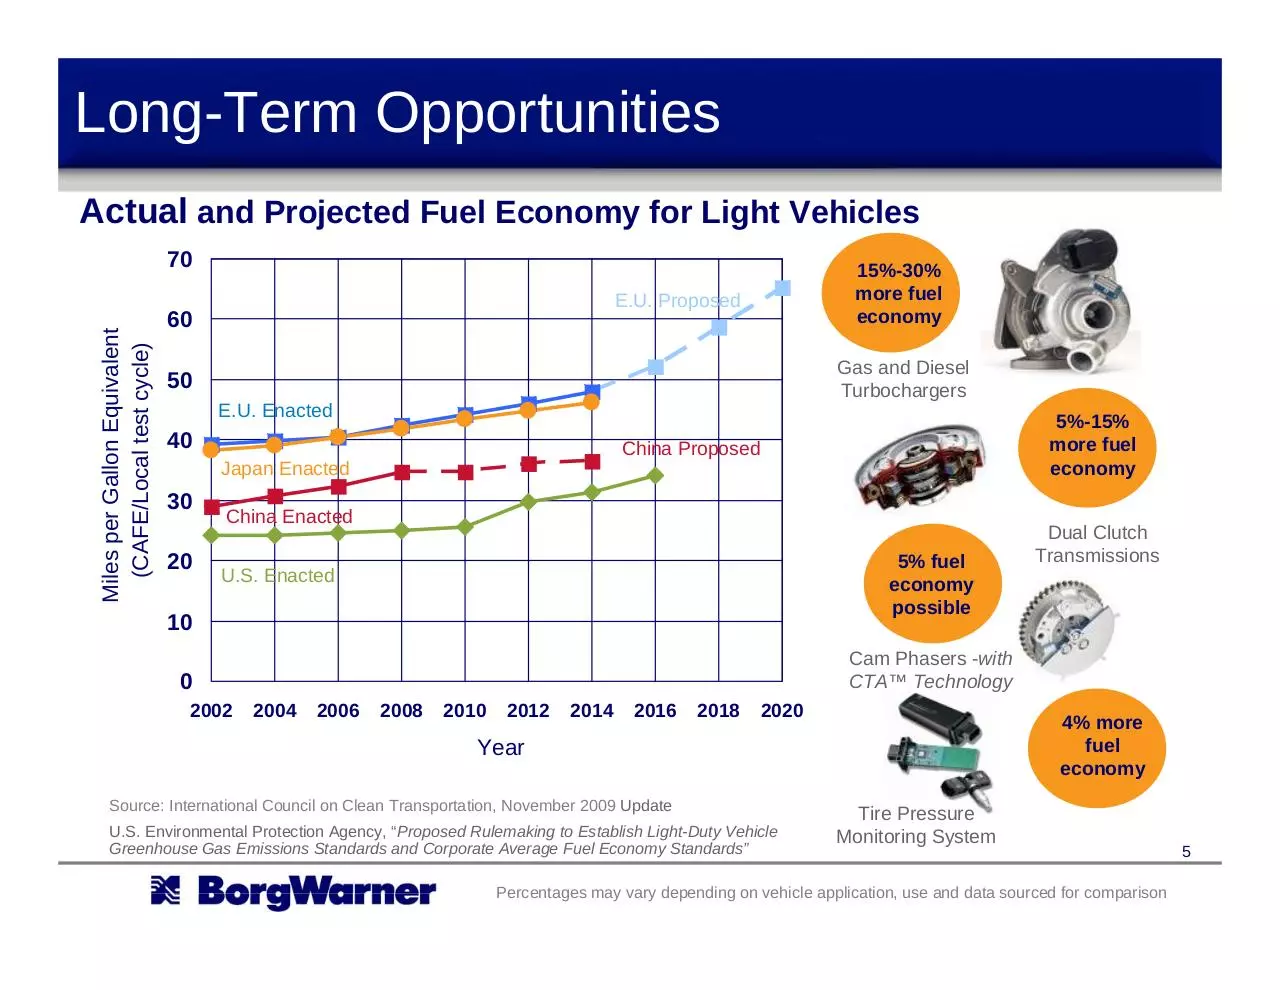
Long-Term Opportunities
Actual and Projected Fuel Economy for Light Vehicles
Miles per Gallon Equivalent
(CAFE/Local test cycle)
70
15%-30%
more fuel
economy
E.U. Proposed
60
Gas and Diesel
Turbochargers
50
E.U. Enacted
40
5%-15%
more fuel
economy
China Proposed
Japan Enacted
30
20
China Enacted
5% fuel
economy
possible
U.S. Enacted
10
Cam Phasers -with
CTA™ Technology
0
2002
Dual Clutch
Transmissions
2004
2006
2008
2010
2012
2014
2016
2018
2020
4% more
fuel
economy
Year
Source: International Council on Clean Transportation, November 2009 Update
U.S. Environmental Protection Agency, “Proposed Rulemaking to Establish Light-Duty Vehicle
Greenhouse Gas Emissions Standards and Corporate Average Fuel Economy Standards”
Tire Pressure
Monitoring System
Percentages may vary depending on vehicle application, use and data sourced for comparison
5
Net New Business 2010 thru 2012
$1.8 Billion of Net New Business
Americas*: 20%
Europe: 50%
Asia**: 30%
Chrysler
• Transfer cases
• Engine timing
Ford
•Turbochargers
•Diesel cold start
•DualTronic®
Japanese OEMs
• Engine timing
• Variable cam timing
Ford
• Engine timing
• Variable cam timing
• Turbochargers
BMW
•Turbochargers
•Diesel cold start
Commercial Vehicles
• Emissions
• Turbochargers
• Thermal systems
VW/Audi
•DualTronic®
•Turbochargers
•Beru systems
•Diesel cold start
GM
• Emissions
• Transfer cases
• Turbochargers
• Engine timing
GM
• Transmission components
Daimler
•Turbochargers
•Transmission components
Hyundai/Kia
• Engine timing
• Transmission components
New OEMs
• eGearDriveTM transmissions
Fiat
•Turbochargers
•DualTronic®
•Engine timing
•Diesel cold start
Hyundai/Kia
• Transmission components
• Turbochargers
• Engine timing
Chinese OEMs
• Turbochargers
• Engine timing
• DualTronic®
VW
• Turbochargers
Renault/Nissan
•Turbochargers
•Beru systems
6
* Net new business with GM, Ford and Chrysler in the U.S. is 9% of total net new business
** Net new business in China and Korea is ~18% and ~5% of total net new business, respectively
Net New Business 2010 thru 2012
$1.8 Billion of Net New Business—By Product
DCT
13%
GDI, VTG & R2S
Turbochargers
35%
Transmission
Components
2%
AWD
5%
eGearDriveTM for EV
1%
VCT & Engine Timing
14%
Turbo & Emissions
16%
Drivetrain: ~20%
Engine: ~80%
Ignition Systems
6%
Thermal
8%
7
Global Engine Downsizing
Light Vehicle Engines Produced—by Engine Size
100.0
90.0
2.4
80.0
Millions of Engines
70.0
60.0
2.7
4.7
2.9
2.3
8.8
7.3
8.1
7.7
7.9
5.8
50.0
40.0
30.0
8.0
2.5
8.0
2.8
3.2
10.5
2.5
61.8
51.6
54.0
64.4
66.6
58.1
48.6
48.8
4.0
4.0
4.0
4.3
5.2
6.4
8.0
8.9
9.4
2007
2008
2009
2010E
2011E
2012E
2013E
2014E
2015E
44.0
20.0
10.0
0.0
8 and 10 cylinder engines
6 cylinder engines
4 cylinder engines
2 and 3 cylinder engines
Other
4 cylinder engines account for more than 70% of
total engine growth 2010-2015
8
Source: CSM Worldwide, BorgWarner forecasts (July 2010)
Global Light Vehicle Engine Market
Light Vehicle Engines Produced—by Technology Type
100
2-10%
90
1%
5%
Millions of Engines
80
20%
20%
70
60
50
5%
5%
20%
23%
7%
~20%
HEVs
35%
30%-50%
HEVs
40
~6%
HEVs
30
20
68%
51%
33%
2010E
2015E
2020E
10
0
Alternative Fuel
Gasoline—Port Fuel Injection and Other
Diesel
PEV and PHEV
9
Gasoline—Direct Injection
Source: BorgWarner forecasts, CSM, JD Power, Global Insight, others (July 2010)
Download BWA 10 3Q StrongFutureSlides
BWA_10_3Q_StrongFutureSlides.pdf (PDF, 804.32 KB)
Download PDF
Share this file on social networks
Link to this page
Permanent link
Use the permanent link to the download page to share your document on Facebook, Twitter, LinkedIn, or directly with a contact by e-Mail, Messenger, Whatsapp, Line..
Short link
Use the short link to share your document on Twitter or by text message (SMS)
HTML Code
Copy the following HTML code to share your document on a Website or Blog
QR Code to this page

This file has been shared publicly by a user of PDF Archive.
Document ID: 0000505812.