Winning Report 2015 2 (PDF)
File information
Author: Florian Domin
This PDF 1.6 document has been generated by Microsoft® Word 2013, and has been sent on pdf-archive.com on 05/12/2016 at 15:54, from IP address 130.223.x.x.
The current document download page has been viewed 2659 times.
File size: 3.38 MB (46 pages).
Privacy: public file


File preview
CFA Institute Research Challenge
hosted by
CFA Society Switzerland
University of Lausanne
Medtech, Switzerland
Sonova Holding AG (SOON.VX)
As of November 27th, 2014
Recommendation
HIGHLIGHTS
We issue a sell recommendation on Sonova with a target share price of CHF 122,
representing an expected downside of 16.8% on the closing price of November 27th. Sonova is
a well-managed company and possesses a market leading position within the hearing aid industry.
Nevertheless, we consider the company’s soaring multiple level – which exceeds the already high
valuation of the sector – as not intrinsically justified and therefore exaggerated.
Expectation treadmill. We take a conservative stance towards the three factors that arouse growth
expectations among market participants: a) supportive demographics: the 65+ section of population
is the fastest growing, but in developed countries growth boils down to a marginal CAGR of 2%
between 2010 and 2030; b) penetration rates: these are admittedly low but are stagnating in
developed countries (e.g. 24-25% in the US throughout last decade) and the exploitation of market
potential in developing countries requires price deductions; c) binaural fitting rates: comparable with
demographics and vary across markets, but no significant local rises have been observed thus far.
We claim that industry players and Sonova in particular will not be able to meet investors’ high
expectations reflected in current valuation levels. Our forecasted EPS figures are below analysts’
expectations for the main peers. Furthermore, the 3y share buyback program in the amount of CHF
500m (launched on December 1st) is only half of what many investors expected – an illustration of
the high expectations.
R&D imperative. Sonova’s management continously stresses the importance of research and
innovation for its future success. In view of its multi-brand portfolio, we confirm a potential to lever on
R&D. However, flagship projects such as “Lyric” and the cochlear business substantially derive from
acquisitions undertaken by the previous management in 2009/10. Moreover, the main players
shortened their product cycles throughout the last decade – now approaching two years, while R&D
spending remained stable. A confluence of increasingly complex advancements and high time
pressure provides a possible explanation. Investors’ disappointment concerning Sonova’s platform
release (Venture dual core processor) in October stands as testimony to this increasingly tense
relation.
Market approach: a double-edged sword. Besides the “special cycles” of product introductions as
strategic devices in order to buoy price levels and market shares, the group now expedites the retail
expansion and applies aggressive pricing. In fact, Sonova directly competes against independent
audiologists who still represent the most important distribution channel and appear as gate-keepers
to certain client groups. Its aggressive pricing – as reflected by selling premium products at low
prices through US big box retailer CostCo – has the potential to fuel price wars and put margins at
risk. For instance, the leading retailer Amplifon expects US independents’ renunciation of Phonak
products to reduce Sonova’s share of wallet in the single most important market by half (from 4050% to 25-30%). Furthermore, William Demant reduced its full year earnings target by 3% (EPS now
2-7%) blaming Sonova for turbulence in the US market – a possible vanguard of countermeasures.
Limited upside potential. Sonova trades at 28.9x its recent earnings and outreaches the already
high median (24.6x) of its closest peers. In the light of our intrinsic valuation and moderated
estimates of growth drivers for the industry, we expect a downward correction towards 21.4x P/E
rather than scope for multiple expansion or unexpected earnings upgrades.
Sales (m)
EBITA (%)
Net Income (%)
EPS
DPS
ROIC
ROE
12/13
13/14
14/15E
15/16E
16/17E
17/18E
18/19E
1'795
10%
6%
1.6
1.2
4%
7%
1'951
22%
18%
5.1
1.6
13%
20%
2'084
22%
18%
5.6
2.2
14%
19%
2'202
23%
19%
6.3
2.5
15%
19%
2'322
24%
20%
7.0
2.7
16%
20%
2'442
25%
21%
7.8
3.0
17%
21%
2'563
26%
21%
8.7
3.3
18%
22%
SELL
Share price (CHF)
146.6
Target price (CHF)
122.0
Downside
16.8%
General information
Ticker
SOON.VX
Exchange
SIX Swiss Exchange
Country
Switzerland
Industry
Healthcare
Sector
Equipment and service
Subsector
Medical equipment
Key figures
Closing price (CHF)
146.6
52w low (CHF)
116.4
52w high (CHF)
153.7
40’133
Avg. daily vol. (3months)
9’846
Market Cap (mCHF)
67’165
Number of shares (m)
Free float (%)
79%
41’932
Est. FY buybacks (kCHF)
Trailing P/E
28.9x
Financial year
April-March
IR website
Sonova.com
Next event
FY results, May 19th
Source: Sonova, Reuters Eikon
Business segments
Source: Sonova
Source: Sonova, Team assessment
Long-term share performance
Equity sell-offs in the
course of crisis
Resignation
of CEO, CFO
and chairman
New platform
“Venture” does not
meet expectations
German Cartel Office
blocks GN ReSound
takeover
FY guidance upgrade and
announcement of AB
acquisition
FDA approves
further implant
sales
Disappointing FYprojections: low
trading activity
Volume in 100
Share price in CHF
Delayed profit warning after
product recall and suspicions
of improper share sales: -20%
Source: Google finance, Berenberg
1
Fig. 1: 1y stock performance vs. SMI index
Global market leader from Switzerland
160
9'500
150
9'000
140
SOON (CHF)
Sonova, with the core of the group originally founded by French-Belgian investors in 1947, offers one of
the broadest service and product ranges within the hearing healthcare industry. The integrated brand
architecture has grown through a series of strategic acquisitions and splits into two segments: hearing
instruments and cochlear implants, with the former comprising of the retail business Connect Hearing. Its
presence in more than 95 countries through a combination of direct subsidiaries (30 countries) and a
network of independent distributors forms the strongest geographic footprint within the industry (Appx.
5). Sonova is listed on the SIX Swiss Exchange and trades close to its all-time high (CHF 153.7) at the
time of writing (Fig. 1).
8'500
130
8'000
120
110
7'500
100
7'000
Highly concentrated competitive environment
Sonova
SMI (RHS)
There are vital and often-cited industry themes in place, which appear to drive future growth of the
segment: a comparison of the number of people benefiting from a hearing instrument and the number of
people suffering from hearing loss reveals a largely underpenetrated market (between 20%-30%
penetration in most countries). In parallel, an increasingly ageing population – not only in developed
countries, but also in emerging societies – plays a key role for industry volume growth, as the average
first-time client is 68 years old.
Source: Google Finance
Fig. 2: Summary: SWOT analysis
Strengths
Established retail business (first mover)
However, our analysis results in a moderation of the short-to-medium term expectations. We are
concerned about a possible overconfidence on the industry’s future. For each of the potential growth
drivers (especially demographics, low penetration rates and binaural fitting potentials) we encounter
adverse mechanisms, which impede confidence in the envisaged path.
Broad product and service portfolio
Weaknesses
Degrading relationship with audiologists
As customers’ appreciation of innovational excellence varies considerably for a variety of reasons, the
industry is now heading towards fierce price competition and novel marketing approaches. Sonova
positions itself as an innovator in this development and plays a decisive role in shaping the competitive
landscape. In our view, the flipside of this aggressive approach is that Sonova steps up a price war and
harms existing relationships with audiologists.
Advance Bionics products recall and damage claims
Opportunities
Avantgarde approach to overcome end-user's stigma
Growth potential in the Cochlear Implant market
As result, we take a rather conservative view on the industry’s growth potential. An expected sales
CAGR of 4.2% for the overall hearing instrument segment and a CAGR of 12.5% for the cochlear
implant market puts us at the lower end of analysts’ expectations.
Threats
Strong negative foreign exchange effects
Downward spiral of prices and volume competition
Sound financial position, but not outperforming peers
Based on the assumptions as further elaborated upon in the valuation section, the DCF results in a 19%
downside compared to the closing price of November 27th. In order to capture the market perspective,
we conduct a multiple valuation of trailing and forward earnings. In our view, the observed premium
(17.5% above peer median) cannot be explained by future EPS outperformance since the consideration
of forecasted earnings results in an even bigger surcharge of 33% (Fig. 3).
60%
50%
40%
30%
Ø
Ø
20%
Ø
10%
2014/15E
2015/16E
Ø
Sonova
WD
GN
Cochlear
Valuation: industry leader trading at an unreasonable premium
Fig. 3: Benchmarking: EPS growth projections
Sonova
WD
GN
Cochlear
Another important factor is the impact of currencies. A substantial part of the cost base is denominated
in CHF (e.g. R&D, SG&A). On the other hand, the percentage of US sales was in the mid-thirties and EU
distribution recently exceeded 40% (CH < 2%). In FY 2013/14, currency movements exercised a
negative impact of 3% on the top line and 5.1% on EBITA. With respect to the ongoing rebalancing of
the sales mix it is difficult to estimate whether exchange rates are likely to have a positive or negative
impact on future margins.
Source: Team assessment
Note: See Appendix 5F for further information
Sonova
WD
GN
Cochlear
The historic figures underscore Sonova’s current healthy financial position. Yet, due to our industry
structure assessment, we currently see no basis for an operational margin expansion beyond the midtwenties EBITA target within a 3y horizon. Potential gains in the retail and cochlear businesses – the
estimated margin contributors – are expected to be balanced against fierce pressure on wholesale
margins on a certain level within the target area. Despite the fact that the underlying growth drivers are
intact, sales growth depends on many variables other than attractive products alone. The fight for market
share fuels competition and ultimately puts average selling prices (ASPs) as well as margins at risk. A
prime example was Sonova’s decision to sell premium products via the US retail chain CostCo.
Sonova
WD
GN
Cochlear
Sonova possesses a strong position in the maturing hearing aids industry. In comparison to other
sectors, customer demand is subject to a confluence of factors such as healthcare policies and access
to treatment. Excellence in research and development does not necessarily translate into market
success. With landmark technology, such as the invisible in-ear solution Lyric, Sonova seeks to reach
the market segment of reluctant hearing impaired, hitherto difficult to penetrate.
SMI
INVESTMENT SUMMARY
2016/17E
2017/18E
0%
Sonova as industry leader might attract investors for alternative reasons (e.g. sustainability scores – see
other headings), which might explain a certain premium. Nevertheless, we do not perceive these
arguments as being sufficient to explain such a markup. Under the assumption that our price target is
realized, Sonova reaches a forward P/E of 21.4x – still high, but intrinsically justified.
Source: Team assessment, Thomson Reuters EIkon
Our final price recommendation for Sonova combines both DCF and multiple valuation. The fair price of
CHF 122 lies in-between the results of the valuation techniques (Fig. 4).
Sonova – like other players of the medtech industry – faces the risk of product failure or malfunctions,
which directly impact the health of patients. The threat of liabilities related to product recalls and damage
claims became reality when the company was called to account for an Advanced Bionics cochlear
implant issue that arose in 2006 – before the acquisition of the California-based company.
Competitors experienced comparable liabilities, e.g. Australian Cochlear Ltd. in 2012. Furthermore, the
innovation capacity is one of management’s biggest concerns and is a problem inherent to the sector.
The industry seems to reach a shifting point and turns to fierce price competition. The aggressive market
approach pursued by the group burdens its partnerships with retailers and audiologists. This second
class of risk potentials appears to be more specifically related to Sonova. Some risks, further elaborated
upon in the risk section are inter-connected and bear the potential to generate a domino effect. A
confluence of factors may negatively affect Sonova’s position and consequently lead to adverse
valuation results.
Fig. 4: Fair price calculation
130
125
125
120
CHF
Risks: many factors are common to the industry, some are consciously entered
115
122
119
110
105
100
DCF
Fair price
P/E
Source: Team assessment
2
BUSINESS DESCRIPTION
Fig. 5: Sales by product group 2013/14
The group positions itself as the leading manufacturer of innovative hearing care solutions. Driven by its
vision of a world in which everyone enjoys the delight of hearing, Sonova aims to provide a specific
solution for everyone suffering from hearing impairment.
The core of the company was founded in 1947 as “AG für Elektroakustik” by French-Belgian investors.
After the acquisition by Ernst Rihs and Beda Diethelm in 1965 they shaped the company pursuing their
vision of an integrated full service provider. In 2007 the group was renamed to its current name Sonova
Holding AG. Being present in over 95 countries worldwide and counting a workforce of over 9’500
employees, Sonova achieved sales of CHF 1.95 billion in 2013/14. The group is headquartered in
Staefa, Switzerland and is listed on the SIX Swiss Exchange since 1994.
Advanced HI 22%
13% Miscellaneous
4% Wireless
10% Cochlear
Premium HI 22%
Value creation within 4 brands & 2 segments: a fully-fledged solution provider
29% Standard HI
Sonova’s operations split into the segments hearing aids (hearing instruments – HI, 90% of sales in
2013/14) and cochlear implants (CI). The hearing aid segment comprises the globally recognized
manufacturing brands Phonak and Unitron, as well as the group’s retail operations brand Connect
Hearing.
Following the acquisition of Los Angeles-based Advanced Bionics in 2009/10, the manufacturing of
cochlear implant systems forms the second segment of the group. Though it recently accounted for only
10% of sales, this segment experiences the fastest growth (4-year CAGR of 66.8%). Due to past
acquisitions, specific HQs and research facilities of Advanced Bionics, Lyric (operating under Phonak
brand) and Unitron remain in Northern America (Appx. 5B). While administrative functions are located in
Western countries, Asia is the most important hub for manufacturing – accounting for ~70% of suppliers
in terms of volume and counting two operation centers in Vietnam and China. All brands within the group
are ultimately led by CEO Dr. Lukas Braunschweiler and his executive team (Appx. 8).
Source: Sonova
Note: See Appendix 1 for further information
Fig. 6: Sonova: Regional sales split 2013/14
37%
Northern
America
11%
Americas
11%
ASIAP
By means of its distinctive brand approach – Phonak as the most innovative brand in hearing aids and
Unitron with leading customer service – the group provides the broadest spectrum of products within the
industry, spreading across all performance levels (from basic to premium) and degrees of impairment.
Through its retail arm Connect Hearing, a growing international network, the group provides professional
services to end-users. As one of the early movers into the retail business, Sonova seeks to strengthen
both its positioning across the value chain and its relationship with end-users, while supporting its
manufacturing business (Fig. 5 & 7, Appx. 5H).
41%
EMEA
Source: Sonova
Note: See Appendix 6B for further information
Market strategy: 4 main growth vectors
Fig. 7: Corporate strategy
Penetrate
existing
markets
Expansion into accessible markets renders the second pillar of Sonova’s market strategy: the group
plans to enforce its position in emerging countries, which exhibit attractive growth opportunities. Through
establishing distribution channels in these markets, thus shaping the infrastructure, it aims to exploit the
promising perspectives of largely untapped user groups. Up until now, Americas and ASIAP were only
minor contributors to the sales total. (Fig. 6).
Develop
consumer
base
Market
strategy
Sonova aims to further integrate service channels – analysts’ estimated more than 2000 companyowned outlets in 2013. The initiative in the US serves as an example: over 300 healthcare centers are
now to be incorporated under the Connect Hearing brand. Moreover, Sonova announced expansion
plans in its retail business through further store openings and selected acquisitions.
Integrate
service
channels
Finally, Sonova seeks to develop the consumer base and to reach new client groups. By means of
interactive online platforms, the group sensitises potential end-users by providing first information and
professional advice. This targeted customer insight reveals customer needs and simultaneously
encourages face-to-face consultations – supporting present and future sales.
According to the World Health Organization, 360 million people worldwide suffer from hearing
impairment, representing 5.3% of global population. It is estimated that 6% of the highly populated
developing countries are concerned. Throughout the last 10 years, the demand for hearing aids grew at
a CAGR of around 4%, recently reaching 10-11 million units sold per year and a market value of CHF
15-16 billion. Industry experts expect an accelerated annual volume growth between 4.5-5% over the
next 5 years. However, we think that the optimistic future perspectives should be taken with a
pinch of salt considering the major factors driving the anticipated volume growth.
Source: Sonova
Note: See Appendix 5 for further information
Fig. 8: Developed countries – age structure
1'400
30%
1'200
172
199
247
297
327
342
1'000
million people
INDUSTRY OVERVIEW
Expand
accessible
markets
Demographics: dynamics of ageing
25%
20%
800
15%
600
805
834
817
795
775
753
10%
400
% of population
Sonova aims at a higher penetration of existing markets by levering its strong global presence. This
primarily focuses on mature markets such as North America and Western Europe. The action plan is to
increase market share of treated clients, as well as to penetrate new groups of end-users. Based on high
levels of customer satisfaction and consistent product introductions, Sonova seeks to overcome the
perception of high economic costs associated to wearing hearing aids (“stigmatisation”).
5%
200
217
203
207
199
194
195
The causes of hearing loss separate into three main categories: congenital, acquired and predominantly
0
0%
2000
2010
2020
2030
2040
2050
age-related impairment (avg. client is 68 years old). It is estimated that 35-40% of the population aged
15-64 (%)
65+ (%)
0-14 (abs.)
15-64 (abs.)
65+ (abs.)
65 and over are hearing impaired to varying extents. Driven by the global increase of life expectancy and0-14 (%)
Source: US census bureau, UN
the “baby boomers” generation, the age pyramids are progressively reversing (Fig. 8). In developed
Note: See Appendix 6H for further information
countries, this group is expected to account for more than 27% of the population by 2050. In our view,
the positive impact of demographics appears to be overestimated: on a year-to-year basis and in
contrast to the long horizon, the effect becomes marginal since the age structure of a population shifts
Fig. 9: Penetration rate by region
slowly over time. Annual growth between 2010 and 2030 amounts to 2% in the developed world and
3.9% in emerging countries. We therefore think that this low single digit growth rate can easily be offset
40%
by lower prices, upon which we elaborate in the following section.
EU
11 – 13%
USA
2- 4%
10%
21 – 23%
20%
23 – 25%
Global production output is estimated to cover less than 10% of the potential demand. This indicates low
penetration rates, especially in developing countries where rates fall below 2.5% (Fig. 9). Consequently,
one of the industry’s key issues is how manufacturers manage to expand the future pie and their
respective slice. This particularly refers to developed countries, where penetration remained stable
over the past decades – despite technological improvements and reimbursement schemes being in
place (Fig. 10). To understand this stagnation, the severity of hearing loss has to be taken into account:
market penetration increases with the degree of impairment (Fig. 11). The perception of inconvenience
and high economic costs relatively to gains of carrying a hearing aid is prevalent in cases of less severe
impairment – which represent ~95% of cases. This reluctance was confirmed by an audiologist we
30%
36 - 38%
Increasing the penetration rate: an arduous task
0%
Australia
Japan
China
Source: Sonova
Note: See Appendix 6 for further information
3
CAGR scenarios
until 2018/19
0.7% CAGR
30%
27.1 @ 1.4% p.a.
26.1 @ 0.7% p.a.
25%
20%
15%
25%
1994
1997
2000
2004
2008
25%
24%
5%
22%
10%
20%
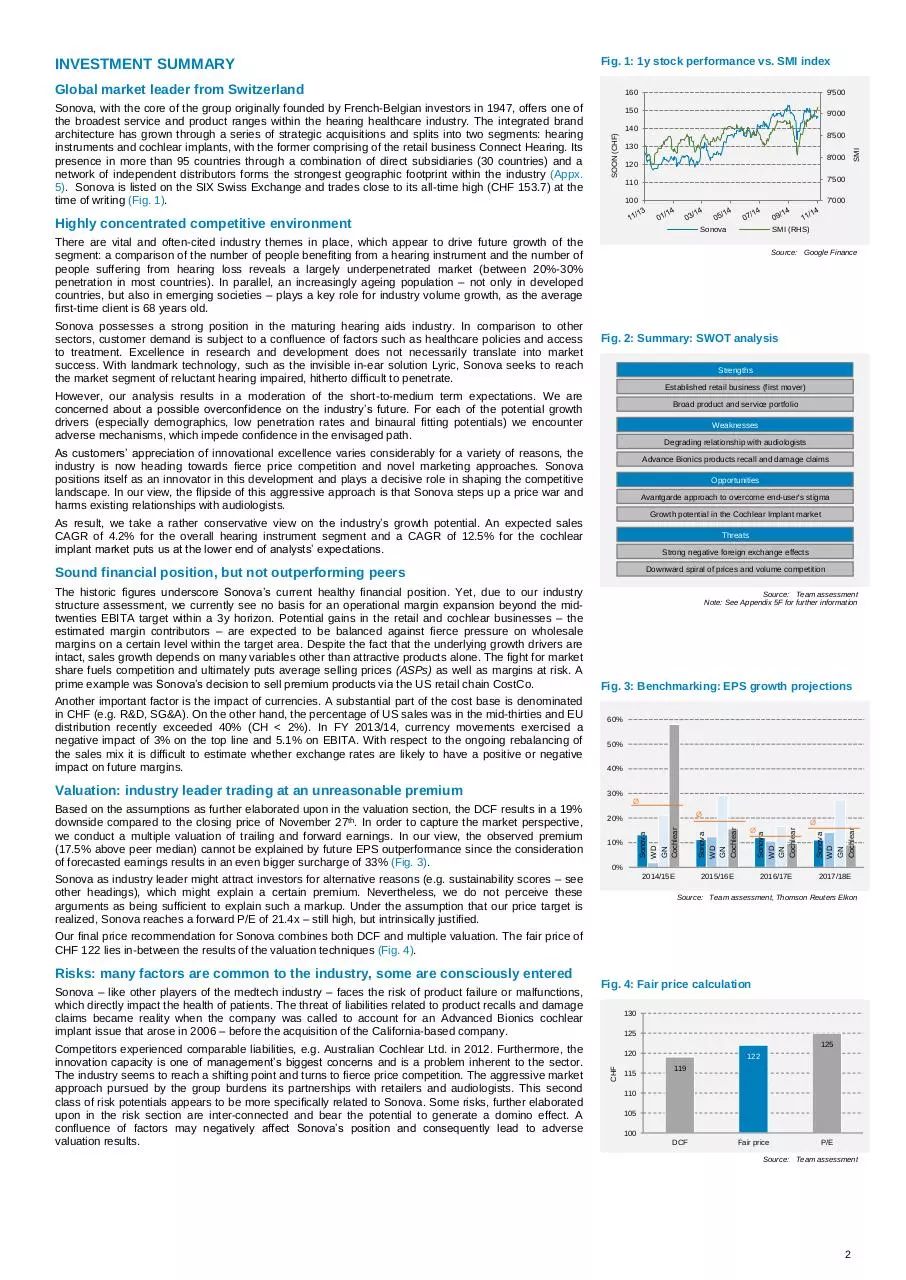
Emerging countries offer higher growth rate prospects. Governments recently underscored their
growing awareness regarding hearing loss, as measures such as child screening and the fostering of
infrastructures of dispensers and audiologists illustrate. Nevertheless, the cost of treatment and
devices remain prohibitive for many people (prices for conventional devices range from CHF1’6007’000, depending on performance level). The emergence of prosperous middle-classes in those
countries represents a promising force to support future sales. However, the interaction of strong limiting
factors, such as a lack of audiological tradition, an underdeveloped infrastructure, a relatively poor
elderly target group and sparse reimbursement schemes, impede a rapid market penetration. First
initiatives, for example WHO’s promotion programs and the advent of national schemes (China) tackle
the aforementioned issues.
Fig. 10: Penetration rate development in the US
21%
interviewed in November: potential patients frequently argue that the benefits of wearing such
prostheses do not compensate for associated discomforts (Appx. 6J – 6M). Maintaining industry
growth requires that manufacturers find a way to overcome the stigmatisation of treatment and to serve
customer demands through tailored products. The industry has not yet been able to exploit the selfimposed potentials and to meet the needs of existing and prospective clients. There is no universally
valid answer to this issue, but studies have shown that clients superficially ask for hearing quality, decent
designs, wearing comfort and affordability (Appx. 6N). We expect penetration rates in developed
countries to remain below 30%.
0%
2013 18/19E
Source: Berenberg (2013), team estimates
Fig. 11: Penetration by degree of impairment
Yet, emerging markets represent a relatively small percentage of the global market (Fig. 12, appx. 6B).
We think that healthy drivers promise long term growth, but price concessions and a long process to
understand local conditions are required to exploit potentials. Mid-term growth perspectives and
significant penetration gains should therefore be moderated.
Profound cases
~5%
Moderate cases
~25%
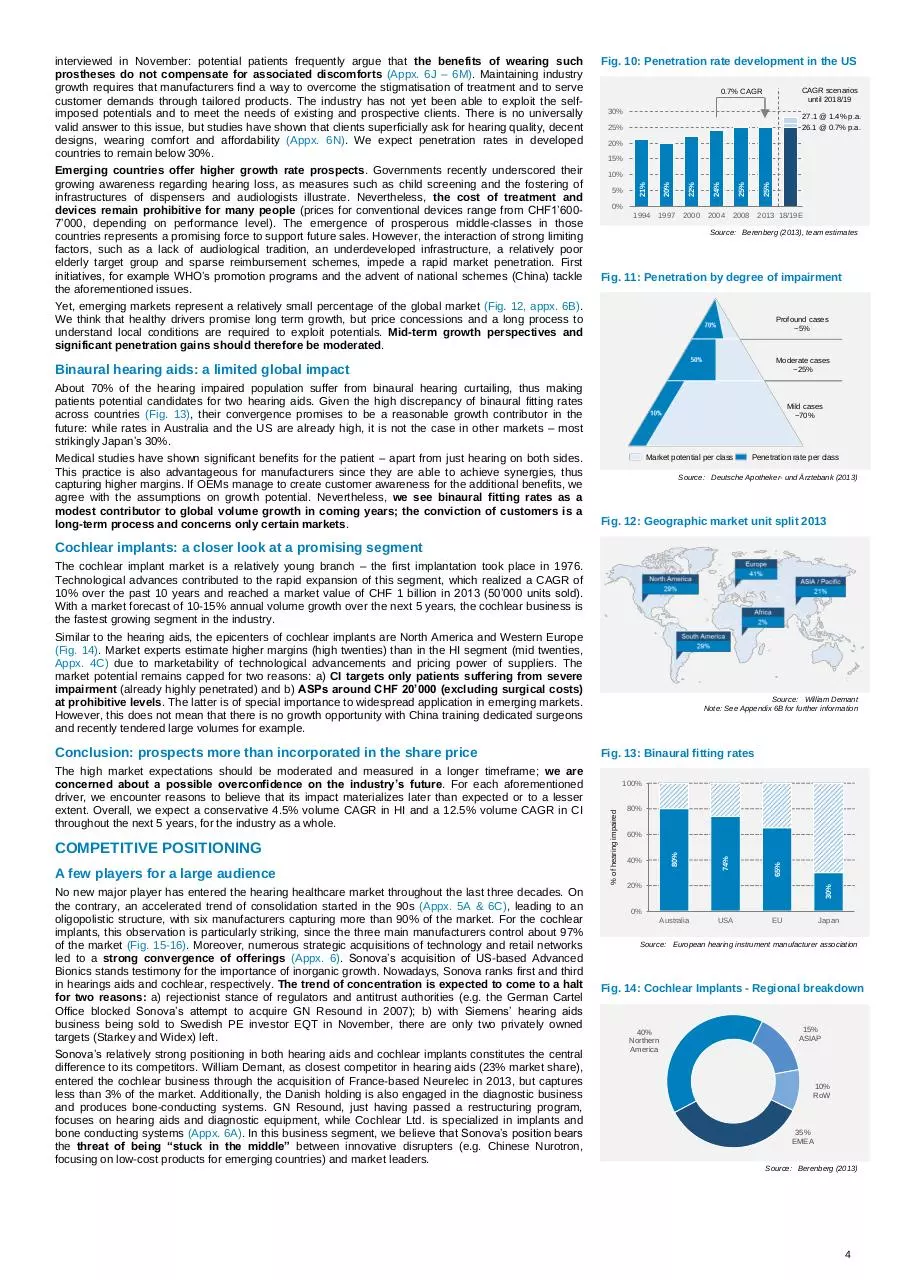
Binaural hearing aids: a limited global impact
About 70% of the hearing impaired population suffer from binaural hearing curtailing, thus making
patients potential candidates for two hearing aids. Given the high discrepancy of binaural fitting rates
across countries (Fig. 13), their convergence promises to be a reasonable growth contributor in the
future: while rates in Australia and the US are already high, it is not the case in other markets – most
strikingly Japan’s 30%.
Medical studies have shown significant benefits for the patient – apart from just hearing on both sides.
This practice is also advantageous for manufacturers since they are able to achieve synergies, thus
capturing higher margins. If OEMs manage to create customer awareness for the additional benefits, we
agree with the assumptions on growth potential. Nevertheless, we see binaural fitting rates as a
modest contributor to global volume growth in coming years; the conviction of customers is a
long-term process and concerns only certain markets.
Mild cases
~70%
Market potential per class
Penetration rate per class
Source: Deutsche Apotheker- und Ärztebank (2013)
Fig. 12: Geographic market unit split 2013
Cochlear implants: a closer look at a promising segment
The cochlear implant market is a relatively young branch – the first implantation took place in 1976.
Technological advances contributed to the rapid expansion of this segment, which realized a CAGR of
10% over the past 10 years and reached a market value of CHF 1 billion in 2013 (50’000 units sold).
With a market forecast of 10-15% annual volume growth over the next 5 years, the cochlear business is
the fastest growing segment in the industry.
Similar to the hearing aids, the epicenters of cochlear implants are North America and Western Europe
(Fig. 14). Market experts estimate higher margins (high twenties) than in the HI segment (mid twenties,
Appx. 4C) due to marketability of technological advancements and pricing power of suppliers. The
market potential remains capped for two reasons: a) CI targets only patients suffering from severe
impairment (already highly penetrated) and b) ASPs around CHF 20’000 (excluding surgical costs)
at prohibitive levels. The latter is of special importance to widespread application in emerging markets.
However, this does not mean that there is no growth opportunity with China training dedicated surgeons
and recently tendered large volumes for example.
Sonova’s relatively strong positioning in both hearing aids and cochlear implants constitutes the central
difference to its competitors. William Demant, as closest competitor in hearing aids (23% market share),
entered the cochlear business through the acquisition of France-based Neurelec in 2013, but captures
less than 3% of the market. Additionally, the Danish holding is also engaged in the diagnostic business
and produces bone-conducting systems. GN Resound, just having passed a restructuring program,
focuses on hearing aids and diagnostic equipment, while Cochlear Ltd. is specialized in implants and
bone conducting systems (Appx. 6A). In this business segment, we believe that Sonova’s position bears
the threat of being “stuck in the middle” between innovative disrupters (e.g. Chinese Nurotron,
focusing on low-cost products for emerging countries) and market leaders.
60%
40%
Australia
USA
20%
30%
No new major player has entered the hearing healthcare market throughout the last three decades. On
the contrary, an accelerated trend of consolidation started in the 90s (Appx. 5A & 6C), leading to an
oligopolistic structure, with six manufacturers capturing more than 90% of the market. For the cochlear
implants, this observation is particularly striking, since the three main manufacturers control about 97%
of the market (Fig. 15-16). Moreover, numerous strategic acquisitions of technology and retail networks
led to a strong convergence of offerings (Appx. 6). Sonova’s acquisition of US-based Advanced
Bionics stands testimony for the importance of inorganic growth. Nowadays, Sonova ranks first and third
in hearings aids and cochlear, respectively. The trend of concentration is expected to come to a halt
for two reasons: a) rejectionist stance of regulators and antitrust authorities (e.g. the German Cartel
Office blocked Sonova’s attempt to acquire GN Resound in 2007); b) with Siemens’ hearing aids
business being sold to Swedish PE investor EQT in November, there are only two privately owned
targets (Starkey and Widex) left.
80%
65%
A few players for a large audience
100%
74%
COMPETITIVE POSITIONING
Fig. 13: Binaural fitting rates
80%
The high market expectations should be moderated and measured in a longer timeframe; we are
concerned about a possible overconfidence on the industry’s future. For each aforementioned
driver, we encounter reasons to believe that its impact materializes later than expected or to a lesser
extent. Overall, we expect a conservative 4.5% volume CAGR in HI and a 12.5% volume CAGR in CI
throughout the next 5 years, for the industry as a whole.
% of hearing impaired
Conclusion: prospects more than incorporated in the share price
Source: William Demant
Note: See Appendix 6B for further information
0%
EU
Japan
Source: European hearing instrument manufacturer association
Fig. 14: Cochlear Implants - Regional breakdown
40%
Northern
America
15%
ASIAP
10%
RoW
35%
EMEA
Source: Berenberg (2013)
4
Innovation imperative and its limitations
Sonova repeatedly emphasizes its claim on innovation leadership – achieved through acquisitions of
cutting-edge knowledge and constant R&D-to-sales ratios of ~7%. The shortening of product cycles is
a dominant trend: as 80% of Sonova’s revenues stem from products which were introduced in a 2y
timeframe, R&D efficiency is essential for the creation of competitive advantages.
Sonova markets a multi-brand portfolio based on a platform strategy, which grants the potential of R&D
synergies and rapid product introduction. By launching recent platforms on all performance levels at
once, Sonova has departed from industry patterns. Usually, new technologies are introduced in a
descending order of performance categories. The Flex concept within the Unitron brand landscape
represents another marketing novelty: it allows customers to upgrade their existing device by means of
software add-ons.
Moreover, the group sets high expectations into the landmark product Lyric, an unparalleled in-ear
technology acquired in 2010. It is sold on a subscription base and accounts for one fifth of our sales
growth forecast until 2018/19 (Appx. 1 & 5D). Its features, including invisibility and extended battery life,
reduce the perceived inconvenience of wearing a hearing aid and contribute to the reaching of clients
who have been reluctant so far. Despite these differentiating characteristics, the audiologist we
interviewed in November expressed some caveats: Lyric does not fit into every hear canal and its high
cost (2-3 times a conventional solution) turns out to be prohibitive (Appx. 6O). The fact that the
underlying technology has been externally acquired (Insound, 2010), supports our hypothesis of
limitations on organic growth.
Furthermore, analysts were not convinced by Sonova’s new range of products providing connectivity to
external devices, which are not based on the 2.4 gigahertz wireless technology (Bluetooth bandwidth).
This reaction suggests that there is a viable threat of aspirations differing from perceptions and
gives inadequate answers to customer needs.
We consider technological innovation as a necessary but not sufficient condition to future success
in a market environment of fierce competition. Recently, Sonova and OEMs in general created “artificial”
product cycles without real technological breakthrough. In last year’s strategic moves we identify a shift
towards competition in distribution channels and intensified use of marketing instruments (such as
aggressive pricing) in order to secure growth.
Fig. 15: HI – market shares 2013
95%
100%
87%
76%
80%
64%
60%
40%
47%
24%
100%
8%
5%
11%
12%
17%
23%
20%
24%
0%
Source: Finanz & Wirtschaft
Note: See Appendix 6H for further information
Fig. 16: CI – market shares 2013
100%
80%
97%
99%
100%
15%
2%
1%
82%
62%
20%
60%
40%
62%
20%
0%
Access to distribution channels is key
Retail reaps 60 to 70% of the total market value of CHF 15-16 billion (Fig. 18). The highly fragmented
intermediate level historically consisted of independent distributors, large purchasing groups and retail
chains, as well as governmental entities. Throughout the last decade, OEMs have strengthened their
retail operations through acquisitions and store openings, thus circumventing intermediaries and
securing part of the ~4x retail markup. Yet, independents still represent the most important sales
channel (Fig. 19) and their recommendation has strong influence on end-user’s purchase. We attribute
crucial importance to strong partnerships with these gatekeepers.
Direct OEM retail reaches levels of efficiency and capacity utilization, which are unachievable for
independent clinics. Our forecast reflects positive impacts on sales volume and margins induced by a
rebalancing distribution channels (adding up to the wholesale markup of ~3x) and thus partly
compensating for pressure on prices. The downside of this practice lies in the direct competition to
important independent resellers and strategic reactions of competitors.
Aggressive pricing strategy
In addition to the great impact of governmental decisions in terms of public health systems, public
entities appear as large volume buyers within tenders. These purchasing processes of lower
performance devices result in highly competitive prices. Overall, public tenders’ contribution to increase
market penetration comes at the extent of increased pressure on selling prices which industry
experts estimate to fall in a range of 1 to 3% in 2015. Manufacturers’ restrictive information policy on
units sold and prices prevents independents from calculating ASPs and thus strengthening their
bargaining position.
Sonova’s inroad to sell premium products of its brand Phonak through US wholesale chain CostCo
shows the group’s aggressive market approach and readiness for concessions in the fight for
market shares. This move triggered harsh backlash from competitors and independent audiologists:
Amplifon recently stated that a majority of US retailers have decided to abandon Phonak. In addition
to this, Sonova already rivals independent dispensers through its growing inhouse retail business. It
remains to be seen whether these ventures result in strategic alliances and retaliation against
Sonova – ultimately fuelling price wars.
Source: German Medical Technology Association (2014)
Note: See Appendix 6H for further information
Fig. 17: Summary – Porter’s 5 forces
-
+
+
+
+
+
Industry rivalry
Threat of new entrants
Threat of substitutes
Power of suppliers
Power of buyers
Source: Team assessment
Note: See Appendix 6 for further information
Fig. 18: Industry value chain
Wholesale
Market
Size:
Retail
20-30%
60-70%
CHF
15-16bn
5-8%
Conclusion: a double edged sword market strategy
Component
manufacturers
Sonova possesses a strong position in the maturing hearing aids industry. In difference to other sectors,
customer demand is subject to a confluence of factors such as healthcare policies and access to
treatment. We see the industry reaching a turning point in which the growth drivers – organic
innovation and strategic OEM acquisitions – are deprived of their substance.
The group enters price competition and simultaneously enforces expansion of its retail activities. In the
traditional setup, OEMs benefited from low prices for end-users and high penetration rates – assuming
stable wholesale markups. With an increasing importance of OEM-owned retail, this mathematics
changes, as manufacturers directly benefit from high retail prices, which were previously earned by
independents. We balance between value maximizing effects and downsides of these changes,
expecting sales CAGR of 4.2% for the overall HI segment and sales CAGR of 12.5% for CI over the next
5 years. In our view, Sonova’s market approach steps up a price war and harms the group’s
relationships with audiologists. Furthermore, we believe that the company will not be able to find
better solutions to industry challenges than its competitors, but possesses a higher valuation.
Source: Berenberg (2013)
Fig. 19: Dispensing channels by market shares
22%
Public entities
8%
Purchasing
groups
24%
Retail chains
8%
OEM retail
FINANCIAL ANALYSIS
Sonova appears as a well-managed company with the sound financial stability of a market leader within
the hearing aid industry. We considered the following competitors in our analysis: William Demant (DK)
and GN Store Nord (DK), with hearing aids accounting for 86% and 62% of total revenues in 2013.
Additionally, the leader in cochlear implants Cochlear Ltd. (AUS) represents the closest peer to Sonova’s
second segment. Siemens (global number four) has been excluded due to its conglomerate structure
without disclosure on its hearing aid business and the distorting effects of the recent takeover. Along
with the assessment of the industry outlined hitherto, the following financial analysis prepares the
foundation upon which we build our future estimates (valuation section).
37%
Independents
Source: William Demant (2014)
5
Historic top line growth not to be maintained
Sonova substantially gained market shares in the course of the consolidation trend of the hearing aid
industry, which intensified since the 1990s. The mix of organic and acquired growth pushed its 1994
market shares of approx. 6% towards 24% in 2013, making Sonova the world leading hearing aid
supplier. In a shorter timeframe, by realizing sales growth of 8.7% in 2013/14 (10.8% in 2012/13), it
recently generated absolute revenues of CHF 1’951m. The most recent figures are suggestive of a
convergence of competitors’ growth rates (Fig. 20). Indeed, Sonova’s relative sales expansion still takes
place on a larger absolute scale compared to smaller competitors, but H1 2014/15’s sales figures of
CHF 990.2m (+4.5% yoy) fell below the average expectation of analysts. With a FY sales growth
forecast of 6.8%, we are below management guidance of 7-9%.
Our cautious view is based on the discount policy in order to boost market shares in the US and the
strong decline in the Northern American market of 5.3% yoy. Sales were bolstered by an 18.1% yoy
growth in EMEA, although we doubt that this impressive growth due to favourable amendments of
reimbursement schemes (especially in Germany and UK) is of an enduring nature.
Fig. 20: Benchmarking - Sales growth 2010-2014
25%
William Demant
20%
15%
GN Store Nord
10%
5%
Sonova
Cochlear
0%
-5%
'10/'11
'11/'12
'12/'13
'13/'14
Source: Sonova
Fig. 21: Benchmarking - EBIT margin
Operating margins: high under “normal” conditions
Ø
Ø
Ø
GN Store Nord
Cochlear
Sonova
William Demant
GN Store Nord
Cochlear
Sonova
Willam Demant
GN Store Nord
5%
Cochlear
Sonova
10%
William Demant
15%
0%
2011/12
2012/13
2013/14
Source: Annual reports, Reuters Eikon
Fig. 22: EBITA decomposition 2013/14
2'000
611
1'200
800
126
590
400
195
430
1'600
1'340
EBITA is one of Sonova’s key management variables. The aforementioned normalization effect and its
influence on margins became clear in 2012/13 (Fig. 24), when the adjustment amounted to CHF 203m
and pulled down EBITA margins down to 10.1% (normalized 21.5%).
20%
1'951
The margin bridge depicted in Fig. 22 shows Sonova’s operating margin drivers for 2013/14. The single
most important components are COGS (31.3%) and Sales and Marketing (30.2%). In relative terms as
percentage of sales, both of them remained in a narrow corridor between 2009/10 and 2013/14.
Leverage on R&D – as a key element of future profitability – could be achieved by spreading synergies
over several brands. In our view, Sonova and William Demant exhibit potential to this approach because
of their multi-brand strategy and presence in the cochlear segment. R&D consistently accounted for 67% of Sonova’s sales. According to management statements, this ratio is going to be maintained (7-8%
on a incurred basis) (Fig. 23). The comparison might be somewhat skewed with regard to different
capitalization policies applied and the importance of the retail business in the revenue mix. Sonova’s
expensed R&D relative to sales appears to be low compared to GN Resound and William Demant. One
reason might be a more efficient R&D set-up, as Sonova gained market shares regardless of fewer
relative spendings on innovation. However, we believe that returns on R&D will be subject to the law
of diminishing returns due to increasingly complex advancements in an environment of shrinking
product lifecycles.
25%
mCHF
Due to varying key performance metrics across our peer group, we take EBIT as a proxy for operational
efficiency. It forms the largest common denominator. The EBIT volatility throughout the periods under
consideration illustrates the inherent risk of product callbacks and recognition of provisions in this
industry, which add on top to paramount performance drivers. Normalization and exclusion of one-off
cost turn out to be dictums when reading annual statements (e.g. Cochlear 2012). Sonova was not
protected from these risks, as depicted in Fig. 21. Nevertheless, the group was able to achieve leading
positions in periods of “normal” business activity, approaching an EBIT margin of 20.7% in 2013/14.
G&A
EBITA
0
Retail and Cochlear: hitting the sweet spot?
Throughout the last 5 years net working capital as a percentage of sales oscillated in a narrow
bandwidth of around 10%. A strong increase of working capital has been offset by the growth of
Sonova’s cash position. With its 142 days of cash conversion, Sonova testifies a solid working capital
management compared to its competitors (Fig. 25). Due to its proven capability to generate cash flow
from operations (avg. CHF 194.7m versus avg. NWC of CHF 178.1m throughout the last four years), we
do not believe that working capital gives rise to concern.
Cash sources and utilization: changes ahead
Sonova’s fairly conservative approach towards debt is an important feature of the company – the
borrowing of funds for the acquisition of AB in 2009/10 marked an extraordinary move. On the outflow
side throughout the last five years, acquisitions in the amount of CHF 941m (50.3%) are an impressive
illustration of Sonova’s aggressive strategy of external growth.
Gross
Profit
R&D
S&M
Fig. 23: Benchmarking: Expensed R&D
10%
GN Resound
9%
8%
William Demant
7%
6%
Sonova
5%
4%
2010
2011
2012
2013
Source: Annual reports
Note: See Appendix 4L for capitalization rates and further information
Fig. 24: EBITA margin development
700
600
500
30%
Normalized
EBITA (margin)
25%
20%
400
15%
300
200
10%
100
5%
0
0%
EBITA margin
Cash flow and working capital
COGS
Source: Sonova
Note: See Appendix 2H for further information
as % of sales
Following the acquisition of Advanced Bionics in 2009/10 for CHF 510m, an AB product callback in 2006
forced Sonova to build up provisions totalling CHF 250m (CHF 198m increase in 2012/13 after a
Kentucky court adjudged high punitive damages to a patient). The management considers the liabilities
associated with this product malfunction as being sufficiently covered by existing provisions. With its
tremendous sales growth (4-year CAGR of 66.8%), EBITA break-even in 2012/13 (6.6% EBITA margin
2013/14), and a 10% share of total sales, Cochlear (CI) now turns into a profitable business. We further
elaborate on future sales growth and margin expansion in the valuation section.
Sales
EBITA (mCHF)
Sonova does not reveal performance figures for its retail business which comprised more than 2’000
outlets in 2013 and is assumed to be more profitable than sales through other channels. According to
management statements in the course of November’s H1 result presentation, the company-owned
stores account for approx. 10% of its entire hearing instrument sales. Analysts attribute significant
higher weight to this distribution channel – expecting it to account for up to 30% of revenues. The
company’s reserved disclosure corresponds to William Demant (expected to run more than 1’000
stores), as the OEM’s retail advances represent direct invasions into territory occupied by independents.
Sonova’s ongoing consolidation initiative, first initiated in Northern America, aims at the harmonization of
branding and the IT-landscape. Due to management’s commitment to retail expansion, we expect this
streamlining to spill over into other markets – swaying EBITA margins, but to a declining extent in the
later half of the forecast period (counteracting standardization gains and scale effects).
Source: Sonova, Team assessment
Note: See Appendix 2 for further information
Source: Sonova, Team assessment
6
400
99
DIH
192
DSO
-118
DPO
65
95
100
162
123
0
73
-45
-52
-67
William
Demant
Sonova
-200
GN
Resound
Cochlear
Source: Reuters Eikon, Team assessment
20%
0.5
10%
1.98
1.0
2.02
30%
2.06
40%
1.5
2.10
2.0
2.15
50%
1.94
2.5
0.0
Cash as % of current assets
Fig. 26: Liquidity development
Another important factor that has to be taken into account is the impact of currencies. A substantial part
of the cost base is denominated in CHF (e.g. R&D, SG&A). On the other hand, US sales were in the
mid-thirties and EU distribution recently exceeded 40% (CH < 2%). In FY 2013/14, currency
movements exercised a negative impact of 3% on the top line and 5.1% on EBITA. With respect to
the ongoing rebalancing of the sales mix it is difficult to estimate whether FX are supporting or burdening
future margins.
In conclusion, past performance cannot be the only reason for high market expectations on
Sonova. As the depicted performance benchmarks reveal, the group did not outperform its peers.
Looking ahead, the comparison of analysts’ consensus on peer earnings and our estimates on Sonova’s
bottom line shows that high expectations remain in force (Fig. 3).
172
-100
Current ratio
The historic figures underscore Sonova’s healthy financial position. In light of our industry structure
assessment, we currently see no basis for an operational margin expansion beyond the stated
target in the mid-twenties within a 3y horizon. Potential gains in the retail and cochlear business,
which are assumed to be margin contributors, are expected to be settled out against fierce pressure on
wholesale margins. Despite the fact that the underlying growth drivers are intact, topline growth depends
on many variables other than attractive products alone. The fight for market shares fuels competition
– e.g. Sonova’s decision to sell premium products via the US retail chain CostCo – and puts average
selling prices, as well as margins at risk
100
85
200
We introduce ROIC in order to analyse Sonova’s ability to deploy capital into attractive returns from
operations. Except for the circumstances in 2012/13, Sonova was constantly able to create economic
profits (ROIC > WACC). However, it becomes clear that the company performed below the peer
group average throughout the last 3 years (Fig. 28) due to its profit collapse following the AB product
liability issue and the integration efforts of acquired businesses. Recently, Sonova reached a FY ROIC of
16.4%. Comparably, William Demant achieved stable margins of around 26%. This prepares an
interesting point of departure for the hereinafter discussed multiple valuation.
Sound performance, but not drowning out peers
194
142
300
2.36
The final repayment of debt in H1 2014/15 renders the company debt free. Referring to the low tax rate
the management assumes to maintain and a healthy position in any negotiations with banks in order to
finance possible future acquisitions, we do not consider this as an inefficient capital structure.
Fig. 25: Cash conversion cycle 2013/14
Days
Returns to shareholders through dividends and buybacks account for “only” 23.7% – the now proclaimed
shift towards a TSR strategy (CHF 500m repurchases until 2017 and a 40% target dividend ratio – see
Appx. 5E) marks a change, as large OEM deals become less probable due to regulatory reasons and
Siemens’ hearings aids business being sold. Meanwhile, Sonova projects retail acquisitions in the
amount of CHF 50-70m p.a.
0%
Source: Sonova, Team assessment
Note: See Appendix 4 for further information
Fig. 27: Utilization of cash: last 5 years
Absolute values in parenthesis (mCHF)
VALUATION
24% (457)
CAPEX
Our price target results from the combination of the Discounted Cash Flow Method (DCF) and the P/E
multiple analysis. We consider the P/E multiple preferable over EV/EBITDA for two reasons: a) Sonova’s
key performance metric is EBITA, b) EBITDA ratios do not reflect Sonova’s low tax rate and thus distorts
the comparison. By contemplating DCF and P/E analysis we expect to capture both our view on
fundamental performance and the market perspective on the sector and Sonova in particular.
DCF analysis yields a price target of CHF 119
22% (412)
Dividends
2% (26)
Interest and
other Fin.
CF
50% (941)
Acquisitions
& other Inv.
CF
Based on the underlying assumptions described in the following, we obtain a 19% downside compared
to the closing price of November 27th.
2% (32)
Buybacks
Sales lower than consensus expectations
30%
25%
20%
Mid-twenties EBITA margin achievable in a 4-year timeframe
We expect the progressing shift of sales mix including a more prominent role of sophisticated CI
Ø
Cochlear
GN
William Demant
Sonova
Cochlear
GN
William Demant
Sonova
0%
2011/12
2012/13
2013/14
Source: Sonova, Team assessment
Note: See Appendix 4 for further information
Fig. 29: Revenue expectations
CAGR = 5.3%
3'000
2'500
500
2'563
2'442
2'322
2'202
1'000
990
1'500
1'093
2'000
1'951
mCHF
It all adds up to a topline CAGR of 5.3% until 2019. Within our sales forecast, the impact of the
postulated price pressure varies across segments and results in a conservative growth assumption.
Cochlear implants (CHF +183m), standard HI (CHF +156m) and premium HI (CHF +110m) are the
strongest contributors to 2018/19’s revenue forecast amounting to CHF 2’563m. (Fig. 29, Appx. 1F).
Notwithstanding the preceding, there are two main factors bearing the potential to invalidate our
assumptions: a) negative spill over effects of the recent aversion displayed by US independent
dispensers, b) unexpected sales mix shifts possibly unfolding uplifts.
Cochlear
5%
GN
10%
4.2% CAGR in Standard HI: Due to the relatively low level of technical sophistication, centralized
purchase volumes and geographic sales shift, this product category is most prone to intensified price
pressure. However, we estimate this downside pressure to be fully compensated by volume growth –
largely driven by the development of a “first-time” customer base in emerging economies. Thus, we
expect standard devices to grow at a CAGR in a narrow corridor around our market expectation of 4.2%.
12.2% CAGR in Cochlear Implants: We expect the overall cochlear market to grow at a CAGR of
12.5%. Sonova, as the incumbent 3rd power (15% market share in 2013) in the highly concentrated
cochlear implant business, might face different challenges compared to its dominating role within the HI
market – neither being the market leader nor the disruptive newcomer. For this reason we expect
Sonova to face price competition from Med-El and strategic offenses from newcomers such as William
Demant. Moreover, strategic moves might be retaliated by the Australian market leader Cochlear.
Ø
Ø
15%
William Demant
4.1% CAGR in Advanced HI: The advanced HI segment is expected to grow at a marginally slower
pace than the market. As Sonova CEO admitted “standard HI brings market share, premium HI brings
value and advanced HI is located somewhere in the middle”. Caught between those segments, we
attribute a higher impact of price pressure than for the premium segment and less amplified volume
growth opportunities compared to the standard segment – ultimately pushing the growth rate 20bp below
the overall expected CAGR throughout the forecast period.
Fig. 28: Benchmarking – ROIC
Sonova
4.7% CAGR in Premium HI: We expect growth in the Premium HI market to be driven mainly by a)
expansion of retail business, b) benefits from Lyric, c) sales mix-induced mitigation of price pressure
compared to other product categories. Industry estimates are ranging from 1% to 3% downward
pressure on ASP. We therefore believe that this segment will grow at a faster pace than the overall HI
market. (please see Appx. 1 for further details)
Source: Sonova, Team assessment
1'795
In the two preceding financial years, Sonova has achieved growth rates above 8% on the top line, which
we believe will not be sustained in the medium term. We expect a CAGR of 5.3% until 2019 in group’s
total sales, resulting from a CAGR of 4.3% and 12.2% for HI and CI business respectively (Fig. 29).
0
Source: Sonova, Team assessment
Note: See Appendix 1 for further information
7
products and retail as a contraposition to larger improvements of COGS. Positive effects of volume
growth are interfered by factors such as labour cost for higher-end products (compared to standard
devices) and input parts, which sway over increased bargaining power. Connect Hearing and further
retail acquisitions might temporarily increase staff costs. We assume occasional shifts towards higher
depreciation in association with shorter product cycles and extended retail operations. Therefore, we
anticipate COGS to contribute 260bp to 2018/19’s EBITA margin, equaling 28.7% of sales by the end of
the forecast period (Fig. 30).
R&D expenses are projected to oscillate between 7-8% (gross) of revenues or 6.7% in expensed terms
– accounting for a negative effect of 24bp on 2018/19’s EBITA margin. This factors in our critical stance
on R&D leverage, which is assumed to be offset by shortening product launch intervals and more
complex research projects (Appx. 2B & 4L). The ongoing consolidation of retail activities, as well as
comparable initiatives of future acquisitions lead to a negative effect of 83bp until 2016. According to the
CFO, Dr. Grevener, a large proportion of the associated expenses is already considered in actual
figures. For the latter half of the forecast period, we expect efficiency gains to unfold and S&M catching
29.5% (-70bp) of sales. A G&A efficiency gain by means of process streamlining is factored in by a
decrease of 90bp. This rather conservative assumption is explained by potentially more complex
administrative tasks induced by the corporate strategy, such as government relation work due to
geographic rebalancing.
In conclusion, we believe that the 25% EBITA margin is realistically achievable and is more than
accounted for in the share price. Our prediction suggests the achievement of the target in the
financial year 2017/18 – one year later than predicted (Fig. 24).
From EBIT to FCF estimations
Over the period of analysis, we forecast capital expenditures to represent a higher percentage of sales
than during the previous three years (5.5% vs. avg. 4.8%), mainly due to the proclaimed annual
acquisitions in the amount of CHF 50-70m. The expansion strategy is reflected in our CAPEX forecast,
which exceeds annual D&A by approx. 22% – therewith assuming inorganic expansion opportunities
to be exploited. Furthermore, we expect net working capital (Appx. 4B) to remain at a relative constant
level of sales (~10.5%). The tax rate applied to our adjusted operating income has been kept constant at
13.5%, in line with Sonova’s expectations (reaffirmed in H1 analyst call).
Estimating the risk-adjusted discount rate
We apply a WACC of 7.9% for discounting the FCF (Fig. 31). The company has a negative net debt
position, hence considered zero for the computation of the risk-adjusted discount rate. Operating leases
are considered as debt – with a PV approximated by discounting obligations with an after-tax cost of
debt of 4% under a lease contract perpetuity assumption. The computation of cost of equity bases on
CAPM using the following inputs: a) both risk free rate (30y govt. bonds) and market risk premium
weighted for Sonova’s regional activities (Switzerland, DE, UK, US) and investor provenience, b)
adjusted raw beta (Bloomberg metric) by means of regressing daily excess returns of Sonova and SMI
throughout the last 3 years (Appx. 3B).
Fig. 30: EBITA margin bridge 2018/19
mCHF
666
31.3%
6.4%
30.2%
% of sales 18/19:
28.7%
6.7%
29.5%
-0.2%
0.7%
R&D
S&M
10.0%
9.1%
26%
26%
24%
22%
22%
0.9%
2.6%
20%
18%
16%
14%
2013/14
COGS
G&A
2018/19E
Source: Team assessment
Note: See Appendix 2 for further information
Fig. 31: WACC computation
30-year government bond (rf)
Market risk premium (rm-rf)
Adjusted beta (βu)
Cost of equity (re)
Pre-tax cost of debt (rd)
After-tax cost of debt (rdt)
Tax rate (tc)
Net cash (mCHF)
Market cap (mCHF)
Lease value (mCHF)
Debt + Equity + Leases
WACC
2.1%
5.8%
1.0
7.9%
4.5%
4.0%
13.5%
311’525
9’814’241
130’839
9’945’080
7.9%
Source: Team assessment
Note: See Appendix 3B for further information
Fig. 32: Sensitivity analysis
WACC / Terminal growth matrix and share price effect
WACC
Conservative views on terminal growth
The hearing aid industry is characterized by shortening product cycles. At the same time our
assessment leads to moderated penetration rates estimates and diminishing returns on R&D. In order to
reconcile between these forces, we are convinced that a conservative terminal growth rate of 2.4%,
reflects a maturing market characterized by price developments, which are offsetting volume
growth, a structural limit of penetration rates and a convergence of competitors’ offerings. Admittedly, as
the terminal value represents a massive 80% of the firm value, even small changes to the perpetual
growth exercise a tremendous impact on our valuation.
430
% of sales 13/14:
8.7%
2.0%
-32%
2.1%
-32%
2.2%
-31%
Perpetual growth rate
2.3% 2.4% 2.5%
-30% -29% -28%
2.6%
-28%
2.7%
-27%
2.8%
-26%
8.5%
-30%
-29%
-29%
-28%
-27%
-26%
-25%
-24%
-23%
8.3%
-28%
-27%
-26%
-25%
-24%
-23%
-22%
-21%
-20%
8.1%
-26%
-25%
-24%
-23%
-22%
-20%
-19%
-18%
-17%
7.9%
-23%
-22%
-21%
-20%
-19%
-17%
-16%
-15%
-14%
7.7%
-20%
-19%
-18%
-17%
-15%
-14%
-13%
-11%
-10%
7.5%
-17%
-16%
-15%
-13%
-12%
-11%
-9%
-8%
-6%
7.3%
-14%
-13%
-11%
-10%
-8%
-7%
-5%
-4%
-2%
7.1%
-10%
-9%
-8%
-6%
-4%
-3%
-1%
1%
3%
Source: Team assessment
Note: See Appendix 3D for further information
From firm value to equity value
In order to account for the effects of operating leases (lower EBIT figure and higher capital productivity)
we reconcile EBIT for the interest component of lease expenses. By definition, this does not change the
value of the company, but provides the freedom to adjust profitability figures. Neither of the proxies for
the PV of leased assets (industry multiple and discounting method) increases the WACC. The PV of
lease obligations is deducted from EV. As further adjustments, we subtract minorities, unfunded pension
obligations and non-operative derivatives. We add investments in associates and cash to the value of
core operations – the latter one implicitly by deducting net debt from EV (Appx. 3C). The division of
equity value and the diluted number of shares results in a share price of CHF 119.
Fig. 33: Implied DCF
Sales growth forecast vs. sales CAGR
15%
12%
9%
DCF analysis reveals considerably inflated price
6%
In order to assess the robustness of our DCF valuation, we sensitized the result for the most influential
inputs, namely WACC and the terminal growth rate. The most conservative scenario marks a downside
of -32.4%. An optimistic combination of a 7.1% discount rate and a terminal growth rate of 2.8% results
in an upside of 2.9%. These results reinforce our opinion that the moderated view on industry growth
rates and Sonova’s strategic agenda offer little scope for share prices beyond the current level (Fig.
32).
3%
The implied DCF valuation reveals a required annual revenue growth of 12.2% for the period under
consideration in order to justify the current share price (Fig. 33). Such an expansion appears to be
unachievable. Well aware of the fact that this “coarse” method does not comprise accompanying
margin improvements, our business analysis does not reveal operational efficiency gains, which
intrinsically justify the contemporary market valuation. We identify potential future margin improvements
as a result of a more prominent role of the cochlear business and Lyric within the sales mix.
0%
10/11 11/12 12/13 13/14 14/15E 15/16E 16/17E 17/18E 18/19E
Sales growth
Fig. 34: Trailing P/E vs. EPS growth
35
Cochlear
The multiple valuation focuses on the P/E ratio as metric of comparison. From our perspective, this
widely used relation offers the broadest base for comparison, even though earnings are subject to
different accounting treatments under managerial discretion. For the composition of the peer group we
followed a two-pillared approach: first, a larger European med-tech basket, which is fine-tuned by means
of a revenue correlation for the preceding five periods – ultimately resulting in seven publicly listed
peers.
Secondly, a sample of three direct competitors provides insight into the market valuation of hearing aid
companies: the sector group consists the publicly listed competitors William Demant, GN Store Nord and
Cochlear Ltd., the latter one being considered for Sonova’s growing importance of the CI business
(estimated to approach 15% in 2018/19). The weighting of two close competitors and the pure-play
Trailing P/E
30
P/E analysis: an over-expensive company in an expensive industry
Implied CAGR
Source: Team assessment
Note: Required sales CAGR implied by current share price
See Appendix 3 for further information
Sonova
25
GN ReSound
20
William Demant
15
10
5
0
0%
5%
10%
15%
20%
25%
30%
EPS growth
Source: Team assessment
Notes: Bubble size represents market capitalization
See Appendix 3 for further information
8
Download Winning Report 2015-2
Winning Report 2015-2.pdf (PDF, 3.38 MB)
Download PDF
Share this file on social networks
Link to this page
Permanent link
Use the permanent link to the download page to share your document on Facebook, Twitter, LinkedIn, or directly with a contact by e-Mail, Messenger, Whatsapp, Line..
Short link
Use the short link to share your document on Twitter or by text message (SMS)
HTML Code
Copy the following HTML code to share your document on a Website or Blog
QR Code to this page

This file has been shared publicly by a user of PDF Archive.
Document ID: 0000517444.