Practice Exam 4 (PDF)
File information
Title: Microsoft Word - Practice Exam 4.docx
This PDF 1.3 document has been generated by Word / Mac OS X 10.10.3 Quartz PDFContext, and has been sent on pdf-archive.com on 06/12/2016 at 00:18, from IP address 199.253.x.x.
The current document download page has been viewed 436 times.
File size: 350.28 KB (5 pages).
Privacy: public file


File preview
Practice Exam #4
No notes, calculators, or R programming will be allowed during this exam. No use of R is required to
complete the questions below. The exam will be short enough for students to complete within the allotted
2 hours.
Case Study #1
You are the CHRO of Kramerica Industries, a consulting firm. You are tasked with increasing employee
productivity AND improving hiring practices over the next eighteen months. Use the dataset described
below to answer the questions and develop a plan of action for each. The appendix has all of the
information you’ll need to answer each question.
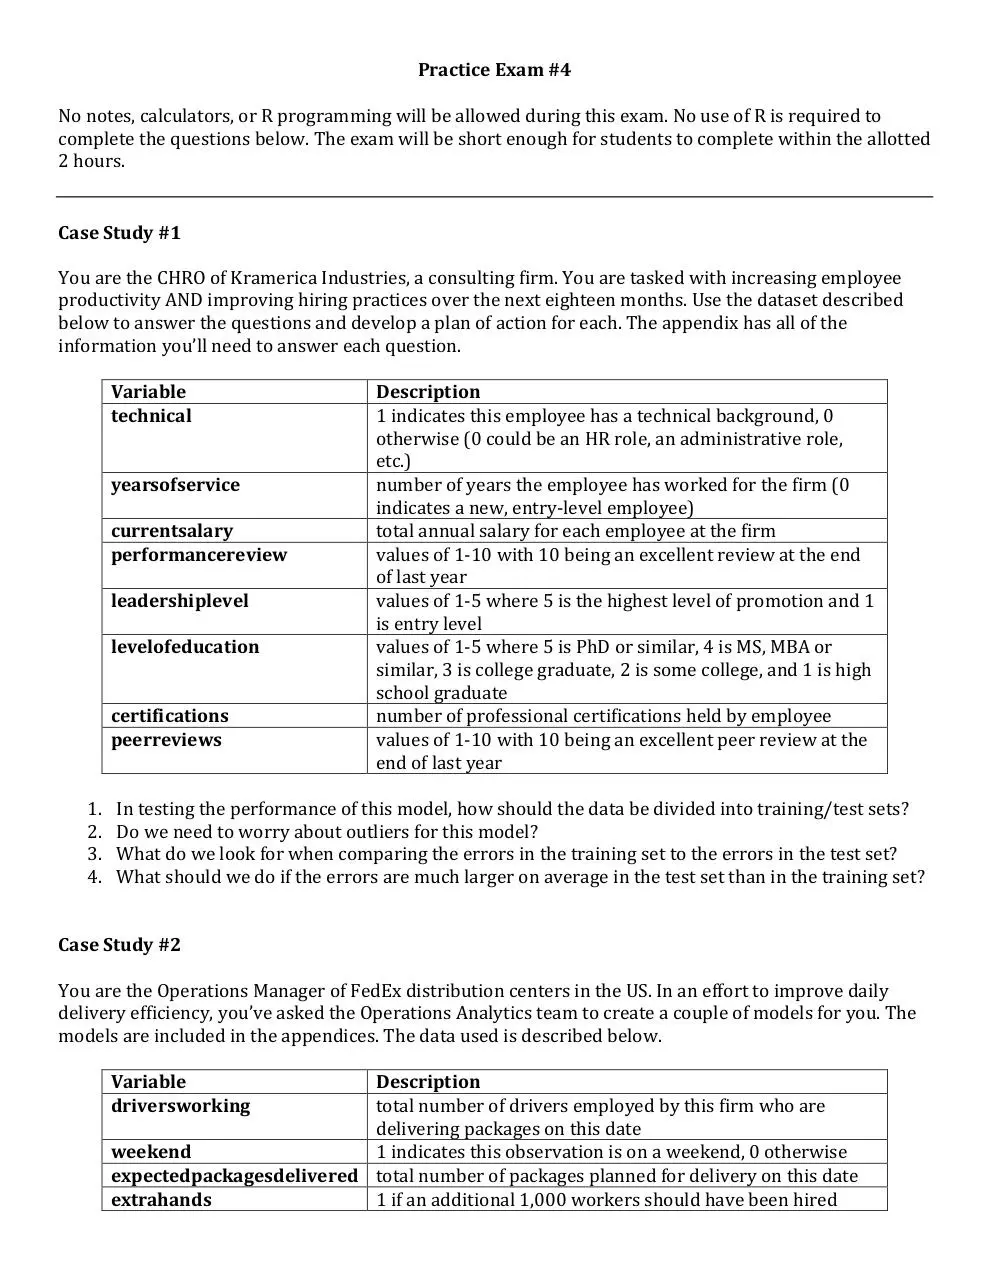
Variable
Description
technical
1 indicates this employee has a technical background, 0
otherwise (0 could be an HR role, an administrative role,
etc.)
yearsofservice
number of years the employee has worked for the firm (0
indicates a new, entry-‐level employee)
currentsalary
total annual salary for each employee at the firm
performancereview
values of 1-‐10 with 10 being an excellent review at the end
of last year
leadershiplevel
values of 1-‐5 where 5 is the highest level of promotion and 1
is entry level
levelofeducation
values of 1-‐5 where 5 is PhD or similar, 4 is MS, MBA or
similar, 3 is college graduate, 2 is some college, and 1 is high
school graduate
certifications
number of professional certifications held by employee
peerreviews
values of 1-‐10 with 10 being an excellent peer review at the
end of last year
1. In testing the performance of this model, how should the data be divided into training/test sets?
2. Do we need to worry about outliers for this model?
3. What do we look for when comparing the errors in the training set to the errors in the test set?
4. What should we do if the errors are much larger on average in the test set than in the training set?
Case Study #2
You are the Operations Manager of FedEx distribution centers in the US. In an effort to improve daily
delivery efficiency, you’ve asked the Operations Analytics team to create a couple of models for you. The
models are included in the appendices. The data used is described below.
Variable
Description
driversworking
total number of drivers employed by this firm who are
delivering packages on this date
weekend
1 indicates this observation is on a weekend, 0 otherwise
expectedpackagesdelivered total number of packages planned for delivery on this date
extrahands
1 if an additional 1,000 workers should have been hired
weatherconditions
pctoversized
temporarily for this day
100% indicates perfect weather, 0% indicates bad weather
(snow, no packages delivered)
percent of packages that are oversized on this date
5.
6.
7.
8.
9.
Why do we sometimes include interaction terms in a model?
Why do we sometimes include nonlinear terms in a model?
Interpret the interaction terms in Appendix 2, if any.
Interpret the nonlinear terms in Appendix 2, if any.
What type of model should we create to predict how many drivers should be working on a given
day?
10. What type of model should we create to predict whether or not we need extra hands on a given
day?
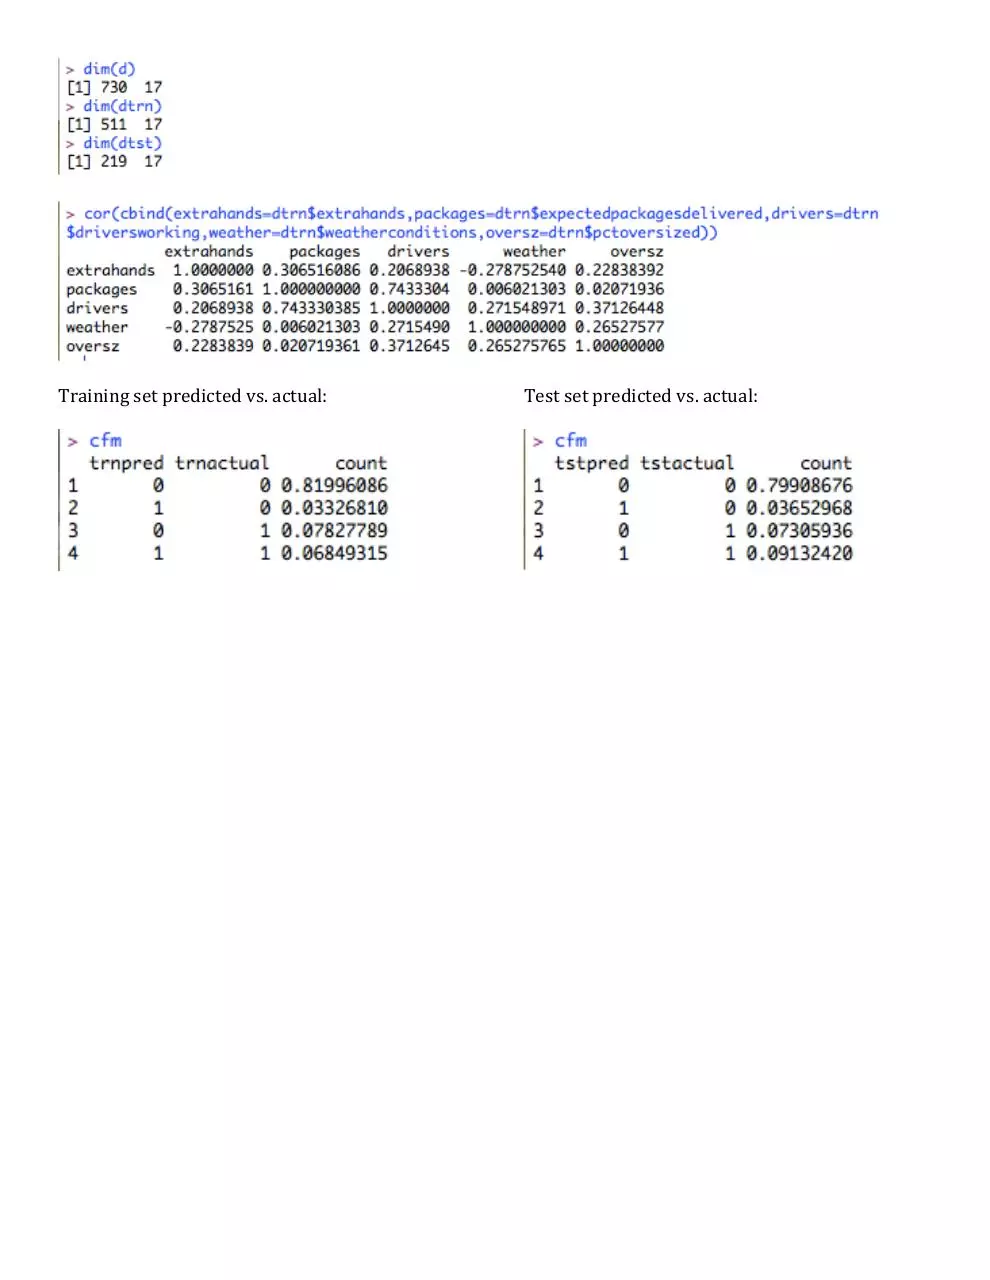
11. Based on Appendix 3, does the model predict as well out of sample as it does in sample? (Is the
model stable?
12. Based on Appendix 3, and specifically the confusion matrix of the test set, how often is this model
correct in its predictions?
13. Based on Appendix 3, and specifically the confusion matrix of the test set, how often is the model
incorrect in its predictions?
14. Based on Appendix 3, and specifically the confusion matrix of the test set, what could be the
economic impact when the model incorrectly predicts 0?
15. Based on Appendix 3, and specifically the confusion matrix of the test set, what could be the
economic impact when the model incorrectly predicts 1?
There is no appendix to help answer these questions, but these may appear on the exam:
16. What can a decision tree do?
17. How many types of statistical decision trees are there?
18. Compare two error distributions and choose whether you would prefer to use a decision tree or a
linear regression for this problem.
19. Which model should you choose if you want to understand relationships between predictors and a
continuous response? Any words of caution? (Hint: First decide which models you have to choose
from.)
20. Which model should you choose if you want to predict outcomes of a continuous response? Any
words of caution? (Hint: First decide which models you have to choose from.)
21. Compare two confusion matrices and choose whether you would prefer to use a decision tree or a
logistic regression for this problem based on their results.
22. Which model should you choose if you want to understand relationships between predictors and a
binary response? Any words of caution? (Hint: First decide which models you have to choose
from.)
23. Which model should you use if you want to predict outcomes of a binary response? Any words of
caution? (Hint: First decide which models you have to choose from.)
24. What issues might I run into when using a decision tree model that I don’t run into when I use a
linear regression or logistic regression model?
25. What issues might I run into when using a linear or logistic regression model that I don’t run into
when I use a decision tree?
Appendix 1
Appendix 2
Appendix 3
Training set predicted vs. actual:
Test set predicted vs. actual:
Download Practice Exam 4
Practice Exam 4.pdf (PDF, 350.28 KB)
Download PDF
Share this file on social networks
Link to this page
Permanent link
Use the permanent link to the download page to share your document on Facebook, Twitter, LinkedIn, or directly with a contact by e-Mail, Messenger, Whatsapp, Line..
Short link
Use the short link to share your document on Twitter or by text message (SMS)
HTML Code
Copy the following HTML code to share your document on a Website or Blog
QR Code to this page

This file has been shared publicly by a user of PDF Archive.
Document ID: 0000517518.