MORI Veracity Index November 2016 Tables (PDF)
File information
Title: Ipsos MORI Veracity Index 2016 Tables
Author: Ipsos MORI / Mumsnet
This PDF 1.6 document has been generated by PScript5.dll Version 5.2.2 / GPL Ghostscript 9.06, and has been sent on pdf-archive.com on 14/12/2016 at 19:17, from IP address 62.25.x.x.
The current document download page has been viewed 334 times.
File size: 447.23 KB (51 pages).
Privacy: public file


File preview
Page 1
J15063333-41-03 14-OCT - 01-NOV 2016
INTERNAL
VERACITY INDEX 2016
7 Nov 2016
Table 1
VE01 - Now I will read you a list of different types of people. For each would you tell me if you
generally trust them to tell the truth, or not? Summary
Base: All adults age 15+ in Great Britain
The
ordinary
Managers man/woman
in the
in the
Judges
NHS
street
Bankers
Business
Leaders
Civil
Servants
Doctors
Clergy/
Priests
Estate
agents
Govern
ment
Ministers
Unweighted Base
1019
1019
1019
1019
1019
1019
1019
1019
1019
1019
Weighted Base
1019
1019
1019
1019
1019
1019
1019
1019
1019
1019
Journa
lists
Politi
cians
generally
Poll
sters
Scien
tists
1019
1019
1019
1019
1019
1019
1019
1019
1019
1019
The
Police
Trade
Union
officials
1019
1019
1019
1019
1019
1019
1019
1019
1019
1019
TV News
Teachers Readers
Local
councillors
Lawyers
Charity
chief
execs
Economists
Nurses
1019
1019
1019
1019
1019
1019
1019
1019
Hairdressers
Tell the truth
375
37%
340
33%
566
56%
932
91%
703
69%
310
30%
204
20%
245
24%
826
81%
485
48%
666
65%
149
15%
499
49%
819
80%
895
88%
680
67%
724
71%
442
43%
439
43%
528
52%
693
68%
473
46%
486
48%
947
93%
Not tell the truth
596
58%
613
60%
397
39%
80
8%
265
26%
661
65%
770
76%
721
71%
163
16%
465
46%
294
29%
833
82%
431
42%
154
15%
96
9%
286
28%
270
27%
492
48%
528
52%
453
44%
267
26%
464
46%
456
45%
61
6%
49
5%
65
6%
56
5%
8
1%
51
5%
47
5%
44
4%
53
5%
30
3%
69
7%
59
6%
37
4%
89
9%
46
5%
28
3%
53
5%
25
2%
85
8%
52
5%
39
4%
59
6%
82
8%
77
8%
12
1%
-221
-22%
-273
-27%
169
17%
852
84%
438
43%
-351
-34%
-566
-56%
-476
-47%
663
65%
21
2%
372
37%
-684
-67%
68
7%
665
65%
799
78%
394
39%
454
45%
-50
-5%
-89
-9%
75
7%
426
42%
9
1%
30
3%
886
87%
Don't know
Net difference
Page 2
J15063333-41-03 14-OCT - 01-NOV 2016
INTERNAL
VERACITY INDEX 2016
7 Nov 2016
Table 2
VE01 - Now I will read you a list of different types of people. For each would you tell me if you
generally trust them to tell the truth, or not? Bankers
Base: All adults age 15+ in Great Britain
GENDER
TOTAL MALE FEMALE
(a)
(b)
(z)
AGE
GENERATION
15-24
(c)
25-34
(d)
35-44
(e)
45-54
(f)
55-64
(g)
65+
(h)
BABY
GEN Y GEN X BOOMERS
(i)
(j)
(k)
SOCIAL GRADE
GOVERNMENT OFFICE REGION
PRE
WAR
(l)
AB
(m)
C1
(n)
C2
(o)
DE
(p)
NORTH MIDLANDS SOUTH LONDON
(q)
(r)
(s)
(t)
WORKING STATUS
NOT
SCOTLAND WALES WORKING WORKING
(u)
(v)
(w)
(x)
UNWTD
TOTAL
Unweighted Base
1019
551
468
138
143
130
130
167
311
299
162
354
202
272
329
194
224
258
278
191
150
88
54
440
579
1019
Weighted Base
1019
498
521
155
169
159
175
141
220
343
209
316
148
276
276
219
248
246
265
233
137
87*
51*
568
451
1019
30
34%
29
58%zqrs
201
35%
174
39%
363
36%
21
42%
339
60%
257
57%
600
59%
Tell the truth
375
192
37%ks 39%
183
35%
74
55
48%zdg 32%
59
37%
62
35%
42
30%
83
38%
133
39%k
82
39%
95
30%
63
42%k
89
32%
102
37%
71
33%
112
91
45%zmo 37%
98
37%
68
29%
59
43%s
u
Not tell the truth
Don't know
Net difference
596
283
58%cpt 57%
v
313
60%
76
49%
105
62%
92
57%
105
60%
92
65%c
126
57%
196
57%
115
55%
207
65%zjl
77
52%
173
63%p
159
58%
138
63%p
126
51%
139
57%
153
58%
158
68%zqt
v
67
49%
10
8%u
49
5%
23
5%
26
5%
4
3%
9
5%
9
6%
8
5%
8
5%
11
5%
14
4%
12
6%
14
5%
9
6%
14
5%
15
5%
10
4%
10
4%
15
6%
15
6%
7
3%
-221
-22%
-91
-18%
-130
-25%
-2
-2%
-51
-30%
-32
-20%
-43
-24%
-50
-35%
-43
-19%
-64
-19%
-33
-16%
-112
-35%
-14
-9%
-83
-30%
-57
-21%
-66
-30%
-14
-6%
-48
-20%
-55
-21%
-91
-39%
Proportions/Means: Columns Tested (5% risk level) - z/a/b - z/c/d/e/f/g/h - z/i/j/k/l - z/m/n/o/p - z/q/r/s/t/u/v - z/w/x
Overlap formulae used. * small base
-8
-6%
57
65%tv
1
1%
-27
-31%
8
16%
28
5%
20
5%
56
5%
-138
-24%
-83
-18%
-237
-23%
Page 3
J15063333-41-03 14-OCT - 01-NOV 2016
INTERNAL
VERACITY INDEX 2016
7 Nov 2016
Table 3
VE01 - Now I will read you a list of different types of people. For each would you tell me if you
generally trust them to tell the truth, or not? Bankers
Base: All adults age 15+ in Great Britain
TENURE
AREA
MARITAL STATUS
OWNED
BEING
RENTED
RENTED
OUTRIGHT
BOUGHT
FROM
FROM A
MAR/
BY
ON A
LOCAL
PRIVATE
SUBLIVISITOTAL HOUSEHOLD MORTGAGE AUTHORITY LANDLORD URBAN URBAN RURAL NG AS NGLE
(a)
(b)
(c)
(d)
(f)
(g)
(h)
(i)
(j)
(z)
Unweighted Base
1019
396
250
Weighted Base
1019
322
319
102
85*
MID
MARKET
(u)
TABLOID
(v)
UNWTD
TOTAL
567
146
600
245
170
139
62
251
566
279
191
318
156
145
144
97
1019
595
129
601
260
156
158
80*
291
488
259
191
274
232
118
125
87*
1019
117
40%
201
34%
56
43%
208
35%
113
43%zi
52
33%
59
37%
29
37%
115
40%
169
35%
90
35%
56
30%
91
33%
154
52%
375
63%zfh
66
51%
357
59%
142
55%
97
62%
94
60%
46
58%
159
55%
296
61%
158
61%s
124
65%s
168
61%s
43
50%zad
Not tell the truth
596
58%cfs
190
59%c
171
54%
37
44%
17
5%
20
6%
5
6%
5
2%
-75
-23%
-44
-14%
5
6%
-85
-39%
Proportions/Means: Columns Tested (5% risk level) - z/a/b/c/d - z/f/g/h - z/i/j/k - z/l/m/n/o - z/p/q/r/s - z/t/u/v
Overlap formulae used. * small base
FAMILY
(n)
295
128
40%d
49
5%gj
PRE
FAMILY
(m)
305
115
36%
-221
-22%
SINGLE
(l)
DAILY READERSHIP
221
375
37%dq
Net difference
WID/
DIV/
SEP
(k)
EDUCATION
GCSE/
POST O-LV/ A-LVL DEGR/
NO
FAMCSE/
OR MAST/ FORML BROAD
ILY
NVQ12 EQUIV PHD
QUAL SHEET
(o)
(p)
(q)
(r)
(s)
(t)
199
Tell the truth
Don't know
LIFESTAGE
65
30%
151
68%zbc
23
8%zg
-37
-12%
115
50%zpq
r
46
39%
51
40%
26
30%
363
36%
109
47%
69
58%
67
53%
56
65%
600
59%
18
3%
7
6%
36
6%j
5
2%
7
4%
4
3%
4
6%
17
6%
23
5%
12
5%
10
5%
15
5%
9
4%
4
3%
8
6%
5
5%
56
5%
-174
-29%
-10
-7%
-149
-25%
-29
-11%
-45
-29%
-35
-22%
-17
-21%
-44
-15%
-128
-26%
-68
-26%
-68
-36%
-77
-28%
6
3%
-23
-20%
-16
-13%
-30
-34%
-237
-23%
Page 4
J15063333-41-03 14-OCT - 01-NOV 2016
INTERNAL
VERACITY INDEX 2016
7 Nov 2016
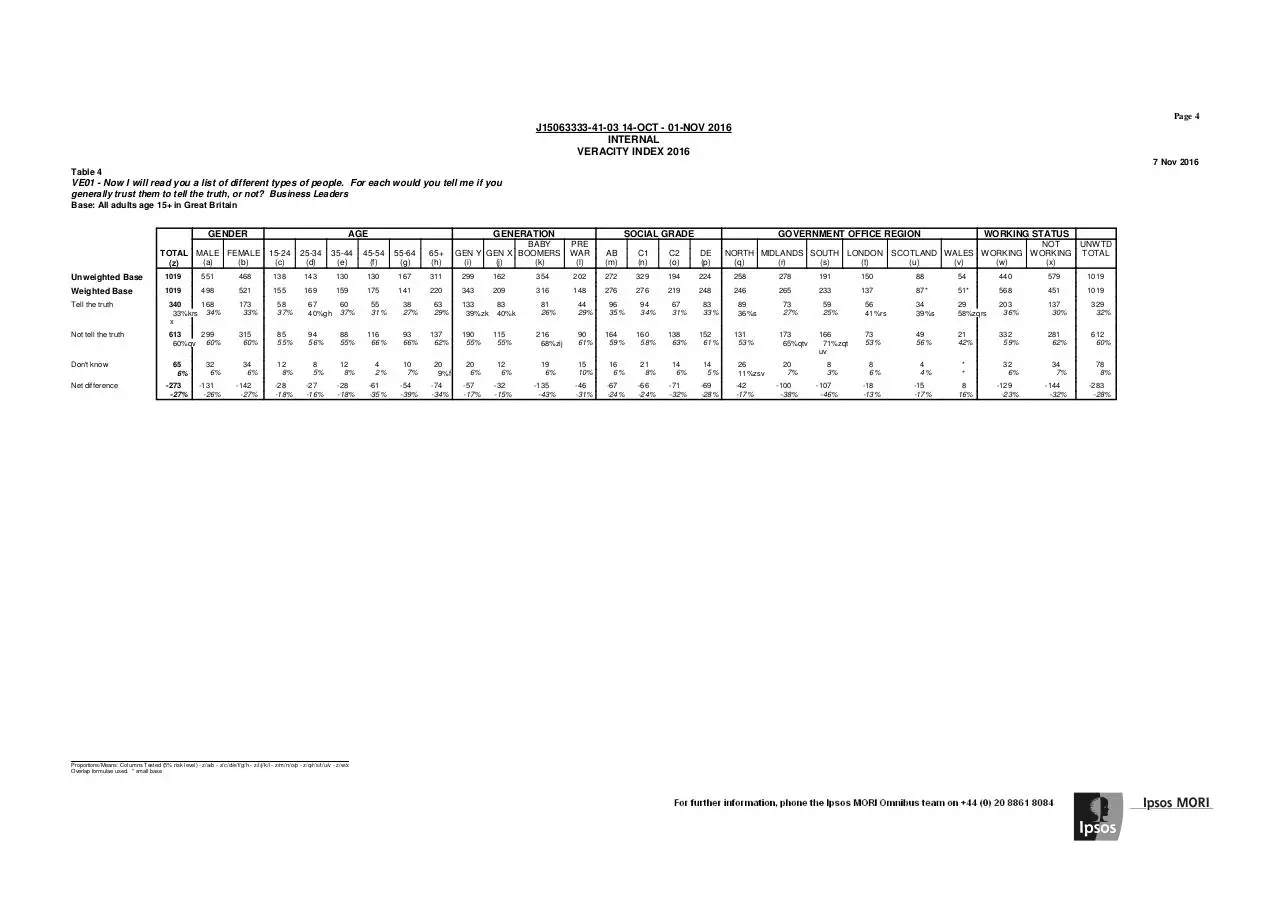
Table 4
VE01 - Now I will read you a list of different types of people. For each would you tell me if you
generally trust them to tell the truth, or not? Business Leaders
Base: All adults age 15+ in Great Britain
GENDER
TOTAL MALE FEMALE
(a)
(b)
(z)
AGE
GENERATION
15-24
(c)
25-34
(d)
35-44
(e)
45-54
(f)
55-64
(g)
65+
(h)
BABY
GEN Y GEN X BOOMERS
(i)
(j)
(k)
SOCIAL GRADE
GOVERNMENT OFFICE REGION
PRE
WAR
(l)
AB
(m)
C1
(n)
C2
(o)
DE
(p)
NORTH MIDLANDS SOUTH LONDON
(q)
(r)
(s)
(t)
WORKING STATUS
NOT
SCOTLAND WALES WORKING WORKING
(u)
(v)
(w)
(x)
UNWTD
TOTAL
Unweighted Base
1019
551
468
138
143
130
130
167
311
299
162
354
202
272
329
194
224
258
278
191
150
88
54
440
579
1019
Weighted Base
1019
498
521
155
169
159
175
141
220
343
209
316
148
276
276
219
248
246
265
233
137
87*
51*
568
451
1019
56
41%rs
34
39%s
29
58%zqrs
203
36%
137
30%
329
32%
73
53%
49
56%
21
42%
332
59%
281
62%
612
60%
*
*
Tell the truth
340
168
33%krs 34%
x
173
33%
58
37%
67
40%gh
60
37%
55
31%
38
27%
63
29%
Not tell the truth
613
299
60%qv 60%
315
60%
85
55%
94
56%
88
55%
116
66%
93
66%
137
62%
Don't know
Net difference
133
39%zk
190
55%
83
40%k
115
55%
81
26%
44
29%
96
35%
94
34%
67
31%
83
33%
216
68%zij
90
61%
164
59%
160
58%
138
63%
152
61%
65
6%
32
6%
34
6%
12
8%
8
5%
12
8%
4
2%
10
7%
20
9%f
20
6%
12
6%
19
6%
15
10%
16
6%
21
8%
14
6%
14
5%
-273
-27%
-131
-26%
-142
-27%
-28
-18%
-27
-16%
-28
-18%
-61
-35%
-54
-39%
-74
-34%
-57
-17%
-32
-15%
-135
-43%
-46
-31%
-67
-24%
-66
-24%
-71
-32%
-69
-28%
Proportions/Means: Columns Tested (5% risk level) - z/a/b - z/c/d/e/f/g/h - z/i/j/k/l - z/m/n/o/p - z/q/r/s/t/u/v - z/w/x
Overlap formulae used. * small base
89
36%s
131
53%
26
11%zsv
-42
-17%
73
27%
173
65%qtv
59
25%
166
71%zqt
uv
20
7%
8
3%
8
6%
4
4%
-100
-38%
-107
-46%
-18
-13%
-15
-17%
8
16%
32
6%
34
7%
78
8%
-129
-23%
-144
-32%
-283
-28%
Page 5
J15063333-41-03 14-OCT - 01-NOV 2016
INTERNAL
VERACITY INDEX 2016
7 Nov 2016
Table 5
VE01 - Now I will read you a list of different types of people. For each would you tell me if you
generally trust them to tell the truth, or not? Business Leaders
Base: All adults age 15+ in Great Britain
TENURE
AREA
MARITAL STATUS
OWNED
BEING
RENTED
RENTED
OUTRIGHT
BOUGHT
FROM
FROM A
MAR/
BY
ON A
LOCAL
PRIVATE
SUBLIVISITOTAL HOUSEHOLD MORTGAGE AUTHORITY LANDLORD URBAN URBAN RURAL NG AS NGLE
(a)
(b)
(c)
(d)
(f)
(g)
(h)
(i)
(j)
(z)
Unweighted Base
1019
396
250
Weighted Base
1019
322
319
102
85*
126
39%za
24
29%
Tell the truth
340
33%o
97
30%
Not tell the truth
613
60%bf
202
63%b
170
53%
51
60%
65
6%d
23
7%d
23
7%
9
11%d
Don't know
Net difference
-273
-27%
-105
-33%
-45
-14%
-27
-31%
Proportions/Means: Columns Tested (5% risk level) - z/a/b/c/d - z/f/g/h - z/i/j/k - z/l/m/n/o - z/p/q/r/s - z/t/u/v
Overlap formulae used. * small base
LIFESTAGE
WID/
DIV/
SEP
(k)
SINGLE
(l)
PRE
FAMILY
(m)
FAMILY
(n)
EDUCATION
DAILY READERSHIP
GCSE/
POST O-LV/ A-LVL DEGR/
NO
FAMCSE/
OR MAST/ FORML BROAD
ILY
NVQ12 EQUIV PHD
QUAL SHEET
(o)
(p)
(q)
(r)
(s)
(t)
MID
MARKET
(u)
TABLOID
(v)
UNWTD
TOTAL
199
305
567
146
600
245
170
139
62
251
566
279
191
318
156
145
144
97
1019
221
295
595
129
601
260
156
158
80*
291
488
259
191
274
232
118
125
87*
1019
76
35%
112
38%
185
31%
44
34%
201
33%
96
37%
43
28%
64
40%o
31
39%
108
37%o
137
28%
91
35%
70
36%
92
34%
74
32%
44
37%
41
32%
29
34%
329
32%
138
63%
156
53%
380
64%zf
77
60%
360
60%
149
57%
104
66%
87
55%
45
57%
159
55%
320
152
66%zln 58%
107
56%
166
61%
147
63%
71
60%
79
63%
53
61%
612
60%
30
5%
8
6%
40
7%
16
6%
9
6%
7
5%
3
4%
24
8%
31
6%
17
7%
15
8%
16
6%
11
5%
4
3%
6
5%
4
5%
78
8%
-195
-33%
-33
-26%
-160
-27%
-53
-20%
-61
-39%
-23
-15%
-14
-18%
-51
-17%
-183
-37%
-61
-23%
-37
-20%
-74
-27%
-72
-31%
-27
-23%
-38
-30%
-24
-27%
-283
-28%
6
3%
-62
-28%
27
9%g
-45
-15%
Page 6
J15063333-41-03 14-OCT - 01-NOV 2016
INTERNAL
VERACITY INDEX 2016
7 Nov 2016
Table 6
VE01 - Now I will read you a list of different types of people. For each would you tell me if you
generally trust them to tell the truth, or not? Civil Servants
Base: All adults age 15+ in Great Britain
GENDER
TOTAL MALE FEMALE
(a)
(b)
(z)
AGE
GENERATION
15-24
(c)
25-34
(d)
35-44
(e)
45-54
(f)
55-64
(g)
65+
(h)
BABY
GEN Y GEN X BOOMERS
(i)
(j)
(k)
SOCIAL GRADE
GOVERNMENT OFFICE REGION
PRE
WAR
(l)
AB
(m)
C1
(n)
C2
(o)
DE
(p)
NORTH MIDLANDS SOUTH LONDON
(q)
(r)
(s)
(t)
WORKING STATUS
NOT
SCOTLAND WALES WORKING WORKING
(u)
(v)
(w)
(x)
UNWTD
TOTAL
Unweighted Base
1019
551
468
138
143
130
130
167
311
299
162
354
202
272
329
194
224
258
278
191
150
88
54
440
579
1019
Weighted Base
1019
498
521
155
169
159
175
141
220
343
209
316
148
276
276
219
248
246
265
233
137
87*
51*
568
451
1019
103
47%
124
50%
151
61%rs
131
49%
114
49%
88
64%zrs
49
56%
34
67%s
338
60%zx
228
51%
555
54%
78
32%
118
44%qt
110
47%zqt
39
28%
35
40%
16
33%
204
36%
193
43%zw
397
39%
Tell the truth
Not tell the truth
Don't know
Net difference
566
279
56%ghk 56%
lorx
287
55%
97
123
103
87
62%gh 73%zfg 65%zfg 50%
h
h
397
192
39%dei 38%
mqt
205
39%
48
31%
37
22%
48
30%
e
65
46%
236
122
69%zjk 58%k
l
85
69
111
88
48%zcd 49%zcd 50%zcd 26%
e
e
56
5%
27
5%
29
6%
10
6%
8
5%
9
5%
4
2%
7
5%
169
17%
87
18%
82
16%
49
31%
86
51%
55
35%
2
1%
-3
-2%
Proportions/Means: Columns Tested (5% risk level) - z/a/b - z/c/d/e/f/g/h - z/i/j/k/l - z/m/n/o/p - z/q/r/s/t/u/v - z/w/x
Overlap formulae used. * small base
92
42%
18
8%zf
-19
-9%
78
37%i
137
43%
70
47%
176
164
64%zop 60%o
162
51%zij
68
46%i
89
32%
99
36%
100
109
46%mn 44%m
19
5%
9
4%
18
6%
10
7%
12
4%
13
5%
16
7%
15
6%
17
7%
16
6%
9
4%
10
7%
4
4%
*
*
26
5%
30
7%
67
7%
147
43%
44
21%
-25
-8%
2
1%
87
31%
65
24%
2
1%
15
6%
72
29%
13
5%
4
2%
49
36%
14
16%
17
34%
134
24%
35
8%
158
16%
Page 7
J15063333-41-03 14-OCT - 01-NOV 2016
INTERNAL
VERACITY INDEX 2016
7 Nov 2016
Table 7
VE01 - Now I will read you a list of different types of people. For each would you tell me if you
generally trust them to tell the truth, or not? Civil Servants
Base: All adults age 15+ in Great Britain
TENURE
TOTAL
(z)
OWNED
OUTRIGHT
BY
HOUSEHOLD
(a)
BEING
BOUGHT
ON A
MORTGAGE
(b)
AREA
RENTED
FROM
LOCAL
AUTHORITY
(c)
102
RENTED
FROM A
PRIVATE
LANDLORD
(d)
MARITAL STATUS
LIFESTAGE
URBAN
(f)
SUBURBAN
(g)
RURAL
(h)
MAR/
LIVING AS
(i)
SINGLE
(j)
WID/
DIV/
SEP
(k)
SINGLE
(l)
PRE
FAMILY
(m)
EDUCATION
FAMILY
(n)
POST
FAMILY
(o)
GCSE/
O-LV/
CSE/
NVQ12
(p)
DAILY READERSHIP
A-LVL
OR
EQUIV
(q)
DEGR/
MAST/
PHD
(r)
NO
FORML
QUAL
(s)
BROAD
SHEET
(t)
MID
MARKET
(u)
TABLOID
(v)
UNWTD
TOTAL
Unweighted Base
1019
396
250
199
305
567
146
600
245
170
139
62
251
566
279
191
318
156
145
144
97
1019
Weighted Base
1019
322
319
85*
221
295
595
129
601
260
156
158
80*
291
488
259
191
274
232
118
125
87*
1019
108
68%zo
51
64%o
185
63%zo
220
45%
133
51%
114
60%s
189
69%zps
108
47%
81
68%zuv
70
56%v
33
38%
555
54%
42
26%
25
32%
86
30%
111
48%zqr
32
27%
51
40%t
47
54%zt
397
39%
Tell the truth
566
56%ckosv
165
51%
211
66%zacd
35
41%
120
54%
181
61%z
319
54%
66
51%
340
57%k
163
63%zk
Not tell the truth
397
39%bfjlnr
t
137
42%b
100
31%
39
46%b
86
39%
88
30%
248
42%f
61
47%f
231
38%
82
31%
11
13%zb
15
7%b
26
9%zgh
27
5%
3
2%
30
5%
16
6%
9
6%
8
5%
3
4%
20
7%
25
5%
12
5%
12
7%
11
4%
12
5%
6
5%
4
3%
7
9%
67
7%
-5
-5%
34
15%
93
31%
71
12%
6
4%
109
18%
81
31%
-21
-14%
66
42%
26
33%
99
34%
-24
-5%
18
7%
50
26%
114
42%
-3
-1%
49
42%
20
16%
-14
-16%
158
16%
Don't know
Net difference
56
5%b
169
17%
20
6%b
29
9%
7
2%
111
35%
Proportions/Means: Columns Tested (5% risk level) - z/a/b/c/d - z/f/g/h - z/i/j/k - z/l/m/n/o - z/p/q/r/s - z/t/u/v
Overlap formulae used. * small base
63
40%
84
54%zij
244
115
50%zlm 44%qr
n
64
34%
74
27%
Page 8
J15063333-41-03 14-OCT - 01-NOV 2016
INTERNAL
VERACITY INDEX 2016
7 Nov 2016
Table 8
VE01 - Now I will read you a list of different types of people. For each would you tell me if you
generally trust them to tell the truth, or not? Doctors
Base: All adults age 15+ in Great Britain
GENDER
TOTAL MALE FEMALE
(a)
(b)
(z)
AGE
GENERATION
15-24
(c)
25-34
(d)
35-44
(e)
45-54
(f)
55-64
(g)
65+
(h)
BABY
GEN Y GEN X BOOMERS
(i)
(j)
(k)
SOCIAL GRADE
GOVERNMENT OFFICE REGION
PRE
WAR
(l)
AB
(m)
C1
(n)
C2
(o)
DE
(p)
NORTH MIDLANDS SOUTH LONDON
(q)
(r)
(s)
(t)
WORKING STATUS
NOT
SCOTLAND WALES WORKING WORKING
(u)
(v)
(w)
(x)
UNWTD
TOTAL
Unweighted Base
1019
551
468
138
143
130
130
167
311
299
162
354
202
272
329
194
224
258
278
191
150
88
54
440
579
1019
Weighted Base
1019
498
521
155
169
159
175
141
220
343
209
316
148
276
276
219
248
246
265
233
137
87*
51*
568
451
1019
932
91%x
460
92%
471
90%
147
95%
155
92%
143
90%
164
94%
127
90%
196
89%
320
93%
189
91%
286
91%
133
90%
260
94%
252
92%
197
90%
222
90%
231
94%
236
89%
208
89%
129
94%
81
92%
47
92%
531
94%zx
401
89%
80
8%w
36
7%
44
8%
8
5%
12
7%
13
8%
10
6%
14
10%
23
10%
20
6%
17
8%
27
9%
15
10%
15
6%
20
7%
21
10%
24
9%
14
6%
21
9%
5
4%
7
8%
4
8%
32
6%
8
1%
2
*
6
1%
2
1%
3
2%
1
*
*
*
2
1%
2
1%
3
1%
3
1%
-
1
*
4
1%
1
1%
2
1%
1
1%
4
2%
3
2%
-
-
143
85%
130
82%
154
88%
113
80%
173
79%
300
87%
172
82%
259
82%
118
80%
245
89%
232
84%
176
80%
199
80%
217
88%
187
80%
124
91%
74
85%
43
84%
Tell the truth
Not tell the truth
Don't know
Net difference
852
84%
425
85%
427
82%
138
89%
Proportions/Means: Columns Tested (5% risk level) - z/a/b - z/c/d/e/f/g/h - z/i/j/k/l - z/m/n/o/p - z/q/r/s/t/u/v - z/w/x
Overlap formulae used. * small base
29
11%qt
*
*
207
78%
48
11%zw
934
92%
76
7%
5
1%
3
1%
9
1%
499
88%
353
78%
858
84%
Page 9
J15063333-41-03 14-OCT - 01-NOV 2016
INTERNAL
VERACITY INDEX 2016
7 Nov 2016
Table 9
VE01 - Now I will read you a list of different types of people. For each would you tell me if you
generally trust them to tell the truth, or not? Doctors
Base: All adults age 15+ in Great Britain
TENURE
AREA
MARITAL STATUS
OWNED
BEING
RENTED
RENTED
OUTRIGHT
BOUGHT
FROM
FROM A
MAR/
BY
ON A
LOCAL
PRIVATE
SUBLIVISITOTAL HOUSEHOLD MORTGAGE AUTHORITY LANDLORD URBAN URBAN RURAL NG AS NGLE
(a)
(b)
(c)
(d)
(f)
(g)
(h)
(i)
(j)
(z)
WID/
DIV/
SEP
(k)
SINGLE
(l)
PRE
FAMILY
(m)
FAMILY
(n)
EDUCATION
DAILY READERSHIP
GCSE/
POST O-LV/ A-LVL DEGR/
NO
FAMCSE/
OR MAST/ FORML BROAD
ILY
NVQ12 EQUIV PHD
QUAL SHEET
(o)
(p)
(q)
(r)
(s)
(t)
MID
MARKET
(u)
TABLOID
(v)
UNWTD
TOTAL
Unweighted Base
1019
396
250
199
305
567
146
600
245
170
139
62
251
566
279
191
318
156
145
144
97
1019
Weighted Base
1019
322
319
85*
221
295
595
129
601
260
156
158
80*
291
488
259
191
274
232
118
125
87*
1019
288
89%
302
95%zac
74
87%
202
92%
269
91%
544
91%
119
92%
553
92%
237
91%
139
89%
150
95%
75
95%
268
92%
437
89%
244
94%s
178
93%
260
95%zs
200
86%
111
93%v
113
90%v
69
79%
14
4%
10
11%b
16
7%
23
8%
46
8%
10
8%
42
7%
21
8%
17
11%
7
4%
4
5%
19
6%
3
1%
1
1%
3
1%
3
1%
5
1%
-
6
1%
2
1%
-
1
1%
-
288
90%
65
76%
186
84%
246
83%
498
84%
511
85%
216
83%
Tell the truth
Not tell the truth
Don't know
Net difference
932
91%osv
80
8%br
8
1%
852
84%
33
10%b
1
*
255
79%
102
LIFESTAGE
Proportions/Means: Columns Tested (5% risk level) - z/a/b/c/d - z/f/g/h - z/i/j/k - z/l/m/n/o - z/p/q/r/s - z/t/u/v
Overlap formulae used. * small base
108
84%
123
78%
143
91%
71
89%
5
2%
249
85%
49
10%z
15
6%
9
5%
12
4%
2
*
1
*
4
2%
3
1%
387
79%
230
89%
169
88%
248
90%
32
14%zpqr
7
6%
1
*
*
*
167
72%
103
87%
11
9%
17
20%ztu
934
92%
76
7%
1
1%
1
1%
9
1%
102
81%
51
59%
858
84%
Download MORI Veracity Index November 2016 - Tables
MORI Veracity Index November 2016 - Tables.pdf (PDF, 447.23 KB)
Download PDF
Share this file on social networks
Link to this page
Permanent link
Use the permanent link to the download page to share your document on Facebook, Twitter, LinkedIn, or directly with a contact by e-Mail, Messenger, Whatsapp, Line..
Short link
Use the short link to share your document on Twitter or by text message (SMS)
HTML Code
Copy the following HTML code to share your document on a Website or Blog
QR Code to this page

This file has been shared publicly by a user of PDF Archive.
Document ID: 0000522134.