Statistical Publication 2016 Q4 GDP 05 Apr 2017 (PDF)
File information
Author: U418881
This PDF 1.5 document has been generated by Microsoft® Word 2010, and has been sent on pdf-archive.com on 05/04/2017 at 21:14, from IP address 62.25.x.x.
The current document download page has been viewed 510 times.
File size: 535.81 KB (14 pages).
Privacy: public file


File preview
Scotland’s Gross Domestic Product, Quarter 4 2016
5 April 2017
1.
Main Points
In the fourth quarter of 2016 the output of the Scottish economy contracted by
0.2%, after 0.1% growth in 2016 Q3. Equivalent UK growth this quarter was 0.7%.
Scottish GDP per person contracted by 0.3% during the fourth quarter of 2016.
In the fourth quarter of 2016 output in the services industry in Scotland was flat
(0.0% change), while production contracted by 0.9% and construction contracted
by 0.8%.
Compared to the same period last year (i.e. 2016Q4 vs 2015Q4), the output of the
Scottish economy was flat (0.0% change). Equivalent UK growth was 1.9%.
Over the calendar year (i.e. 2016 vs 2015) Scottish GDP grew by 0.4%. Equivalent
UK growth was 1.8%.
2.
Understanding GDP
Change in gross domestic product (GDP) is the main indicator of economic growth in
Scotland. When external commentators describe the growth or reduction in the size of
the economy, it is the change in GDP that they are referring to.
There are three ways of calculating GDP. This publication uses the output approach
which calculates GDP as the sum of all production activity within Scotland. This is
estimated by measuring the output of each industry in Scotland and combining them
together to form an estimate for the whole economy.
All data in this bulletin have been adjusted to allow for meaningful comparisons over
time. Estimates are seasonally adjusted and have had the effect of price changes
removed. This publications presents growth for GDP in the short and medium term. Short
term change compares the most recent quarter with the previous quarter. Medium term
change compares the most recent quarter with the same time the previous year.
This publication presents results for what is commonly referred to as the “onshore
economy”, which means they exclude oil and gas extraction activity in the North Sea. UK
headline figures contain this activity.
1
Contents
1. Main Points .......................................................................................1
2. Understanding GDP ..........................................................................1
3. Background Information ....................................................................2
4. Headline GDP, UK comparison, GDP per person..............................3
5. GDP analysed by industry sector ......................................................6
6. Drivers of change ............................................................................11
7. Revisions ........................................................................................ 12
_________________________________________________
3.
Background Information
3.1 Background on this publication
The quarter 4 2016 figures cover October to December 2016.
Additional documents have been published alongside this publication:
Tables which give more detail on the figures summarised in this publication
Up to date information on the methodology behind this publication is
A new Frequently Asked Questions document
These additional documents are available here:
http://www.gov.scot/Topics/Statistics/Browse/Economy/PubGDP/GDP2016Q4/DOCS
We thank users for their response to the Scottish Quarterly GDP user survey in March.
A follow-up will be published with next quarters’ figures covering Quarter 1 (January to
March) 2017, which is due on 5th July 2017.
For further information on Scotland’s Gross Domestic Product publication please
contact Carrie Graham (gdp_stats@scotland.gov.scot).
3.2 Related publications
The data published here represents relative change of the economy. For monetary
value and more information on the relative size of each industry, please refer to the
Quarterly National Accounts publication (Q4 2016 figures will be published 10th May 2017
at http://www.gov.scot/Topics/Statistics/Browse/Economy/SNAP/QNAS).
For information on the relative size of industries within the economy please refer to the
Scottish Supply and Use Tables (most recent figures published July 2016
http://www.gov.scot/input-output).
2
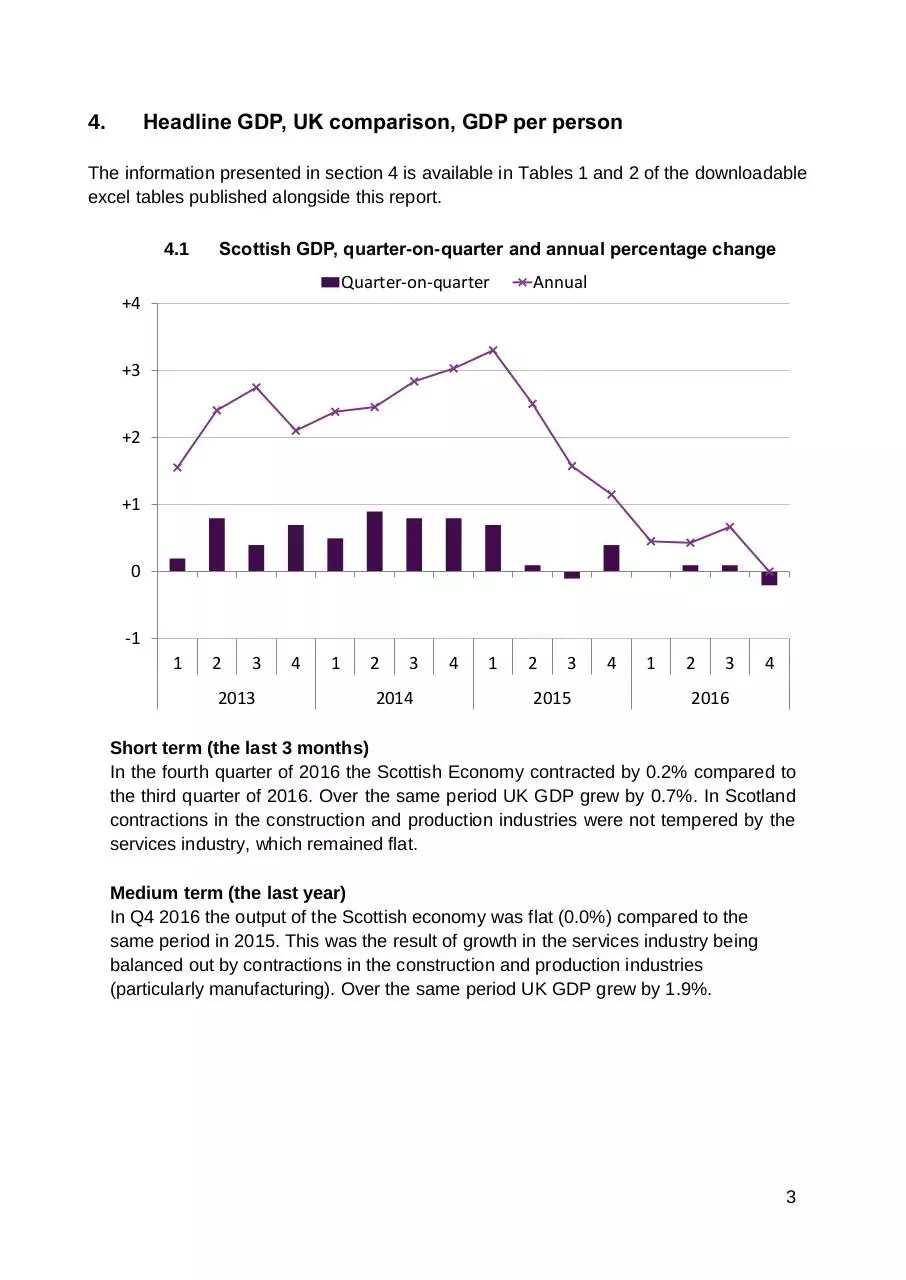
Headline GDP, UK comparison, GDP per person
4.
The information presented in section 4 is available in Tables 1 and 2 of the downloadable
excel tables published alongside this report.
4.1
Scottish GDP, quarter-on-quarter and annual percentage change
Quarter-on-quarter
Annual
+4
+3
+2
+1
0
-1
1
2
3
2013
4
1
2
3
2014
4
1
2
3
2015
4
1
2
3
4
2016
Short term (the last 3 months)
In the fourth quarter of 2016 the Scottish Economy contracted by 0.2% compared to
the third quarter of 2016. Over the same period UK GDP grew by 0.7%. In Scotland
contractions in the construction and production industries were not tempered by the
services industry, which remained flat.
Medium term (the last year)
In Q4 2016 the output of the Scottish economy was flat (0.0%) compared to the
same period in 2015. This was the result of growth in the services industry being
balanced out by contractions in the construction and production industries
(particularly manufacturing). Over the same period UK GDP grew by 1.9%.
3
4.2
UK comparison, quarterly growth in GDP
Scotland
UK
110
108
106
104
102
100
98
96
Q1
Q2
Q3
2014
Q4
Q1
Q2
Q3
2015
Q4
Q1
Q2
Q3
Q4
2016
Indexed from 2013 = 100
When considering short-term change over time, the UK and Scotland saw similar
levels of growth in 2013 and 2014. The UK has seen stronger growth than Scotland
in 2015 and 2016.
Average annual change
An alternative measure of change compares the average of the most recent four
quarters with the average of the four previous quarters. This figure is less affected by
short-term fluctuations, but the trade-off of this is that it is a less sensitive measure of
short term change. Between the four quarters ending in Q4 2015 and the four
quarters ending in Q4 2016 Scottish GDP grew by 0.4%. Over the same period, UK
GDP grew by 1.8%.
This figure relates to the borrowing powers in the Scottish Government’s Fiscal
Framework. From 1 April 2017, additional borrowing powers may be triggered for the
Scottish Government under certain conditions when onshore Scottish GDP growth is
less than 1% in absolute terms in rolling 4 quarters occurring after commencement,
and 1 percentage point below UK GDP growth over the same period.
4
4.3
Scottish GDP and GDP per person comparison
GDP
GDP per person
108
104
100
96
92
1
2
3
2013
4
1
2
3
2014
4
1
2
3
2015
4
1
2
3
4
2016
Indexed from 2013 = 100
Population growth helps drive GDP growth, meaning that some growth in GDP can
be the result of an increase in population, rather than an increase in productivity.
GDP per person shows economic growth after taking population changes into
account.
In the short term (Q4 2016 compared to Q3 2016) Scottish GDP per person
decreased by 0.3%, while in the medium term (Q4 2016 compared to Q4 2015)
Scottish GDP per person decreased by 0.2%.
GDP per person is calculated by dividing GDP in chained volume measures by the
number of people in Scotland each year (indexing to 2013=100).
5
GDP analysed by industry sector
5.
The information presented in section 5 is available in Tables 1, 3 and 4 of the
downloadable excel tables published alongside this report.
5.1
150
Scotland GDP output components growth, quarter-on-quarter
Services
Production
Construction
Agriculture, Forestry and Fishing
140
130
120
110
100
90
80
1
2
3
2013
4
1
2
3
2014
4
1
2
3
2015
4
1
2
3
4
2016
Indexed from 2013 = 100
Scotland’s economy is broken down into four weighted industry categories. Services
(75%), Production (18%), Construction (6%), and Agriculture, Forestry and Fishing
(1%).
6
Services
5.2
Scotland services growth, quarter-on-quarter (percentage change)
+10
+8
+6
+4
+2
0
-2
-4
1
2
3
2013
4
1
2
3
2014
4
1
2
3
2015
4
1
2
3
4
2016
The services industry accounted for 75 per cent of the Scottish Economy in 2013
and includes industries such as shops, real estate, financial services and the public
sector.
Between Quarter 3 and Quarter 4 2016, the output of the Services industry remained
flat (0.0%). Services increased by 1.6% between Quarter 4 2015 and Quarter 4
2016.
7
Production
5.3
Scotland production growth, quarter-on-quarter (percentage change)
+10
+8
+6
+4
+2
0
-2
-4
1
2
3
2013
4
1
2
3
2014
4
1
2
3
2015
4
1
2
3
4
2016
The production industry accounted for 18 per cent of the Scottish Economy in 2013
and includes industries such as manufacturing, energy and mining.
Between Quarter 3 and Quarter 4 2016, Production in volume terms contracted by
0.9%. Production contracted by 4.6% between Quarter 4 2015 and Quarter 4 2016.
8
Construction
5.4
Scotland construction growth, quarter-on-quarter (percentage change)
+10
+8
+6
+4
+2
0
-2
-4
1
2
3
2013
4
1
2
3
2014
4
1
2
3
2015
4
1
2
3
4
2016
The construction industry accounted for 6 per cent of the Scottish Economy in 2013.
The construction industry saw extremely strong growth during 2014 and early 2015,
which tailed off at the end of 2015. In 2016 the construction sector has contracted.
Between Quarter 3 and Quarter 4 2016, Construction in volume terms contracted by
0.8%. Construction contracted by 6.0% between Quarter 4 2015 and Quarter 4 2016.
9
Download Statistical Publication 2016 Q4 GDP - 05 Apr 2017
Statistical Publication 2016 Q4 GDP - 05 Apr 2017.pdf (PDF, 535.81 KB)
Download PDF
Share this file on social networks
Link to this page
Permanent link
Use the permanent link to the download page to share your document on Facebook, Twitter, LinkedIn, or directly with a contact by e-Mail, Messenger, Whatsapp, Line..
Short link
Use the short link to share your document on Twitter or by text message (SMS)
HTML Code
Copy the following HTML code to share your document on a Website or Blog
QR Code to this page

This file has been shared publicly by a user of PDF Archive.
Document ID: 0000578774.