LAAAABARGH (PDF)
File information
Author: Brent Mertz
This PDF 1.5 document has been generated by Microsoft® Word 2016, and has been sent on pdf-archive.com on 08/04/2017 at 06:01, from IP address 130.132.x.x.
The current document download page has been viewed 583 times.
File size: 331.86 KB (8 pages).
Privacy: public file


File preview
Abstract
The focus of this module is to create loaded nanoparticles and microparticles and to analyze
their characteristics for use in later modules. Nanoparticles encapsulating Iron & Thulium,
Thulium, and DiI and microparticles containing DiI were created using single oil-in-water
emulsion and double water-in-oil-in-water emulsion. Their characteristics, namely their yield,
size distribution, charge, loading efficiency, spectral properties, and release profiles were
analyzed. The yield rate of the microparticles (96.25%) was noticeably larger than that of the
nanoparticles (71.75% - 87.38%), likely due to their larger size allowing them to be removed
from the supernatant more easily. The size distribution of the nanoparticles were all unimodal
peaks, with the Iron & Thilium and Thilium nanoparticles being of a roughly similar size with an
average radius of 247nm for the iron particles and 230nm for the Thulium only particles. The DiI
nanoparticles on average were larger, with an average radius of 350nm and having a larger
distribution. The loading efficiency of the DiI particles was calculated to be roughly 56%, which
is good but could be improved. The release profiles of the DiI particles were analyzed and
nothing very conclusive was found - the profile did not seem to have much of a trend. This
makes sense, though ,as if there was a noticeable change within only 90 minutes, then these
particles would be leaking their encapsulated DiI too quickly. In this lab, we successfully
created loaded nanoparticles and microparticles and demonstrated these characteristics
through several forms of analysis.
Introduction
Significance
The significance of PLGA nanoparticles and microparticles is that they can be used to
effectively deliver various molecules to targeted areas of the human body over a long period of
time. The slow release aspect of nanoparticles can potentially allow for a single treatment to
last several months, reducing the need for numerous expensive procedures. This has many
applications not in the fields of drug delivery, but also bioimaging as well. Normally, a significant
amount of drug does not make it to the target area to be treated, and is either in some unrelated
part of the body or has been eliminated by the immune system. Using a nanoparticle delivery
system is a method that aims to avoid some of these issues – the difficulty of cell uptake of
various molecules and evading the immune response that reduces the effectiveness of the
treatment. The former portion is particularly important with respect to bioimaging, as many
biochemical markers are difficult to get into cells. However, using nanoparticle delivery
systems, cell uptake can be significantly increased, resulting in a larger response
signal. Currently there are many forms of drug-loaded nanoparticles in development for
treatment of various diseases such as cancer. Using nanoparticles for delivery has had great
potential for use in many different areas of biology and medicine since, and we are currently in
the process putting this long-lived potential into practical form.
Objectives
The objectives of this lab are to create a biodegradable polymer system using poly
(lactic-co-glycolic) acid (PLGA) that can encase various molecules. More specifically, this lab’s
objective is to create three sets of nanoparticles encasing DiI, Thulium, or both Thulium & Iron
and one set of microparticles encasing Thulium. These particles will then be analyzed and
characterized in order to investigate the yield, size distribution, charge, loading efficiency,
spectral properties, and release profiles (for the DiI nanoparticles)
Brief Overview of Methodology
This lab’s objectives will be performed by doing the following steps:
-Dissolving PLGA in an organic solvent (in this case, chloroform and PVA), adding a material to
encapsulate, and performing either a single oil-in-water emulsion or a double water-in-oil-inwater emulsion.
-All of the particles are vigorously vortexed and then, with the exception of one sample, the
thulium nanoparticles, are sonicated in order to insert energy into the system and break up the
larger particles into nanoparticle-sized pieces.
-The particles are frozen, marking the end of part 1 of the lab.
-In part 2 of the lab, these samples are thawed, then analyzed in order to investigate their
characteristics.
-Yield is measured using a scale to find the total mass of the resulting particles.
-Size and zeta potential are found by analyzing particle samples using the Malvern DLS
machine
-The loading efficiency and spectral properties of the DiI nanoparticles were investigated by
preparing various concentrations of DiI nanoparticles and performing serial dilutions on a 96
well plate, and analyzed using the plate reader to measure absorbance to create plots that can
be used to investigate the loading efficiency of DiI. -A 90 minute release profile was also
performed, and 10x 1mL solution of 1 mg/mL DiI nanoparticles were prepared, and 1 of these
samples was taken every ten minutes to be spun down in a centrifuge to remove the
supernatant. The nanoparticles were then resuspended to their original volume and then
injected into a 96 well plate and analyzed through their absorbances to measure the rate at
which the encapsulated material was released into the supernatant over the course of 90
minutes.
Background
Historical overview
The idea of using nanoparticles as a drug delivery system has been around for a long
time, with its roots in the 60’s and 70’s with the role of sustained release over a long period of
time in mind. Initial uses of this delivery system were for vaccines, as a sustained release of a
vaccine could help acclimate the body’s immune system with only one injection or
treatment. This particular direction never really got off the ground however, due to
complications in the design process. Numerous different polymers were investigated, such as
polyacrylamide, poly(lactic acid), and eventually poly(lactic-co-glycolic acid), which is one of the
flagship polymers used in nanoparticle design today (Kreuter, 2007).
Initial designs of nanoparticles as drug delivery systems focused on maintaining a controlled
release over time in order to maintain a similar level of concentration of the drug, though
eventually it was determined that this was not necessary or in many cases desirable. It’s only
strictly necessary to have the drug above the minimum effective concentration and below the
point where its toxicity becomes an issue. Current approaches to nanoparticles focus on
specific delivery systems, targeting via changes in pH or other environmental factors, and we
are currently moving into moving into the next practical stage of applying nanoparticles - longterm and targeted delivery systems for cancer and other related disease. (Park, 2014)
Current application
Nanoparticle delivery systems can be used to protect and deliver various molecules to
targeted areas in the human body. This has many applications not only in the fields of drug
delivery, but bioimaging as well. Typically, a significant amount of drug does not make it to a
target area, reducing the drug’s effectiveness. It is often, for instance, taken up by the
liver. Using a nanoparticle delivery system, it’s possible to help disguise particles to help evade
the immune response and also direct them towards target areas (Mirakabad, et. al, 2017). In
this experiment, we will be creating nanoparticles using PLGA, or Poly (lactic-co-glycolic acid),
which is one of the best FDA-approved polymers currently available to use. This is because of
its numerous characteristics that make it very suitable for use in nanoparticles – including its
slow-release properties, low toxicity, biocompatibility, and relatively small size, allowing for
passage past the blood-brain barrier.
Limitations with present approach
Nanoparticle delivery systems are promising but there have been several challenges in
using PLGA for the delivery of treatment agents. For instance, when dealing with peptides, the
protein is likely to be unstable when encased in PLGA, as the hydrophilic and acidic
environment of the nanoparticle can induce changes in the protein. Additionally, PLGA
nanoparticles have demonstrated ‘burst release’, wherein a large amount of the encapsulated
protein is released initially and significantly less is released over time in the long period of time
after the initial release (Samani, & Taghipour, 2014). Furthermore, despite one of the uses of
nanoparticles being to evade the immune system, a very large percentage of nanoparticles end
up sequestered in the liver, especially those of which are larger than 100nm in size (Zhang, et.
al, 2016). While PLGA is a very good polymer, it does have its flaws which need to be worked
around in order to make PLGA-based drug delivery nanoparticles useful. The current difficulties
in maintaining a steady release of stable product while also evading the immune system are
large hurdles that need to be overcome in order to make it practical.
Methodology
Overall, the aim of our efforts during this lab were to isolate and characterize a number
of very small particles in a range of sizes, from micro to nano, loaded with an array of common
encapsulants that have common biomedical relevance in tracing and imaging. To this end, we
employed both single and double oil-in-water emulsion techniques for the encapsulation, and
used poly(lactic-co-glycolic acid) (PLGA) polymer because it is biocompatible and readily
biodegradable, and widely used for nano- and microparticle encapsulant delivery.
Part 1: Preparation of PLGA Nano- / Microparticles for Use in Subsequent Modules
In order to encapsulate, we firstly had to prepare the PLGA that would make up the
particles, and then get it to encase the materials we wanted to load into our four combinations of
encapsulant and particle size: nanoparticles with the organic dye DiI, thulium nanoparticles,
thulium microparticles, and thulium/iron combination nanoparticles. To start, we dissolved four
test tubes of PLGA in chloroform for 30 minutes with intermittent sonication to make our polymer
solutions.
Then, for the encapsulant solutions, we separately prepared three beakers containing
3.75% solutions of polyvinyl alcohol (PVA), along with an additional beaker of the PVA plus
avidin palmitate for the DiI particles. After all the test tubes were thoroughly stirred for total
dissolution of polymer, we made primary and secondary emulsions for each encapsulant:
DiI: We added 400 uL of a miscible DiI solution to one of the test tubes for a
spontaneous single emulsion. We then proceeded to the oil-in-water emulsion for DiI, and
added the solution of polymer and DiI into the beaker of 3.75% PVA with a pipette, and then
sonicated in pulses. This emulsion was then added to a stirring 0.25% PVA solution.
All others: We added 200 uL of each encapsulant solution to the beakers with dissolved
PLGA polymer during continuous vortexing in order to achieve the primary water-in-oil emulsion.
Then we proceeded to the secondary emulsion by adding the result to the 3.75% PVA beakers,
sonicating, and adding to 0.25% PVA. The thulium microparticle emulsion, as a note, was
vortexed only and not sonicated.
Stirring went on for approximately 3 hours, and then the particles were isolated and
washed.
Part 2 : PLGA Nano- / Microparticle Characterization
The next step entailed characterizing the size and yield of our particles after they had
been purified, isolated, and prepared to ensure all water had been removed.
Firstly, to determine particle yield, we measured the mass of the samples in their tubes,
subtracted the original mass of those tubes, and used the starting mass of PLGA to calculate
how much mass from the original samples we had retained.
Next, we put the particles in solution at .5mg / mL, put 1 mL of each of the four solutions
in a cuvette, and ran them through a dynamic light scattering machine to determine their overall
size profile, based on how the individual particles affected the beam and the time scale of their
movement over small distances that could be reconstructed from the interference of the
scattered light with surrounding particles. All this data was recorded and plotted.
For the DiI nanoparticles, several special protocols were followed to determine loading
efficiency and to model a 90-minute release profile. The methodology behind determining
loading efficiency was to assess the amount of DiI that was successfully uptaken into the
particles, and the investigation was accomplished by comparing UV absorbance for
concentration curves for the DiI nanoparticles and for free DiI as a control to represent 100%
loading efficiency. First, we prepared a 10mg / mL solution of the nanoparticles and dissolved it
totally in dimethyl sulfoxide (DMSO), then pipetted 300 uL of that solution in triplicate down the
first column of a 96-well plate. We serially diluted down each row with DMSO, leaving 150 uL in
each, with an additional well of just DMSO for comparison. We ran the pate through a reader
that gauged the UV absorbance of each well so that we could compare concentration versus
absorbance, and used the data to plot and compare our sample with the model of 100% DiI
uptake.
For the 90-minute release profile, which models the practical applications of how these
particles would release drug in the body, we started with 10 Eppendorf tubes each of 1 mg / mL
solutions of our DiI nanoparticles. These samples were spun at max in centrifuge for 5 minutes,
at ten minute intervals, until the supernatant was collected and plated in 150 uL in triplicate on a
96-well plate. The pellet was incubated for 90 minutes, and then resuspended in mL of water
and added by 300 uL in triplicate to the plate. The absorbance was recorded at 549 nm (the
wavelength of DiI), and profiles were generated to gauge how DiI was released from the
nanoparticles over time.
Response to Questions
1. Polyvinyl alcohol is a polymer with a hydrocarbon backbone and hydroxyl functional groups. It
functions as a stabilizer because the hydrophobic backbone is attracted to the hydrophobic
PLGA, and the hydrophilic hydroxyl groups to the water in the solution. The amphiphilic nature
of PVA makes it a good stabilizer because it wraps around the nanoparticles and prevents
phase separation.
2. Our encapsulation efficiency was 56%. This was relatively high in comparison to, the known
encapsulation efficiency of various drugs that were mentioned in class, which was around
30%, We would want to increase the encapsulation efficiency as that would mean that more
drug is getting into the particle and less is being wasted. This is for two reasons - the obvious
one being that the drug is expensive, and the other being that there’s only so many
nanoparticles you can give a person, so the more drug you can encase in the same amount of
nanoparticles, the better.
3. A) Our DiI nanoparticles contained 0.56 weight percent of DiI, so there are 5.6 ug of DiI in
each milligram of particles.
B) We initially offered 400 uL of 2 mg/mL DiI, or 0.8 mg, and our total encapsulated DiI was 0.36
mg, which gives a ratio of 0.45.
4. I would not expect similar results with other drugs unless they had similar characteristics. DiI
is very hydrophobic and easy to encapsulate. This isn’t an assumption that can necessarily be
applied to other drugs, which may be less suited towards encapsulation. Furthermore, DiI is a
relatively small molecule, with a molar mass of 933.89 g·mol−1 , so it would be much easier to
encapsulate compared to a protein which is much, much larger.
5. In terms of drug release, the observed release profile appears to be adequate. We did not
observe a significant release over a 90 minute time frame, which is very reasonable as if a
noticeable amount released over the course of 90 minutes, the drug will likely have released too
quickly. Our observation that there was not significant release over a short time span does
however imply that the drug releases more slowly, likely on a scale of days or weeks. A release
at this rate would be good as a constant release of drug makes it more likely that the drug’s
bioavailability over the course of a long period of time is consistent.
6. Internalized particles may be digested by the cell and so would release their contents at the
rate of destruction by the cell, which is likely faster than in circulation in the blood. Particles that
are on the surface of cells would instead release their payload more slowly over a long period of
time as opposed to a burst release that would occur with internalized particles.
Results, Expected Outcomes, and Potential Solutions
Particle yield
Table 1: Particle masses and yields
Fe NPs
Tm MPs Tm NPs Di-I NPs
Total mass (g)
13.7522 14.0211 13.8470 13.8593
Mass of tube (g)
13.6823 13.9441 13.7896 13.7944
Mass yield (g)
Yield percentage
0.0699
0.0770
0.0574
0.0649
87.38
96.25
71.75
81.12
The particle yields acquired ranged from 72% for Tm nanoparticles to 96% for Tm
microparticles. We expected the yield for the microparticles to be the highest, because a major
source of loss occurs in the washing steps, when the particles solution is centrifuged and the
supernatant removed, several times. There will always be some loss in this process, as the
smallest particles remain in the supernatant. Because the average size of microparticles is
larger than that of nanoparticles, a larger mass goes into the pellet, and so the loss due to
washing is reduced.
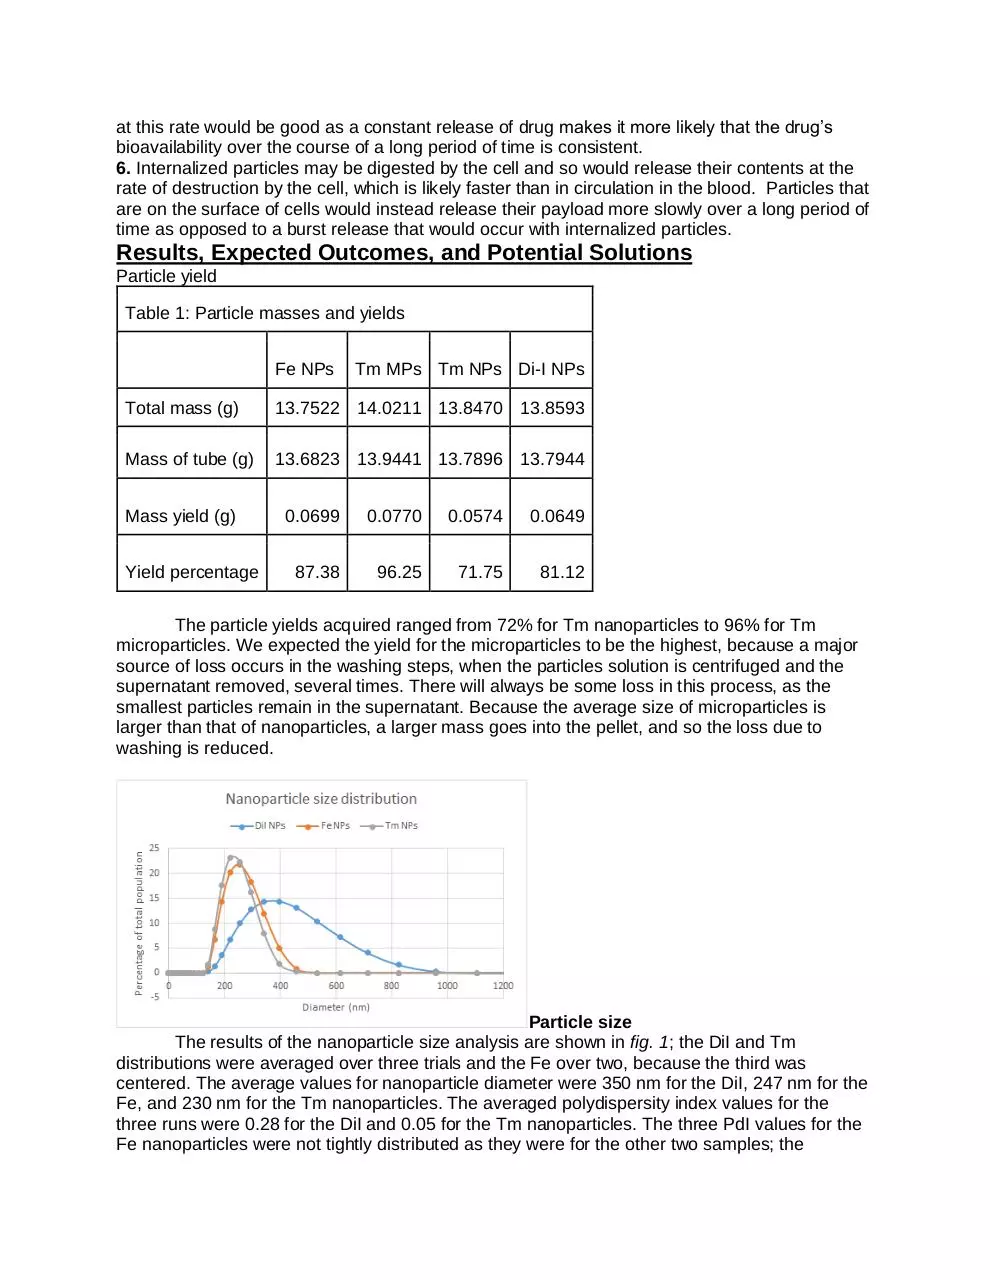
Particle size
The results of the nanoparticle size analysis are shown in fig. 1; the DiI and Tm
distributions were averaged over three trials and the Fe over two, because the third was
centered. The average values for nanoparticle diameter were 350 nm for the DiI, 247 nm for the
Fe, and 230 nm for the Tm nanoparticles. The averaged polydispersity index values for the
three runs were 0.28 for the DiI and 0.05 for the Tm nanoparticles. The three PdI values for the
Fe nanoparticles were not tightly distributed as they were for the other two samples; the
average was 0.16, but examining the graphs indicates that the size spread of Fe was similarly
narrow to that of the Tm nanoparticles, and the DiI spread was much wider.
Figure 1: Size distribution of DiI, Fe, and Tm nanoparticles. The DiI nanoparticles showed
both a larger average size and a wider spread. The average size and narrowness of the Fe
and Tm particles were similar.
Figure 2: Hemocytometer-acquired size distribution of Tm microparticles.
The microparticles were too large for the same setup to be used on them, and so instead
this data from a cell counter was obtained (see fig. 2). The average size of a Tm microparticle
was 4.44 μm, or 4440 nm. This is the weighted average of the “dead” and “live cell” averages,
because 98% of the microparticles were characterized as “dead” and only 2% as “live.” The
spread of the sizes is shown in this histogram. There is a long tail extending to larger sizes. This
large range may be because the secondary emulsion was not sonicated to break down as the
others were, and so whichever particle size formed initially remained.
Loading efficiency of DiI
[NP] (mg/mL) Abs equivalent [DiI] (μg/mL) Loading in wt %: [DiI]/(1000*[NP])
10 2.302 50.016 0.500
5 1.302 28.082 0.562
2.5 0.707 15.031 0.601
1.25 0.368 7.588 0.607
0.625 0.185 3.591 0.575
0.3125 0.100 1.726 0.552
We generated two standard curves of absorbance at 549 nm, one of free DiI in DMSO
from 100 ug/mL to 0.05 ug/mL and one of our DiI-containing nanoparticles dissolved in DMSO
from 10 mg/mL to 5 ug/mL. By fitting a linear regression to the linear region of the free DiI curve,
we obtained an equation relating the absorbance value to the DiI concentration, Abs =
0.0456[DiI] + 0.0217. From this, we were able to find an equivalent free DiI concentration for the
absorbance at each of the nanoparticle concentrations. Converting into mg/mL and dividing by
the nanoparticle concentrations gave an average weight percent of 0.56. Because we began
with 1 wt% DiI (400 μL of 2 mg/mL DiI solution for 80 mg PLGA), our loading efficiency was
56%. This is a relatively high number, and results from the hydrophobic nature of the DiI dye,
which means that DiI remains mostly in the PLGA when the water in oil in water emulsion is
created.
Cuvette samples
From Beer’s law, Abs = Elc, we were able to calculate the extinction coefficient for DiI of
0.105 mL μg-1 cm-1. Using the data from another group, which was slightly different, we
calculated that a 0.83 mg/mL concentration of nanoparticles would give rise to an absorbance of
0.5. The absorbance spectra of 0.83 mg/mL nanoparticles in DMSO and PBS are plotted in fig.
5. While the baseline in the DMSO sample was flat and close to zero, that in the PBS sample
was elevated and had a negative slope. This is due to the turbidity of the nanoparticles. Plotting
both spectra on the same graph shows the alignment of the peaks in both spectra. If the
nanoparticle turbidity contribution were subtracted away, the two spectra would appear very
similar.
The fluorescence intensity of the encapsulated dye, the sample in PBS, was much
higher than that of the free dye, in DMSO, even though they had the equivalent free DiI
concentrations. The peak of the DMSO spectrum is also shifted to the right of the expected
peak at 549 nm. Nanoencapsulation thus greatly affects the spectral properties of dye
encapsulates and leads to much higher intensity.
Release profile
We developed this release profile of DiI over time. Because each sample should have had the
same fixed total amount of DiI, we would expect that the total absorbance at each time point
should be constant. Any loss in absorbance in the supernatant should be reflected as a gain in
absorbance of the pellet, and vice versa. We would actually expect there to be no gains or
losses over this short time scale. While the absorbance of the supernatant stayed relatively
constant in time, as seen from the slope of -0.0002 for the linear regression trendline, the
absorbance of the resuspended pellet did change in time. However, we observed that the
resuspension process was uneven across the samples. In most, some visible clumps of
nanoparticles remained after sonication and vigorous pipetting. The dye contained in the
nanoparticles in these clumps did not contribute to the absorbance reading. This is likely the
cause of the fluctuations in the absorbance of the pellet. Better resuspension of the pellet would
give more uniform results.
Conclusions
This module covered the basics of fabricating and characterizing PLGA nano- and
microparticles. Based on our results, the protocols we followed for oil in water or water in oil in
water emulsions are effective ways to formulate PLGA nanoparticles on the 250-350 nm
diameter range, and PLGA microparticles in the 4 μm diameter range, with high yields greater
than 70%. We achieved a 56% loading efficiency of DiI dye.
The loading efficiency of DiI could be improved, because DiI is a hydrophobic dye molecule and
thus is more soluble in the PLGA than the aqueous solution present in the water in oil in water
emulsion to form those nanoparticles. Improving the loading efficiency of DiI could also inform
improving the loading efficiency for less hydrophobic molecules, which tend to be much lower
and thus much more wasteful. It would also be interesting to consider ways of collecting and
isolating the unencapsulated drug or protein from the solution after particle formation, because,
if a cost-effective protocol could be developed, it could be possible to encapsulate substances
that are currently prohibitively costly. Optimizing aspects of the protocol to minimize ultimate
nanoparticle size would be a worthwhile effort, as smaller nanoparticles are less likely to be
sequestered in the liver and thus can be more effective at targeting other tissues. For example,
it would have been interesting to conduct an experiment to determine the full extent of the effect
of sonication on the ultimate size of the particle. We could devise an experiment allowing for
several levels of sonication, ranging from none up to ten ten-second pulses, and characterize
the ultimate size and yield of the particles. It is possible that excessive sonication would result in
fragmentation of the particles, which would likely lead to decreased yields as these fragments
are lost in the washing step. However, there would likely be an optimal amount of sonication
that would lead to smaller, effective nanoparticles.
Because nanoparticles are typically injected and distributed throughout the body via the
bloodstream, it would have been interesting to run the produced particles through a simplified
flow model. A set of tubes on the scale of the vasculature connected to a pump to mimic the
heart could be perfused with fluid, then the particles injected and followed throughout in order to
determine the flow characteristics. It would be interesting to compare delivery of sets of particles
with different width size ranges, as this may affect drug delivery when particles are loaded.
Another factor affecting drug delivery would be the mechanical characteristics of the particles.
These could also be characterized.
References
Kreuter, J. (2007). Nanoparticles—a historical perspective. International Journal Of
Pharmaceutics, 331(1), 1-10. http://dx.doi.org/10.1016/j.ijpharm.2006.10.021
Mohammadi-Samani, S., & Taghipour, B. (2014). PLGA micro and nanoparticles in delivery of
peptides and proteins; problems and approaches. Pharmaceutical Development And
Technology, 20(4), 385-393. http://dx.doi.org/10.3109/10837450.2014.882940
Park, K. (2014). Controlled drug delivery systems: Past forward and future back. Journal Of
Controlled Release, 190, 3-8. http://dx.doi.org/10.1016/j.jconrel.2014.03.054
Tabatabaei Mirakabad, F., Nejati-Koshki, K., Akbarzadeh, A., Yamchi, M., Milani, M., &
Zarghami, N. et al. (2017). PLGA-Based Nanoparticles as Cancer Drug Delivery Systems.
Retrieved 8 April 2017, from
Zhang, Y., Poon, W., Tavares, A., McGilvray, I., & Chan, W. (2016). Nanoparticle–liver
interactions: Cellular uptake and hepatobiliary elimination. Journal Of Controlled Release,
240, 332-348. http://dx.doi.org/10.1016/j.jconrel.2016.01.020
Download LAAAABARGH
LAAAABARGH.pdf (PDF, 331.86 KB)
Download PDF
Share this file on social networks
Link to this page
Permanent link
Use the permanent link to the download page to share your document on Facebook, Twitter, LinkedIn, or directly with a contact by e-Mail, Messenger, Whatsapp, Line..
Short link
Use the short link to share your document on Twitter or by text message (SMS)
HTML Code
Copy the following HTML code to share your document on a Website or Blog
QR Code to this page

This file has been shared publicly by a user of PDF Archive.
Document ID: 0000579903.