Plantower PMS 7003 sensor data sheet (PDF)
File information
Title: Digital Universal Particle Concentration Sensors.pdf
This PDF 1.3 document has been generated by Preview / Mac OS X 10.11.6 Quartz PDFContext, and has been sent on pdf-archive.com on 12/04/2017 at 14:38, from IP address 89.20.x.x.
The current document download page has been viewed 17871 times.
File size: 2.09 MB (17 pages).
Privacy: public file


File preview
Page 1
Beijing Kondo Technology Co., Ltd. 2016 Product Data Handbook
DSENSOR
Digital Universal Particle Concentration Sensors
PMS7003 data sheet
prepared by
Zhou yong
version
V2.2
Review
Zheng Haoxin
Release date
2016-04-07
Key Features
◆ laser scattering principle to achieve accurate measurement
◆ zero error alarm rate
◆ real-time response and support continuous acquisition
◆ minimum resolution particle size 0.3μ m
◆ new patent structure, six full range of shielding, anti-jamming performance stronger
◆ The direction of the inlet and outlet can be selected, the scope of application is wide and the user does not need to design the air duct again
◆ ultra-thin design, only 12 mm, suitable for portable devices
Overview
PMS7003 is a digital versatile particle concentration sensor based on the principle of laser scattering, continuous mining
And calculate the number of suspended particles in different sizes of air in the unit volume, that is, the concentration distribution of particles,
And converted into mass concentration, and in the form of general digital interface output. The sensor can be embedded in a variety of air
Suspended particle concentration in the instrument or environmental improvement equipment, to provide timely and accurate concentration
according to.
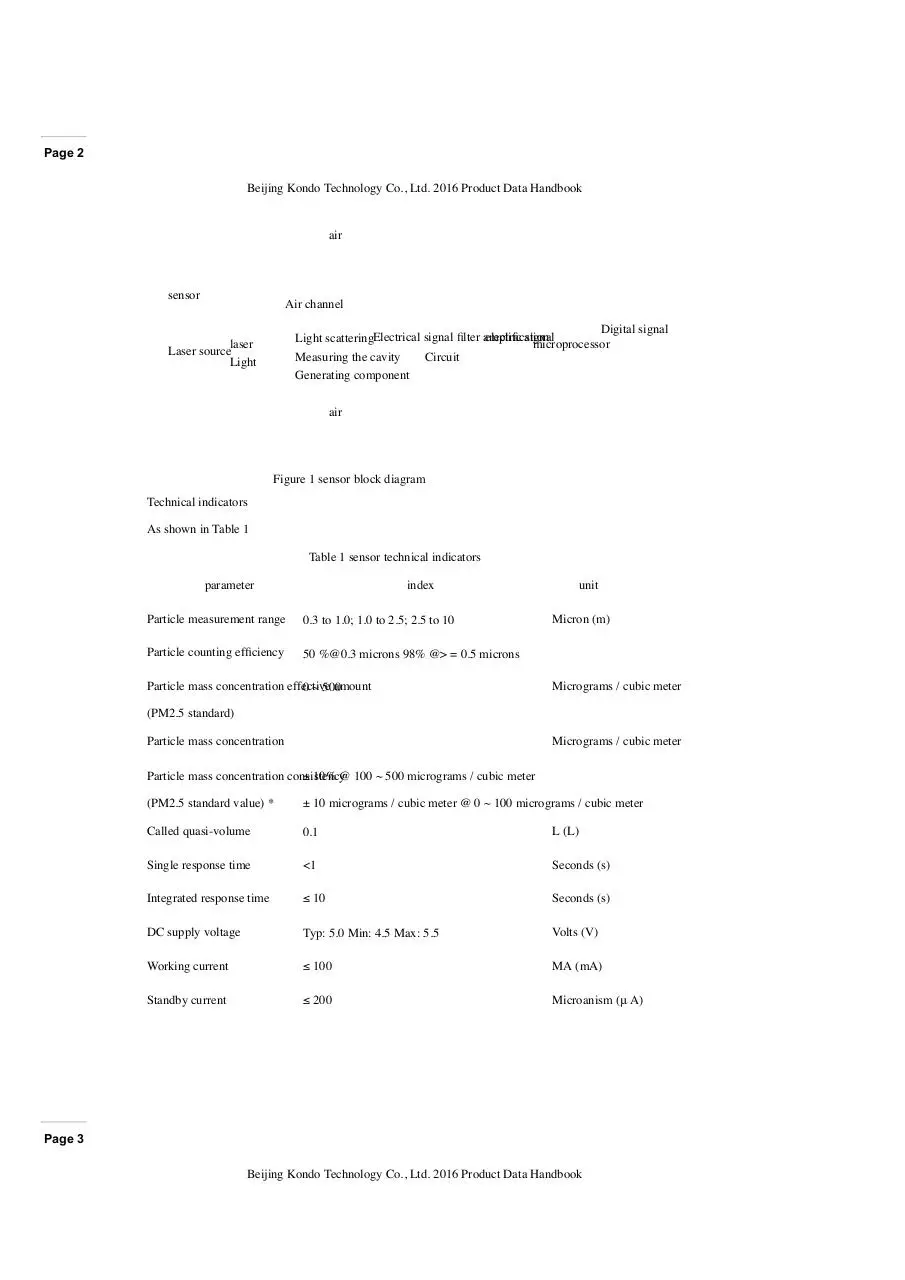
working principle
The sensor uses the principle of laser scattering. Even if the laser irradiation in the air on the suspended particles to produce scattering,
At the same time, the scattered light is collected at a certain angle to obtain the curve of the scattered light intensity with time.
And then microprocessing
Using the algorithm based on Mie (MIE) theory, the equivalent particle size and the volume per unit volume
Particle size of the number of particles. The functional block diagram of the sensor is shown in Fig
Page 2
Beijing Kondo Technology Co., Ltd. 2016 Product Data Handbook
air
sensor
Air channel
Digital signal
electric signal
Light scatteringElectrical signal filter amplification
microprocessor
laser
Laser source
Light
Measuring the cavity
Generating component
Circuit
air
Figure 1 sensor block diagram
Technical indicators
As shown in Table 1
Table 1 sensor technical indicators
parameter
index
Particle measurement range
0.3 to 1.0; 1.0 to 2.5; 2.5 to 10
Particle counting efficiency
50 %@0.3 microns 98% @> = 0.5 microns
Particle mass concentration effective
amount
0 ~ 500
unit
Micron (m)
Micrograms / cubic meter
(PM2.5 standard)
Particle mass concentration
Micrograms / cubic meter
Particle mass concentration consistency
± 10% @ 100 ~ 500 micrograms / cubic meter
(PM2.5 standard value) *
± 10 micrograms / cubic meter @ 0 ~ 100 micrograms / cubic meter
Called quasi-volume
0.1
L (L)
Single response time
<1
Seconds (s)
Integrated response time
≤ 10
Seconds (s)
DC supply voltage
Typ: 5.0 Min: 4.5 Max: 5.5
Volts (V)
Working current
≤ 100
MA (mA)
Standby current
≤ 200
Microanism (μ A)
Page 3
Beijing Kondo Technology Co., Ltd. 2016 Product Data Handbook
Data interface level
L <0.8 @ 3.3 H> 2.7@3.3
Volts (V)
Operating temperature range
-10 ~ + 60
Celsius (° C)
Operating humidity range
0 ~ 99%
Storage temperature range
-40 ~ + 80
Celsius (° C)
Mean time between failures
≥3
Year (Y)
biggest size
48 × 37 × 12
Mm (mm)
Note: The basic data for obtaining the consistency of the particle concentration is the data of the communication protocol 2 (see Appendix A)
Environmental conditions of 20 ℃, humidity 50%
Output the result
The main output is the mass per unit volume of particles and the number of particles, of which the number of particles per unit volume
For 0.1 liters, the mass concentration unit is: micrograms / cubic meter.
The output is divided into active and passive outputs. After the sensor is powered on, the default state is active output
The sensor sends the serial data to the host, the time interval is 200 ~ 800ms, the air concentration of particles
High, the shorter the time interval. Active output is divided into two modes: smooth mode and fast mode. in the air
Particle concentration changes less, the sensor output for the smooth mode, that is, every three times the same set of output values,
The actual data update period is approximately 2s.
When the concentration of particles in the air changes greatly, the sensor output automatically
Switch to fast mode, each output is a new value, the actual data update cycle of 200 ~ 800ms.
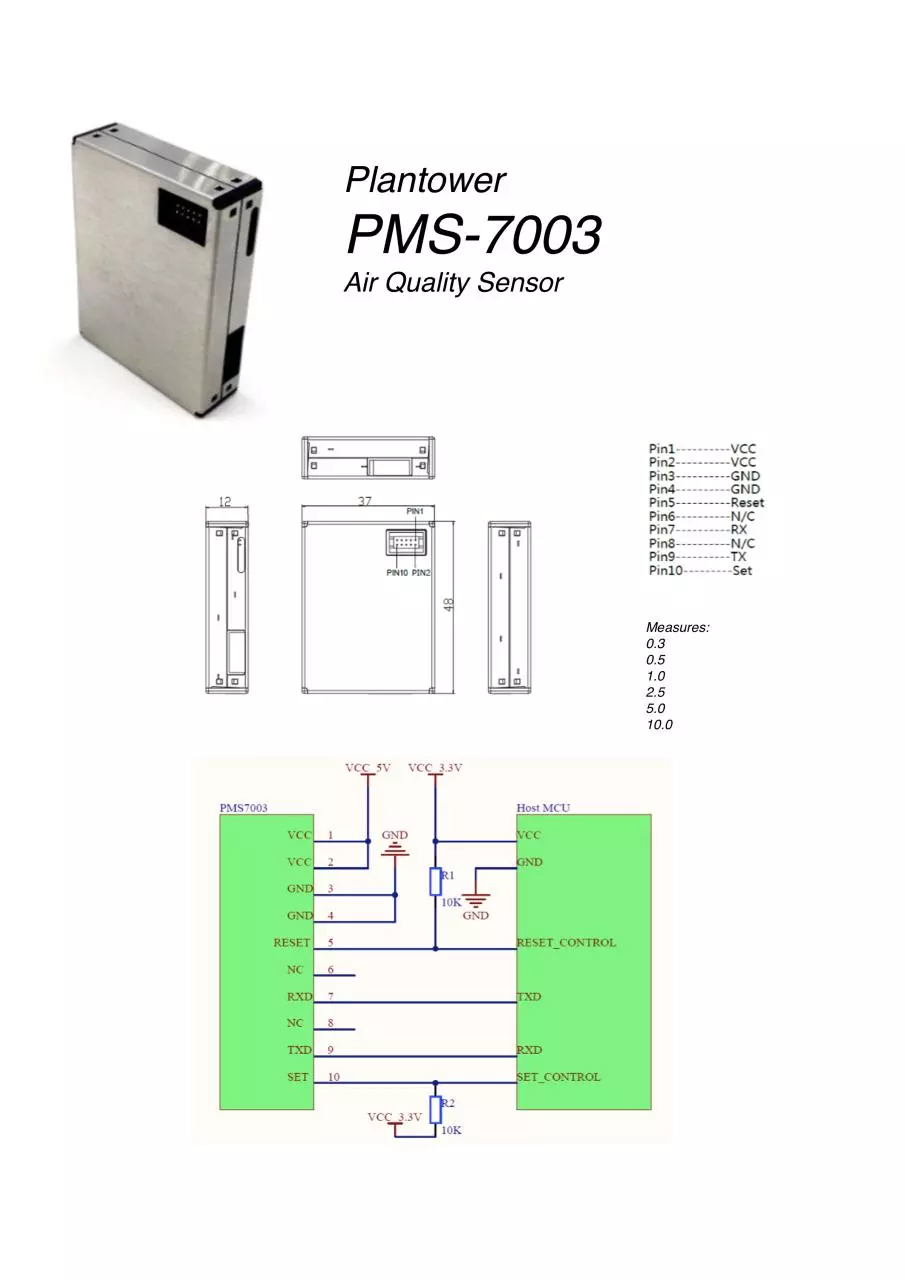
Shape structure and interface definition
Figure 2 shape and interface definition
Page 4
Beijing Kondo Technology Co., Ltd. 2016 Product Data Handbook
Table 2 Digital Interface Pin Definitions
PIN1
VCC
PIN2
VCC
Power supply is 5V
Power supply is 5V
PIN3
GND
Negative power supply
PIN4
PIN5
PIN6
GND
RESET
NC
Negative power supply
Module reset signal / TTL level @ 3.3V, low reset
PIN7
RX
Serial Receive Pin / TTL Level @ 3.3V
PIN8
NC
PIN9
TX
Serial port pin / TTL level @ 3.3V
PIN10
SET
Set pin / TTL level @ 3.3V, high or floating for
Normal working state, low level is dormant state
Typical circuit connection
Figure 3 Typical circuit connection diagram
Circuit design should be noted
1. PMS7003 requires 5V power supply, this is because the fan needs 5V drive. But other data communication and control
Pins require 3.3V as a high level. So the host board with which the communication is connected should be powered by 3.3V.
If the motherboard MCU is 5V power supply, then the communication line (RXD, TXD) and control line (SET, RESET)
Should be added to the level conversion chip or circuit.
2. SET and RESET internal pull-up resistor, if not used, it should be vacant.
Page 5
Beijing Kondo Technology Co., Ltd. 2016 Product Data Handbook
3. PIN6 and PIN8 for the program internal debugging, the application circuit should be vacant.
4. When applying the sleep function, note that the fan stops working when you sleep and the fan restart requires at least 30
Sec settling time, so to obtain accurate data, the sleep wake-up after the sensor working time should not be low
In 30 seconds.
Typical output characteristics
Asymmetric unit: μ g / m³ (PM2.5 mass concentration standard value, Appendix A data 2) abscissa unit: times
Figure 4-1 Sensor room temperature consistency (20 ℃)
Figure 4-2 High temperature consistency of the sensor (43 ° C)
Page 6
Beijing Kondo Technology Co., Ltd. 2016 Product Data Handbook
Figure 4-3 Sensor Low Temperature Consistency (-5 ° C)
Figure 4-4 Long-term continuous operation of the sensor consistency (30 days)
Page 7
Beijing Kondo Technology Co., Ltd. 2016 Product Data Handbook
The correspondence between temperature and consistency
The abscissa is the temperature, in ° C
Figure 5 The relationship between the absolute value of the maximum consistency deviation with temperature
Reliability test
Serial number
project
Test Methods
Judgement standard N
1
C
Run for a long time
Particle
N = 30
1, 10 ㎡ closed laboratory, temperature 20 ~ 25
℃, concentration
Humidity 30 ~ 70%, particulate matter generator
smoke,
C=0
0 ~ 500 μtog send
/ m³ of
Air purifier adjustment.
Set between 10 mining
Sample
2, DC 5V power
3
4
3, continuous operation after 720 hours to detect consistency
High temperature 1,10
operation
~ 100
μ g / m³
N = 10
㎡ thermostat laboratory, temperature 430℃,
humidity
testairprototype
and
70%, particulate matter generator to send Each
smoke,
purification
C = standard
0
The maximum error between the quasi-machine
Adjustment of the device.
Difference ± 15 μ g / m
2, DC 5V power test consistency
within;
Low temperature 1,10
operation
N = 10
㎡ thermostat laboratory, temperature -5³℃,
humidity
C=0
30%, particulate matter generator to send smoke, air purification
Adjustment of the device.
100 ~ 500 μ g / m
³
2, DC 5V power test consistency
2
test prototype and
N = standard
5
1, 10 ㎡ closed laboratory, temperature 20 ℃,Each
humidity
maximum
errorCbetween
the quasi-machine
50%, particulate matter generator to sendThe
smoke,
air purification
=0
Poor at ± 15%
Adjustment of the device.
vibration
2, DC 5V power test consistency
3, vibration frequency: 50Hz.
Inside;
4, Acceleration: 9.8 / S².
5, vibration direction: X, Y, Z direction.
6, amplitude (vertical): ± 2mm.
Fan no obvious abnormal sound
7, test time: X, Y, Z direction of 60 minutes.
Page 8
Beijing Kondo Technology Co., Ltd. 2016 Product Data Handbook
5
High temperature and high humidity storage 1, constant temperature
Particle
cabinet,
concentration
temperature
N = 10 70 ℃, humidity 90 ~ 95%
6
2, placed 500 hours
0 ~ 500 μ g / m³ of C = 0
Set between 10 mining
3, after removal of DC 5V power test consistency
Sample
Low temperature 1,
storage
constant temperature cabinet, temperature -30
℃, humidity 90 N
~ 95%
= 10
7
C=0
2, placed 500 hours
3, after removal of DC 5V power test consistency
0 ~ 100 μ g / m³
test prototype and
Power fluctuation1, 10 ㎡ closed laboratory, temperature 20 ℃,Each
N = standard
5
humidity
The
maximum
error
the quasi-machine
Cbetween
=0
50%, particulate matter generator to send smoke, air purification
Difference
±
10
μ
g
/
m
Adjustment of the device.
within;
2, adjustable DC power supply, from 4.5V up³ to
8
switch
9
Sleep switch
5.5V, and then down to 4.5V, repeated cycle changes
~ 500
μg/m
2 hours, the voltage change speed of 0.1V100
/ min.
with
³
When testing consistency
test prototype and
N = standard
10
1,10 ㎡ closed laboratory, temperature 20 ℃,Each
humidity
maximum
errorCbetween
the quasi-machine
50%, particulate matter generator to send The
smoke,
air purification
=0
Poor at ± 10%
Adjustment of the device.
Inside; 0.5Hz,
2, DC 5V power supply, power switching frequency
Lasted for 72 hours. After the end of the test consistency
no obvious abnormal
N = 10sound
1,10 ㎡ closed laboratory, temperature 20 ℃,Fan
humidity
50%, particulate matter generator to send smoke, air purification
C=0
Adjustment of the device.
2, DC 5V power supply, sleep control pin (SET)
Level conversion frequency of 0.5Hz, for 72 hours.
After the end of the test consistency
10
Laser switch
N = 10
1,10 ㎡ closed laboratory, temperature 20 ℃, humidity
50%, particulate matter generator to send smoke, air purification
C=0
Adjustment of the device.
2, the laser switching frequency 50HZ, for 240 hours,
After the end of the test consistency
11
Salt spray
Concentration of 5% industrial salt water, hydrolysis
Metal parts
spray
without
100 hours,
rust
N
= and
1
Remove and wash with pure water for 48 hours
Discoloration
C=0
Model definition
PMS
sensor type
70
03
Model version
PMS-particles are concentrated
Degree sensor
Minimum resolution particle size
03-0.3 microns
05-0.5 microns
10-1.0 microns
25-2.5 microns
Page 9
Beijing Kondo Technology Co., Ltd. 2016 Product Data Handbook
Product appearance size detail
Download Plantower PMS-7003 sensor data sheet
Plantower PMS-7003 sensor data sheet.pdf (PDF, 2.09 MB)
Download PDF
Share this file on social networks
Link to this page
Permanent link
Use the permanent link to the download page to share your document on Facebook, Twitter, LinkedIn, or directly with a contact by e-Mail, Messenger, Whatsapp, Line..
Short link
Use the short link to share your document on Twitter or by text message (SMS)
HTML Code
Copy the following HTML code to share your document on a Website or Blog
QR Code to this page

This file has been shared publicly by a user of PDF Archive.
Document ID: 0000581701.