101s17fongaf (PDF)
File information
Author: Amy Fong
This PDF 1.5 document has been generated by Acrobat PDFMaker 17 for Word / Adobe PDF Library 15.0, and has been sent on pdf-archive.com on 04/05/2017 at 00:57, from IP address 136.152.x.x.
The current document download page has been viewed 795 times.
File size: 169.56 KB (23 pages).
Privacy: public file


File preview
Expanding Transit Access in Alameda County:
Policy Recommendations for the First-Mile, Last-Mile Problem
Amy Fong
Public Policy 101
Spring 2017
1
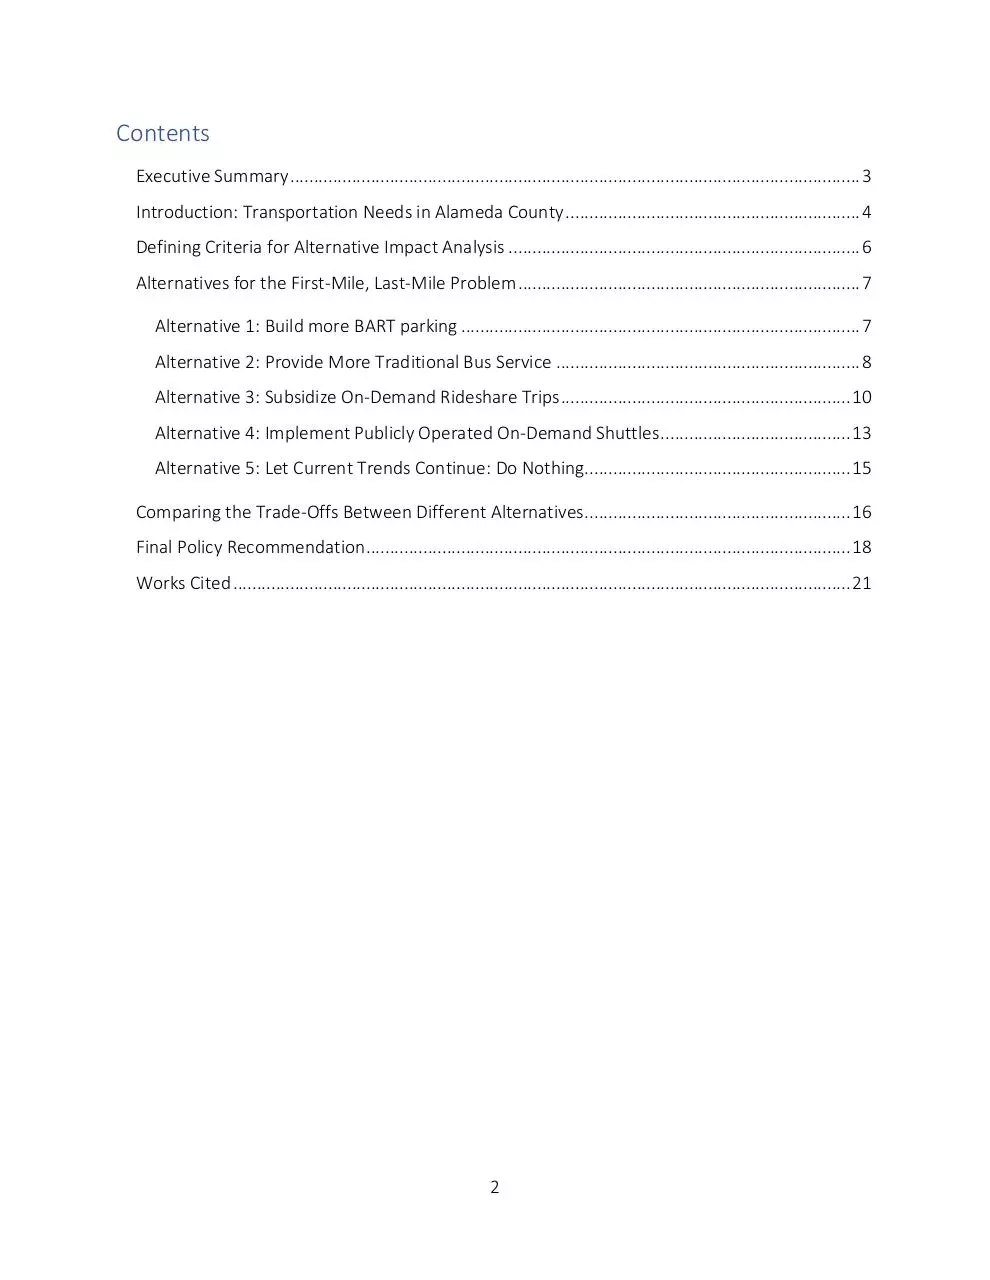
Contents
Executive Summary ........................................................................................................................ 3
Introduction: Transportation Needs in Alameda County .............................................................. 4
Defining Criteria for Alternative Impact Analysis .......................................................................... 6
Alternatives for the First-Mile, Last-Mile Problem ........................................................................ 7
Alternative 1: Build more BART parking .................................................................................... 7
Alternative 2: Provide More Traditional Bus Service ................................................................ 8
Alternative 3: Subsidize On-Demand Rideshare Trips ............................................................. 10
Alternative 4: Implement Publicly Operated On-Demand Shuttles ........................................ 13
Alternative 5: Let Current Trends Continue: Do Nothing........................................................ 15
Comparing the Trade-Offs Between Different Alternatives ........................................................ 16
Final Policy Recommendation ...................................................................................................... 18
Works Cited .................................................................................................................................. 21
2
Executive Summary
Alameda County is diverse in geography, cultures, and demographics. As a result, it
requires a diverse transportation system to meet the needs of its unique communities and
residents. Though the higher population density communities of Alameda County such as
Berkeley and Oakland are well-served by existing public transportation services such as AC
Transit fixed-route buses and commuter rail Bay Area Rapid Transit (BART), lower population
density communities such as Pleasanton, Dublin, and Union City have different transportation
requirements. As a result, the Transit Planning Committee of the Alameda County Transportation
Commission must project and analyze the impacts that innovate new transportation policies and
technologies may have for those residents of Alameda County who need alternatives to
traditional buses or rail.
The four primary criteria necessary to conduct such a policy analysis are the
effectiveness, cost-efficiency, equity, and political feasibility. Without meeting all four of these
criteria to some extent, a policy alternative is simply not appropriate. Effectiveness and costefficiency can be projected using data and information from previous implementations of similar
transportation policies, while equity and political feasibility rely on the particular demographics
of the residents of Alameda County. These criteria are applied to several possible policy
alternatives, and the resulting projects reveal that no one policy fulfills Alameda County
Transportation Commission’s mission and goals. As a result, the final policy recommendation
fuses two alternatives, subsidies for private, on-demand rideshares and the development of a
public on-demand shuttle. These policies are to be implemented sequentially: first, subsidies
have a low start-up cost as demand and awareness for such services is low, and following a
widespread preference for transit use in Alameda County, on-demand shuttles such as the AC
Transit FLEX shuttle will perform more effectively and efficiently than subsidized private rides.
The outcome of the subsidies to increase transit demand is necessary to ensure that the ondemand public shuttles will be accepted and successful by the public, so implementations of this
policy recommendation span multiple years.
3
Introduction: Transportation Needs in Alameda County
The Alameda County Transportation Commission (Alameda CTC)’s mission is to fund and
deliver transportation projects which expand access to the rest of the Bay Area and create a
vibrant and livable county. 1 There are many forms of transportation available to residents of the
county, including bus lines operated by the Alameda-Contra Costa Transit District (AC Transit),
commuter rail operated by the Bay Area Rapid Transit (BART), service by on-demand ridesharing
providers such as Uber Technologies Inc. and Lyft, traditional private cabs, bikeshare programs,
and miles of highways and local roads. Yet, in spite the diversity in forms of transportation, too
many people in the county still rely primarily on private automobiles in order to make their most
frequent trips such as their weekday commutes. In Alameda County, 75% of commuters are
using private vehicles or taxis to get to work. Only 13% take public transportation and 7% walk or
bike. Of the 13% who take public transportation, a significant proportion is likely to drive to and
park at a transit stop in order to access that station. 2 The problem that the Alameda CTC faces is
that too few people in Alameda County use public transportation in order to access their
intended destinations, particularly during their weekday commutes, when traffic congestion on
local roads and state highways in the county is at its worst. Not only does this congestion
indicate a lack of access in the county, it has negative manifestations in the form of air pollution,
noise pollution, safety to pedestrians, and thus the vibrancy of the communities of Alameda
County. Furthermore, when commuters choose private vehicles transit agencies face higher
operating costs per rider and as a result public transportation becomes decreasingly
economically viable. This is the reflected in the 20 percent decrease in service cost efficiency,
measured in cost per rider, reported by AC Transit from 2010 to 2015. 3 Meanwhile, traffic
congestion, measured by commuter delay due to traffic, has increased by 70 percent in the Bay
Area during those same years. 4
1
The Countywide Transportation Plan (2016), http://www.alamedactc.org/CountywideTransportationPlan.
US Census Bureau (2015), Commuting Characteristics in Alameda County, CA, 2011-2015 American Community
Survey 5-Year Estimates, https://factfinder.census.gov/faces/tableservices/jsf/pages/productview.xhtml?src=CF.
3
Statistical Summary of Bay Area Transit Operators (2016),
http://mtc.ca.gov/sites/default/files/Statistical_Summary_2015.pdf
4
Time Spent in Congestion: Vital Signs (2016), http://www.vitalsigns.mtc.ca.gov/time-spent-congestion.
2
4
This underutilization of public transportation and resulting excess demand on the road
system during weekday commutes may be caused by an array of different factors. These factors
depend on the individual and their lifestyle. For instance, working parents may value the ease
and flexibility that only a privately-owned vehicle can provide to their demanding and oftchanging schedules. However, there is also a large body of commuters whose decisions about
how to commute are driven largely by convenience, and thus are more flexible and open to
alternative forms of transportation. In other words, these commuters would be willing to take
public transportation to work if it was easier to get to public transportation from where they live.
A comparison of travel distance to the nearest transit stop and proportion of commuters who
use public transportation throughout Alameda County reveals this relationship between
accessibility and willingness or ability to use public transportation. 5 This problem is also
sometimes referred to as the first-mile/last-mile problem in transportation planning, and there
are many transportation agencies around the country and the world which are concerned with
this very problem in their own constituencies. A second group which stands to gain from
investment in solutions to the first-mile/last-mile problem is those who do not own cars and
must rely on public transportation whether or not it serves them well. As such, this problem
represents an opportunity for the Alameda CTC to improve the access to and quality of public
transportation for a large, diverse group of residents.
In order to define the scope of this analysis, the desired outcome is narrowed to
increased access to BART stations in Alameda County, because for many people considering
transit, BART is their first and best option. However, it is important to recognize that
transportation needs in the Bay Area are rapidly changing with the advent of autonomous
vehicles and other advancements in technology which may dramatically alter both what people
expect from their transportation system and what transportation agencies are able to provide to
their users.
5
PolicyMap, Distance in Miles from Nearest Rail Station, 2009, Percent of Commuters Using Public Transit, 20112015 (2017), http://ucberkeley.policymap.com/maps.
5
Defining Criteria for Alternative Impact Analysis
There are numerous ways to evaluate transportation projects and the benefits or costs
they bring to a community. Furthermore, it is crucial to evaluate such projects from several
different perspectives, as different groups or members of a society may be impacted differently
by certain policies and actions. As demonstrated by the Alameda CTC’s mission statement, there
are multiple goals sought from investments in the county’s infrastructure and transportation
system. Some of these goals, such as economic competitiveness and congestion reduction, can
be summarized with performance measures like the gross metropolitan product of the region or
travel time delay due to congestion. Other goals, like vibrancy, livability, or environmental justice
are not so easy to quantify. An additional challenge to effective policymaking is that these goals
may sometimes compete with each other and other times complement each other. For instance,
improving the throughput of a road in the congested downtown area of a city serves improves
the experience for drivers who save travel time at the expense of pedestrians’ and bicyclists’
safety and environment.
This policy analysis will employ four distinct criteria: effectiveness, efficiency, equity, and
political feasibility. The former two, effectiveness and efficiency, are “hard” criteria: they can be
measured and compared with quantitative data and analysis. The latter two, equity and political
feasibility, are “soft” criteria: they are a measure of the social values of a community.
Effectiveness is measured by how many new BART passengers a policy implementation will
induce. Efficiency is measured by the cost per new BART passenger. Effectiveness and efficiency
are sometimes related to each other, but are not redundant. It may be possible that a highly
effective solution is also efficient because it is a large cost that will induce many new riders,
leading to a low cost per passenger. However, some solutions may have high effectiveness and
low efficiency: they induce many new BART passengers but at a high cost per new passenger.
Conversely, some solutions may have low effectiveness and high efficiency: they do not induce
many new BART passengers but they are low cost. The equity of a solution will be measured by
the diversity of new passengers to BART stations. The political feasibility of a solution will be
measured by the likelihood that the community and the public will approve of a solution and
think it is an appropriate investment by the county.
6
Alternatives for the First-Mile, Last-Mile Problem
This analysis will define and evaluate five policy alternatives: building more parking at
BART stations, increasing the frequency or number of bus routes in certain parts of Alameda
County, subsidizing the cost of private, on-demand rideshares that access transit stations, the
implementation of a publicly-owned and operated on-demand shuttle that accesses transit
stations, and letting current trends continue by doing nothing. Each of these alternatives will be
evaluated by how effectively, efficiently, equitably, and feasibly they can meet the needs of
Alameda County residents who currently lack transit access.
Alternative 1: Build more BART parking
Building more parking at BART stations will allow more people to access transit, by driving
their cars to a BART station, and taking BART for the remainder of their trip. This is already a very
common way that people access BART stations. Nearly all BART stations in Alameda County
provide a few thousand parking spaces, including the Ashby, Castro Valley, Coliseum,
Dublin/Pleasanton, Fruitvale, Hayward, Lake Merritt, Macarthur, North Berkeley, Rockridge, San
Leandro, South Hayward, Union City, West Dublin/Pleasanton, and West Oakland stations.
Furthermore, the BART website states that these stations are full by 7 to 8 am on a typical
weekday, in spite of recent parking price increases. 6
Evidently, the demand exists for more parking at BART stations. Therefore, it is projected
that even building thousands of new parking spaces at any BART station would bring in nearly
just as many new BART riders. This alternative would be highly effective, as “demand for parking
at BART stations exceeds the number of spaces available, with a waiting list for parking permits
as long as 3,800 drivers.” 7 The stations which would attract the most new riders with increased
parking are likely those in the southern part of Alameda County, such as Castro Valley,
Dublin/Pleasanton, Hayward, San Leandro, South Hayward, Union City, and West
Dublin/Pleasanton, because these areas have the currently least BART access by traditional
transit such as bus service. Assuming that across these 7 stations 5,000 new parking spaces are
6
San Francisco Bay Area Rapid Transit District, Parking: What are the parking options at my station? (2017),
https://www.bart.gov/guide/parking.
7
Richards, G., “Roadshow: BART trying to squeeze in more parking spaces” (2016),
http://www.mercurynews.com/2016/10/14/roadshow-more-parking-at-new-bart-stations/.
7
added, a large proportion of people parking in these new spots are new BART riders, the
alternative of adding more BART parking will bring at least 4,000 new BART passengers.
However, this alternative is also high cost. The Bay Area is “the home of the most dire parking
construction expenses in the mainland US, running up $38K for a single underground parking
spot, or $29K for one above ground.” 8 Given that new BART parking would likely be above
ground, the cost of 5,000 new spaces would cost $145,000,000, or $35,250 per new transit rider.
Building more parking at BART stations is not an equitable solution. It is only a solution
for drivers; it leaves out increased access for those who rely on transit, pedestrians, and
bicyclists. In fact, building more parking comes at the expense of pedestrians and bicyclists: it
makes it more difficult for them to access a transit station when it is surrounded by abundant
parking, and it makes the station less safe. Furthermore, it is a solution that favors those who
already own cars; it is of no use to people who cannot afford cars and are likely those who need
enhanced transit access the most. It is because this solution is so low in equity that it is also not
politically feasible. Bay Area interest groups such as TransForm have a long history of opposing
generous parking lot plans and advocating for reduced parking minimums, and they have been
successful in changing the political and public perception of how much parking is necessary:
nowadays in the Bay Area, “Developers are often required by cities to commission a parking
study to demonstrate the feasibility of reduced parking on a site.” 9 This is because
transportation and city planners commonly agree that increasing parking only increases
congestion and disadvantages pedestrians and bicyclists. Evidently, a proposed solution of
building more parking at BART stations in the name of increasing transit access would be met
with scrutiny by many in the transportation community.
Alternative 2: Provide More Traditional Bus Service
Based on the results of the 2015 BART Station Profile Survey, in Alameda County BART
stations, on average 6% of people access the station by bus. Across the seven most suburban
BART stations, Castro Valley, Dublin/Pleasanton, Hayward, San Leandro, South Hayward, Union
8
Brinklow, A., “It costs $38,000 to create one parking space in San Francisco” (2016), Curbed San Francisco,
http://sf.curbed.com/2016/6/8/11890176/it-costs-38000-to-create-one-parking-space-in-sf.
9
TransForm California, Greentrip Parking Database, http://www.transformca.org/greentrip/parking-database.
8
City, and West Dublin/Pleasanton, access by bus is an even smaller proportion - just 4%.
Presumably, if bus services were increased to the stations from the surrounding suburban and
low density neighborhoods, more residents would access these stations by bus. In general,
increasing bus service does result in increased bus ridership, which indicates that this solution
would be somewhat effective. For instance, in the Portland, Oregon metropolitan area, “bus
ridership has been growing pretty consistently over the last year since we started adding back
service that was cut during the recession.” As a result, “rides on buses were up 4% overall, and
up 5.4% on our Frequent Service lines.” 10 In Alameda County, AC Transit’s weekday ridership is
180,000 people per day, or about 1200 people per bus line over 151 different routes. 11 Given
that 3 new routes are added in the aforementioned neighborhoods, and that these are likely to
be less popular than the highest performing AC Transit routes in higher density parts of the
county, it is projected that this alternative could increase BART access by about 500 people per
route, or 1500 people total. Bus routes on average cost AC Transit $2.6 million dollars per year to
operate, so three new bus routes could increase AC Transit’s operating costs by at least $7.8
million dollars per year, or a cost of $5,200 per year per new transit rider. 12
This solution will be equitable because bus riders are disproportionately low income
relative to all commuters. From 2008 AC Transit Rider Survey, “Altogether, approximately 72% of
adult respondents were from low income households, with 42% from extremely low-income
households.” 13 As a result, this alternative will serve the populations which need transit access
the most, and bring more diversity and justice to the overall transit system in the Bay Area.
Because of the popularity of bus transit from an environmental justice standpoint, new bus
routes may be politically feasible. There is rarely opposition to increased bus services by AC
Transit; if anything, a common critique of AC Transit is that their coverage of lower density parts
of the Bay Area and Alameda County is currently lacking. However, it is unlikely that AC Transit
10
Lum, B., “More Service Brings More Riders: Adding Up TriMet’s Ridership Stats” (2015),
http://howweroll.trimet.org/2015/04/21/more-service-more-riders-trimet-ridership-continues-to-grow/.
11
AC Transit, Ridership, Bus Fleet and Service (2017), http://www.actransit.org/about-us/facts-andfigures/ridership/.
12
AC Transit, Budget (2017), http://www.actransit.org/about-us/facts-and-figures/budget/.
13
Blash, L., “2008/2009 On-Board Rider Survey—System-wide Results” (2010), Public Research Institute,
http://www.actransit.org/wp-content/uploads/2008-09-On-Board-Rider-Profile-for-public-use.pdf.
9
Download 101s17fongaf
101s17fongaf.pdf (PDF, 169.56 KB)
Download PDF
Share this file on social networks
Link to this page
Permanent link
Use the permanent link to the download page to share your document on Facebook, Twitter, LinkedIn, or directly with a contact by e-Mail, Messenger, Whatsapp, Line..
Short link
Use the short link to share your document on Twitter or by text message (SMS)
HTML Code
Copy the following HTML code to share your document on a Website or Blog
QR Code to this page

This file has been shared publicly by a user of PDF Archive.
Document ID: 0000592039.