MY Lion Industries Initiating Coverage 20170519 RHB (PDF)
File information
This PDF 1.5 document has been generated by Microsoft® Word 2010, and has been sent on pdf-archive.com on 29/05/2017 at 10:04, from IP address 175.145.x.x.
The current document download page has been viewed 818 times.
File size: 515.07 KB (13 pages).
Privacy: public file


File preview
Malaysia Initiating Coverage
19 May 2017
Basic Materials | Metals
Buy
Lion Industries Corporation
Target Price:
Price:
Market Cap:
Bloomberg Ticker:
The Lion Awakes Once More
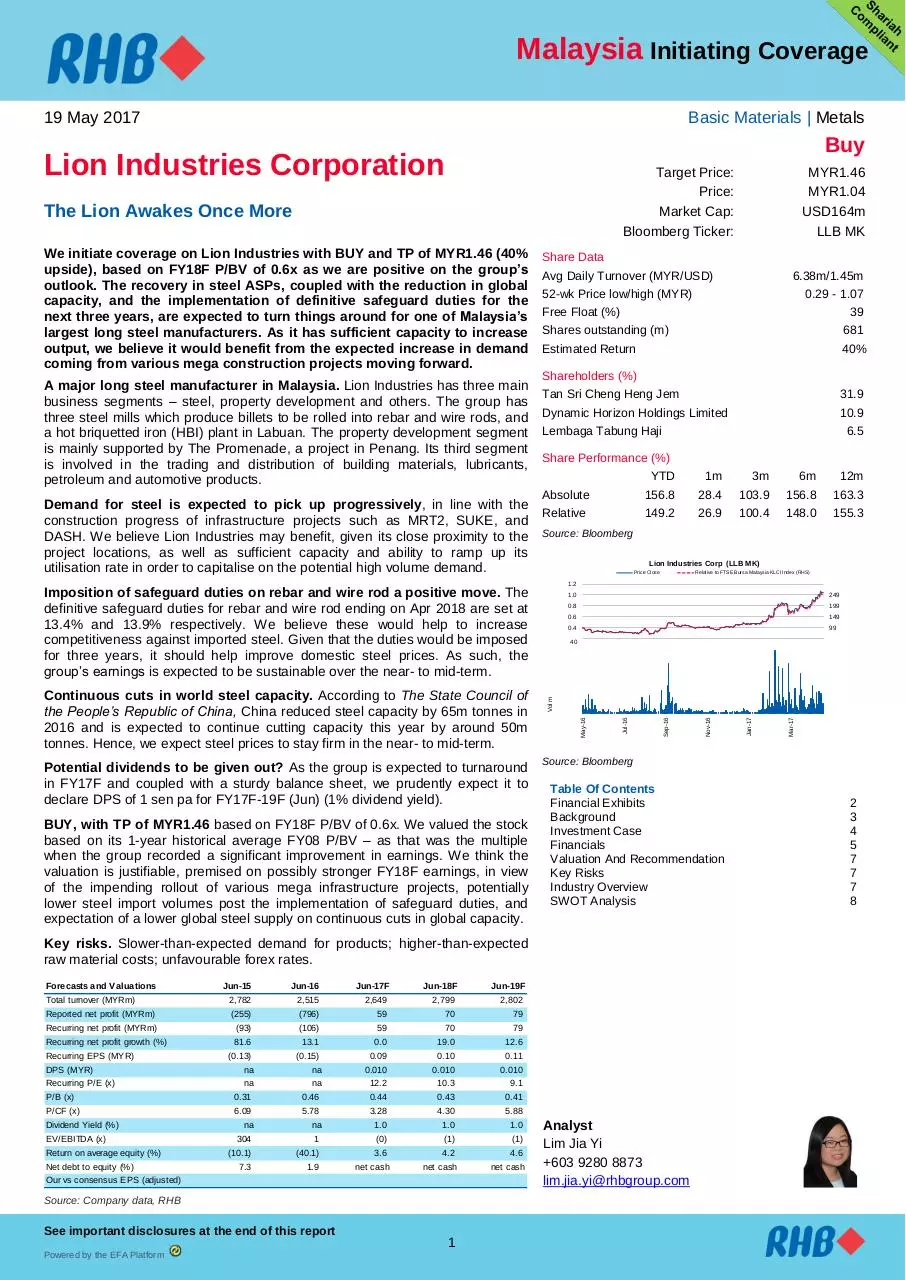
Share Performance (%)
YTD
Absolute
156.8
Relative
149.2
Potential dividends to be given out? As the group is expected to turnaround
in FY17F and coupled with a sturdy balance sheet, we prudently expect it to
declare DPS of 1 sen pa for FY17F-19F (Jun) (1% dividend yield).
BUY, with TP of MYR1.46 based on FY18F P/BV of 0.6x. We valued the stock
based on its 1-year historical average FY08 P/BV – as that was the multiple
when the group recorded a significant improvement in earnings. We think the
valuation is justifiable, premised on possibly stronger FY18F earnings, in view
of the impending rollout of various mega infrastructure projects, potentially
lower steel import volumes post the implementation of safeguard duties, and
expectation of a lower global steel supply on continuous cuts in global capacity.
Jun-15
Jun-16
Jun-17F
Jun-18F
Jun-19F
Total turnover (MYRm)
2,782
2,515
2,649
2,799
2,802
Reported net profit (MYRm)
(255)
(796)
59
70
79
Recurring net profit (MYRm)
(93)
(106)
59
70
79
Recurring net profit growth (%)
81.6
13.1
0.0
19.0
12.6
(0.13)
(0.15)
Recurring EPS (MYR)
DPS (MYR)
Recurring P/E (x)
na
0.10
0.11
0.010
0.010
0.010
na
12.2
10.3
9.1
P/B (x)
0.31
0.46
0.44
0.43
0.41
P/CF (x)
6.09
5.78
Dividend Yield (%)
EV/EBITDA (x)
Return on average equity (%)
Net debt to equity (%)
na
0.09
na
3.28
4.30
5.88
na
1.0
1.0
1.0
304
1
(0)
(1)
(1)
(10.1)
(40.1)
7.3
1.9
na
3.6
net cash
4.2
net cash
Our vs consensus EPS (adjusted)
Source: Company data, RHB
See important disclosures at the end of this report
Powered by the EFA Platform
1
4.6
net cash
3m
103.9
100.4
6m
156.8
148.0
12m
163.3
155.3
Lion Industries Corp (LLB MK)
Price Close
Relative to FTSE Bursa Malaysia KLCI Index (RHS)
1.2
149
0.4
99
0.2
40
35
30
25
20
15
10
5
49
Mar-17
199
0.6
Jan-17
249
0.8
May-16
Vol m
1.0
Source: Bloomberg
Table Of Contents
Financial Exhibits
Background
Investment Case
Financials
Valuation And Recommendation
Key Risks
Industry Overview
SWOT Analysis
Key risks. Slower-than-expected demand for products; higher-than-expected
raw material costs; unfavourable forex rates.
Forecasts and Valuations
31.9
10.9
6.5
Source: Bloomberg
Imposition of safeguard duties on rebar and wire rod a positive move. The
definitive safeguard duties for rebar and wire rod ending on Apr 2018 are set at
13.4% and 13.9% respectively. We believe these would help to increase
competitiveness against imported steel. Given that the duties would be imposed
for three years, it should help improve domestic steel prices. As such, the
group’s earnings is expected to be sustainable over the near- to mid-term.
Continuous cuts in world steel capacity. According to The State Council of
the People’s Republic of China, China reduced steel capacity by 65m tonnes in
2016 and is expected to continue cutting capacity this year by around 50m
tonnes. Hence, we expect steel prices to stay firm in the near- to mid-term.
1m
28.4
26.9
Nov-16
Demand for steel is expected to pick up progressively, in line with the
construction progress of infrastructure projects such as MRT2, SUKE, and
DASH. We believe Lion Industries may benefit, given its close proximity to the
project locations, as well as sufficient capacity and ability to ramp up its
utilisation rate in order to capitalise on the potential high volume demand.
6.38m/1.45m
0.29 - 1.07
39
681
40%
Shareholders (%)
Tan Sri Cheng Heng Jem
Dynamic Horizon Holdings Limited
Lembaga Tabung Haji
Sep-16
A major long steel manufacturer in Malaysia. Lion Industries has three main
business segments – steel, property development and others. The group has
three steel mills which produce billets to be rolled into rebar and wire rods, and
a hot briquetted iron (HBI) plant in Labuan. The property development segment
is mainly supported by The Promenade, a project in Penang. Its third segment
is involved in the trading and distribution of building materials, lubricants,
petroleum and automotive products.
Share Data
Avg Daily Turnover (MYR/USD)
52-wk Price low/high (MYR)
Free Float (%)
Shares outstanding (m)
Estimated Return
Jul-16
We initiate coverage on Lion Industries with BUY and TP of MYR1.46 (40%
upside), based on FY18F P/BV of 0.6x as we are positive on the group’s
outlook. The recovery in steel ASPs, coupled with the reduction in global
capacity, and the implementation of definitive safeguard duties for the
next three years, are expected to turn things around for one of Malaysia’s
largest long steel manufacturers. As it has sufficient capacity to increase
output, we believe it would benefit from the expected increase in demand
coming from various mega construction projects moving forward.
MYR1.46
MYR1.04
USD164m
LLB MK
Analyst
Lim Jia Yi
+603 9280 8873
lim.jia.yi@rhbgroup.com
2
3
4
5
7
7
7
8
Lion Industries Corporation
Malaysia Initiating Coverage
19 May 2017
Basic Materials | Metals
Financial Exhibits
Financial model updated on : 2017-05-18.
Asia
Malaysia
Basic Materials
Lion Industries Corporation
Bloomberg
LLB MK
Buy
Financial summary
Recurring EPS (MYR)
EPS (MYR)
DPS (MYR)
BVPS (MYR)
Weighted avg adjusted shares (m)
Jun-15
(0.13)
(0.36)
0.000
3.33
716
Jun-16
(0.15)
(1.14)
0.000
2.27
702
Jun-17F
0.09
0.09
0.010
2.39
694
Jun-18F
0.10
0.10
0.010
2.43
694
Jun-19F
0.11
0.11
0.010
2.54
694
Valuation basis
Valuation metrics
Recurring P/E (x)
P/E (x)
P/B (x)
FCF Yield (%)
Dividend Yield (%)
EV/EBITDA (x)
EV/EBIT (x)
Jun-15
na
na
0.31
12.6
0.0
304
na
Jun-16
na
na
0.46
15.7
0.0
1
4.92
Jun-17F
12.2
12.2
0.44
29.0
1.0
(0)
(0.59)
Jun-18F
10.3
10.3
0.43
21.8
1.0
(1)
(1.19)
Jun-19F
9.1
9.1
0.41
15.5
1.0
(1)
(1.79)
Income statement (MYRm)
Total turnover
Gross profit
EBITDA
Depreciation and amortisation
Operating profit
Net interest
Exceptional income - net
Pre-tax profit
Taxation
Minority interests
Recurring net profit
Jun-15
2,782
216
1
(116)
(115)
(51)
(83)
(279)
(9)
33
(93)
Jun-16
2,515
249
155
(133)
21
(39)
(800)
(853)
(53)
109
(106)
Jun-17F
2,649
509
273
(134)
140
(28)
0
90
(22)
(9)
59
Jun-18F
2,799
529
283
(134)
149
(11)
0
107
(26)
(11)
70
Jun-19F
2,802
541
286
(134)
152
(2)
0
121
(29)
(13)
79
Cash flow (MYRm)
Change in working capital
Cash flow from operations
Capex
Cash flow from investing activities
Dividends paid
Cash flow from financing activities
Cash at beginning of period
Net change in cash
Ending balance cash
Jun-15
66
122
(29)
51
0
(150)
284
24
308
Jun-16
108
126
(12)
81
0
(228)
309
(21)
287
Jun-17F
(16)
220
(11)
13
(7)
(165)
281
67
348
Jun-18F
(73)
168
(11)
13
(7)
(140)
339
41
380
Jun-19F
(86)
123
(11)
13
(7)
(75)
380
61
441
Balance sheet (MYRm)
Total cash and equivalents
Tangible fixed assets
Intangible assets
Total investments
Total other assets
Total assets
Short-term debt
Total long-term debt
Total liabilities
Shareholders' equity
Minority interests
Total equity
Net debt
Total liabilities & equity
Jun-15
347
1,080
130
838
717
4,258
388
152
1,591
2,381
287
2,668
194
4,258
Jun-16
318
747
130
813
150
2,980
263
89
1,228
1,596
156
1,752
34
2,980
Jun-17F
376
626
130
813
148
2,954
147
74
1,130
1,659
165
1,824
(155)
2,954
Jun-18F
417
504
130
757
126
2,828
88
11
963
1,689
176
1,865
(318)
2,828
Jun-19F
478
382
130
739
124
2,744
28
5
794
1,761
189
1,950
(445)
2,744
Key metrics
Revenue growth (%)
Recurrent EPS growth (%)
Gross margin (%)
Operating EBITDA margin (%)
Net profit margin (%)
Dividend payout ratio (%)
Capex/sales (%)
Interest cover (x)
Jun-15
(37.9)
82.0
7.7
0.0
(9.2)
0.0
1.0
(2.26)
Jun-16
(9.6)
15.4
9.9
6.1
(31.7)
0.0
0.5
0.55
Jun-17F
5.3
0.0
19.2
10.3
2.2
11.7
0.4
5.08
Jun-18F
5.6
19.0
18.9
10.1
2.5
9.9
0.4
13.85
Jun-19F
0.1
12.6
19.3
10.2
2.8
8.8
0.4
64.34
FY18F P/BV of 0.6x
Key drivers
i. Higher steel price that can command better
margins;
ii. Higher-than-expected
demand
for
steel
products.
Key risks
i. Slower-than-expected demand for products;
ii. Higher-than-expected raw material costs;
iii. Unfavourable forex rates.
Company Profile
Lion Industries is involved in the manufacturing of long
steel product and has three main business segments,
i.e., steel, property development and others.
Source: Company data, RHB
See important disclosures at the end of this report
2
Lion Industries Corporation
Malaysia Initiating Coverage
19 May 2017
Basic Materials | Metals
Background
A major long steel manufacturer in Malaysia
Lion Industries was incorporated on 17 May 1924 and listed on the Main Market of Bursa
Malaysia on 29 Dec 1973. The group is involved in the manufacturing of long steel
products and has three main business segments, ie steel, property development and
others, which contributed 71%, 6% and 23% respectively to the group’s FY16 revenue.
Lion Industries owns 74% of Lion Forest Industries (LFIB), a building materials company,
and collectively holds 28% of Parkson Holdings (PHB), which has the Parkson retail
business, as its associate (Figure 1).
Figure 1: Lion Industries’ corporate structure
Source: Company data, RHB
The group has three steel mills operated by Amsteel Mills Sdn Bhd (Amsteel) and Antara
Steel Mills Sdn Bhd (Antara). Amsteel’s Klang plant produces billets for rolling into steel
bars and wire rods while the Banting plant manufactures special grade billets for rolling
into specialty bars and wire rods for automotive parts, mattress and mechanical springs,
turning parts, and wire ropes. The Banting plant has however been temporarily shut down
since 2014 in view of the challenging market conditions back then. Meanwhile, Antara’s
Johor plant produces billets which are rolled into steel bars and light sections such as
angle bars, flat bars and U-channels.
Besides steel mills, the group also has a HBI plant in Labuan. HBI is manufactured from
high-purity iron ore and it is supplied to steel mills for ironmaking, steelmaking and foundry
applications. It is catered mainly for the export market.
For the property development segment, the group is involved in The Promenade project,
which features 336 units of serviced suites with 37 units of lifestyle boutique shops and a
street plaza at Bandar Bayan Baru, Penang. In addition, the group has a project at Taman
Malim Jaya, Melaka, which comprises 32 units of 2-storey shop-offices.
The others segment consists of building materials, lubricants, petroleum, automotive
products, and the Parkson retail business. The building materials arm is a trading and
distribution business that covers cement, roof tiles, tiles and bricks. As for lubricants, the
group had expanded its Hi-Rev motorcycle lubricant products range and introduced
TorQe, with Ester Plus, which is specially developed for superbikes.
See important disclosures at the end of this report
3
Lion Industries Corporation
Malaysia Initiating Coverage
19 May 2017
Basic Materials | Metals
Investment Case
Expect a demand boost from mega construction projects
Since 2016, the Government has awarded various infrastructure projects including MRT2,
Sungai Besi-Ulu Kelang Elevated Expressway (SUKE), Damansara-Shah Alam Highway
(DASH). For these projects, we expect the demand for rebar and other building materials
to kick in progressively from FY17 onwards. Lion Industries has one of the largest
capacities, with 3.93m tonnes pa molten steel and billet production capacity and 2.35m
tonnes pa of rebar and wire rod rolling capacity – produced in Klang, Johor and Banting.
We believe that the group may stand out as a beneficiary of mega infrastructure projects,
given their close proximity to the project locations. Also, Lion Industries has sufficient
capacity and ability to ramp up the utilisation rates in order to capitalise on the potential
high volume demand.
On top of that, several mega projects such as LRT3, Tun Razak Exchange (TRX), and
East Coast Rail Link (ECRL) have yet to be announced, which may be another catalyst to
improve the demand for steel, in our view. Although the property market has not shown a
significant improvement as yet, we believe the various infrastructure projects may likely
keep the group busy. Nonetheless, a revival in the property market in the future is likely to
be an added boost for Lion Industries.
Imposition of safeguard duties on rebar and wire rod a positive
In Apr 2017, the Government imposed definitive safeguard duties on rebar, steel wire rods
(SWR) and deformed bar in coils (DBIC) for three years. The safeguard duty for rebar,
which would end on 13 Apr 2018, was set at 13.42%, followed by 12.27% and 11.1% in
the following two years respectively.
Meanwhile, the duty for SWR and DBIC (ending on 14 Apr 2018) was determined at
13.9%, followed by 12.9% and 11.9% over the next two years respectively. We believe
that this bodes well for the group, as it may help to increase the competitiveness of local
steel against imported steel, which were initially priced below local rates.
Prior to the implementation of duties, the provisional safeguard duties for rebar (13.42%),
SWR and DBIC (13.9%) were implemented in Sep 2016. According to the Ministry of
International Trade and Industry’s (MITI) domestic rebar price, rebar ASP improved by 1713% respectively to MYR2,070-2,179 per tonne in 2Q17, from MYR1,766-1,923 per tonne
in 3Q16.
In view of the narrowing pricing gap between local and imported rebar, coupled with lower
import volume from China, the world’s biggest steel exporter (Figure 2), and other
countries, we believe that the recovery in the group earnings is expected to be sustainable
over the near- to mid-term.
Figure 2: China’s steel export volumes
('000 tonnes)
Title:
Source:
6000
5000
Please fill in the values abo
4000
3000
2000
1000
Source: Bloomberg
See important disclosures at the end of this report
4
Mar-17
Feb-17
Jan-17
Dec-16
Nov-16
Oct-16
Sep-16
Aug-16
Jul-16
Jun-16
May-16
Apr-16
Mar-16
Feb-16
Jan-16
Dec-15
Nov-15
Oct-15
Sep-15
Aug-15
Jul-15
0
Lion Industries Corporation
Malaysia Initiating Coverage
19 May 2017
Basic Materials | Metals
Continuous cuts in world steel capacity another key driver
According to The State Council of the People’s Republic of China, China cut 65m tonnes
of steel capacity in 2016, and the country is expected to reduce steel production capacity
this year by another 50m tonnes. The continuous capacity reduction should bode well for
the group, with the Chinese Government’s announcement in Feb 2016 to close 100-150m
tonnes of steel capacity by 2020.
Since Feb 2016, the domestic rebar price according to MITI has increased progressively
to a high of MYR2,250-2,400 per tonne from MYR1,500-1,600 per tonne, before
normalising to MYR1,700-1,850 per tonne, prior to the announcement of the provisional
safeguard duties as mentioned earlier. Given China’s commitment to bring down steel
capacity further, we expect steel prices to stay firm in the near- to mid-term.
Potential dividends to be given out?
For the last five years, Lion Industries reported uninspiring results as the group was
affected by the persistent global oversupply of steel and continuous pressure on selling
prices from the influx of imports. Back in FY12-13 when the group recorded lower losses,
DPS of 1 sen pa was declared for both years.
Thereafter, the group did not declare any dividends, which we deemed was due to
widening losses incurred in FY14-16. As we expect the group to return to the black in
FY17F and its FY16 net gearing level was pared down significantly to 0.04x, we do not
discount the possibility of potential dividends being declared to reward shareholders.
Hence, we conservatively expect the group to declare DPS of 1 sen pa for FY17-19F (1%
dividend yield).
Financials
Historical performance review
Lion Industries’ revenue had been declining during FY12-16 (Figure 3), mainly due to
lower revenue from the steel segment, as steel prices were continuously under pressure.
This was due to the persistent global oversupply of steel and continuous influx of steel
imports. Eventually, this led to the plants in Banting and Johor cutting back on production
with the temporary shutdown of certain production lines.
Meanwhile, its building materials segment also recorded declining revenue during FY1215 due to the slowdown in the property market for both residential and commercial
properties.
On the brighter side, the property development segment recorded progressive revenue
growth, thanks to The Promenade project. Meanwhile, the “others” segment’s
performance remained relatively flat. This segment accounted for about 5% of full-year
revenue for the past few years, which we deemed as insignificant.
Figure 3: Lion Industries’ historical performance and estimates
(%)
3.0%
(MYRm)
6,000.0
Title:
Source:
2.0%
5,000.0
1.0%
4,000.0
0.0%
3,000.0
-1.0%
-2.0%
2,000.0
-3.0%
1,000.0
-4.0%
0.0
-5.0%
FY2012
FY2013
Revenue (MYR'm)
FY2014
FY2015
FY2016
Core net profit (MYR'm)
FY2017F FY2018F
Core net profit margin (%)
Source: Company data, RHB
See important disclosures at the end of this report
5
Please fill in the values abo
Lion Industries Corporation
Malaysia Initiating Coverage
19 May 2017
Basic Materials | Metals
1HFY17 results review
Into the black. Lion Industries’ core earnings were positive in 1HFY17 even though there
was a slight drop in revenue (-0.8ppt YoY), mainly due to higher steel ASP and the surge
in the steel segment’s EBIT margin (+14.3 ppt YoY).
Its property unit recorded higher EBIT margin (+7.5 ppt YoY), mainly contributed by The
Promenade.
Figure 4: Lion Industries' 1HFY17 results review
FYE Jun (MYRm)
2QFY16
1QFY17
2QFY17
QoQ (%)
YoY (%)
1HFY17
1HFY16
YoY (%)
Revenue
596.5
514.2
644.5
25.4
8.0
1,158.7
1,168.5
(0.8)
EBITDA
67.1
32.8
98.0
>100
46.0
125.6
18.0
>100
EBITDA Margin (%)
11.3
6.4
15.2
NA
NA
10.8
1.5
NA
Depreciation
(29.4)
(26.9)
(25.6)
(4.8)
(12.9)
(52.5)
(58.6)
(10.4)
EBIT
(28.1)
17.3
55.7
>100
NM
73.1
(40.6)
NM
EBIT Margin (%)
(4.7)
3.4
8.6
NA
NA
6.3
(3.5)
NA
Interest expense
(11.1)
(5.7)
(6.7)
NM
NM
(12.4)
(24.1)
(48.6)
Interest income
Associates
10.9
(12.1)
1.4
(12.8)
2.1
18.4
48.6
NM
(80.7)
NM
3.5
5.6
13.5
(0.8)
(73.9)
NM
EI/Others
Pretax profit
68.5
27.3
1.1
0.2
17.2
69.5
NM
NM
NM
>100
18.3
69.8
70.5
15.7
NM
>100
Pretax Margin (%)
4.6
0.0
10.8
NA
NA
6.0
1.3
NA
Tax
(2.0)
(2.7)
(10.2)
>100
>100
(13.0)
(5.7)
>100
Effective tax rate (%)
7.5
NM
14.7
NA
NA
18.6
36.5
NA
Minority Interest
0.7
0.0
3.8
NA
NA
3.9
1.9
NA
Net Profit
24.6
(2.5)
55.5
NM
>100
53.0
8.1
>100
Core Net Profit
(44.0)
(3.6)
38.3
NM
NM
34.6
(62.4)
NM
Core net margin (%)
(7.4)
(0.7)
5.9
NA
NA
3.0
(5.3)
NA
Source: RHB, Company data
See important disclosures at the end of this report
6
Comments
Higher steel revenue was offset by
lower revenue from the building
materials segment
Higher EBIT margin due to stronger
steel ASP
Higher core net profit was mainly due
to a stronger steel ASP and sales
tonnage
Lion Industries Corporation
Malaysia Initiating Coverage
19 May 2017
Basic Materials | Metals
Valuation And Recommendation
BUY with TP of MYR1.46, based on FY18F P/BV of 0.6x
We value Lion Industries based on FY18F P/BV of 0.6x, arriving at a TP of MYR1.46. As
we could not obtain the historical average P/E due to losses over the last few years, we
opted to value the group through the P/BV approach instead.
We based our FY18F P/BV on the 1-year historical average FY08 P/BV – as that was the
year when the group recorded a significant improvement in earnings.
We think that the valuation is justifiable, premised on potential stronger FY18F earnings in
view of the impending rollout of various mega infrastructure projects, potentially lower
import volume post implementation of safeguard duties and expectation of lower global
steel supply in view of the continuous cuts in world steel capacity.
Moreover, our target P/BV of 0.6x is still below the FBMSC’s FY18F P/BV of 0.99x. The
group is trading at a huge discount to its FY18F NTA/share of MYR2.23. At the current
price, the potential upside is 40%.
Figure 5: Historical forward P/BV
P/BV (x)
0.80
Title:
Source:
0.70
Please fill in the values abo
0.60
0.50
0.40
0.30
0.20
0.10
0.00
May-07
Jul-08
Fwd P/BV
Sep-09
Nov-10
Fwd avg P/BV
Jan-12
Mar-13
+1SD
May-14
Jul-15
-1SD
+2SD
Sep-16
-2SD
Source: RHB
Key Risks
Risk to our call include slower-than-expected demand for products, higher-than-expected
raw material costs, unfavourable forex, and slower-than-expected capacity reduction in
China.
As local demand is likely to remain intact for the near- to mid-term due to demand from
impending mega infrastructure projects, as well as the Chinese Government’s
commitment to bring down steel capacity further, we believe the risks are manageable.
Industry Overview
Over the past few years, the steel industry in Malaysia has encountered intense
competition from global oversupply of steel, and pressure on domestic steel prices. The
influx of steel imports from China’s steel mills had further led to depressed steel prices and
compression in local steel mills’ profit margin.
However, the domestic long steel industry has started to show signs of recovery since the
imposition of provisional safeguard duty measures in Sep 2016. Subsequently, the
Government announced in Apr 2017 that the definitive safeguard duty for rebar and wire
rod are to be imposed for the next three years, which we think should help to improve
domestic steel prices and provide more stability to steel mills’ earnings in the near- to midterm.
See important disclosures at the end of this report
7
Lion Industries Corporation
Malaysia Initiating Coverage
19 May 2017
Basic Materials | Metals
SWOT Analysis
Dominant long steel producer with a strong presence
in Malaysia
Has exposure to non-steel segments such as
property development and lubricants that can help
reduce volatility in earnings
Recovery in steel
prices may lead to
reopening of steel
plants
Persistent
oversupply of steel
may limit room for
growth in steel
prices
Implementation
of mega
construction
projects may
help to boost
demand for
steel
Government
implementation
of safeguard
duty helps to
increase
competitiveness
against imports
Lower contribution from its associate
Cuts in China’s
steel capacity
may reduce
world steel
supply
Recommendation Chart
Price Close
0.27
0.40
0.45
0.52
0.53
0.62
0.76
1.21
1.50
1.28
1.70
1.37
1.1
Recommendations & Target Price
1.12
1.3
0.9
0.7
0.5
0.3
Buy
0.1
May-12
Neutral
Aug-13
Sell
Trading Buy
Nov-14
Take Profit
Not Rated
Mar-16
Source: RHB, Bloomberg
See important disclosures at the end of this report
8
Date
Recommendation
Target Price
Price
2015-08-28
Neutral
0.27
0.30
2015-05-31
Neutral
0.40
0.40
2015-03-01
Neutral
0.45
0.47
2014-11-27
Neutral
0.52
0.56
2014-08-29
Sell
0.53
0.64
2014-05-28
Neutral
0.62
0.62
2013-12-03
Neutral
0.76
0.74
2013-11-28
Neutral
0.76
0.77
2013-08-30
Trading Buy
1.21
0.90
2013-05-31
Buy
1.50
1.17
Source: RHB, Bloomberg
Lion Industries Corporation
Malaysia Initiating Coverage
Basic Materials | Metals
RHB Guide to Investment Ratings
Buy: Share price may exceed 10% over the next 12 months
Trading Buy: Share price may exceed 15% over the next 3 months, however longer-term outlook remains uncertain
Neutral: Share price may fall within the range of +/- 10% over the next 12 months
Take Profit: Target price has been attained. Look to accumulate at lower levels
Sell: Share price may fall by more than 10% over the next 12 months
Not Rated: Stock is not within regular research coverage
Investment Research Disclaimers
RHB has issued this report for information purposes only. This report is intended for circulation amongst RHB and its affiliates’ clients generally or such
persons as may be deemed eligible by RHB to receive this report and does not have regard to the specific investment objectives, financial situation and
the particular needs of any specific person who may receive this report. This report is not intended, and should not under any circumstances be construed
as, an offer or a solicitation of an offer to buy or sell the securities referred to herein or any related financial instruments.
This report may further consist of, whether in whole or in part, summaries, research, compilations, extracts or analysis that has been prepared by RHB’s
strategic, joint venture and/or business partners. No representation or warranty (express or implied) is given as to the accuracy or completeness of such
information and accordingly investors should make their own informed decisions before relying on the same.
This report is not directed to, or intended for distribution to or use by, any person or entity who is a citizen or resident of or located in any locality, state,
country or other jurisdiction where such distribution, publication, availability or use would be contrary to the applicable laws or regulations. By accepting
this report, the recipient hereof (i) represents and warrants that it is lawfully able to receive this document under the laws and regulations of the jurisdiction
in which it is located or other applicable laws and (ii) acknowledges and agrees to be bound by the limitations contained herein. Any failure to comply with
these limitations may constitute a violation of applicable laws.
All the information contained herein is based upon publicly available information and has been obtained from sources that RHB believes to be reliable and
correct at the time of issue of this report. However, such sources have not been independently verified by RHB and/or its affiliates and this report does not
purport to contain all information that a prospective investor may require. The opinions expressed herein are RHB’s present opinions only and are subject
to change without prior notice. RHB is not under any obligation to update or keep current the information and opinions expressed herein or to provide the
recipient with access to any additional information. Consequently, RHB does not guarantee, represent or warrant, expressly or impliedly, as to the
adequacy, accuracy, reliability, fairness or completeness of the information and opinion contained in this report. Neither RHB (including its officers,
directors, associates, connected parties, and/or employees) nor does any of its agents accept any liability for any direct, indirect or consequential losses,
loss of profits and/or damages that may arise from the use or reliance of this research report and/or further communications given in relation to this report.
Any such responsibility or liability is hereby expressly disclaimed.
Whilst every effort is made to ensure that statement of facts made in this report are accurate, all estimates, projections, forecasts, expressions of opinion
and other subjective judgments contained in this report are based on assumptions considered to be reasonable and must not be construed as a
representation that the matters referred to therein will occur. Different assumptions by RHB or any other source may yield substantially different results
and recommendations contained on one type of research product may differ from recommendations contained in other types of research. The
performance of currencies may affect the value of, or income from, the securities or any other financial instruments referenced in this report. Holders of
depositary receipts backed by the securities discussed in this report assume currency risk. Past performance is not a guide to future performance. Income
from investments may fluctuate. The price or value of the investments to which this report relates, either directly or indirectly, may fall or rise against the
interest of investors.
This report does not purport to be comprehensive or to contain all the information that a prospective investor may need in order to make an investment
decision. The recipient of this report is making its own independent assessment and decisions regarding any securities or financial instruments referenced
herein. Any investment discussed or recommended in this report may be unsuitable for an investor depending on the investor’s specific investment
objectives and financial position. The material in this report is general information intended for recipients who understand the risks of investing in financial
instruments. This report does not take into account whether an investment or course of action and any associated risks are suitable for the recipient. Any
recommendations contained in this report must therefore not be relied upon as investment advice based on the recipient's personal circumstances.
Investors should make their own independent evaluation of the information contained herein, consider their own investment objective, financial situation
and particular needs and seek their own financial, business, legal, tax and other advice regarding the appropriateness of investing in any securities or the
investment strategies discussed or recommended in this report.
This report may contain forward-looking statements which are often but not always identified by the use of words such as “believe”, “estimate”, “intend”
and “expect” and statements that an event or result “may”, “will” or “might” occur or be achieved and other similar expressions. Such forward-looking
statements are based on assumptions made and information currently available to RHB and are subject to known and unknown risks, uncertainties and
other factors which may cause the actual results, performance or achievement to be materially different from any future results, performance or
achievement, expressed or implied by such forward-looking statements. Caution should be taken with respect to such statements and recipients of this
9
Download MY Lion Industries Initiating Coverage 20170519 RHB
MY_Lion Industries_Initiating Coverage_20170519_RHB.pdf (PDF, 515.07 KB)
Download PDF
Share this file on social networks
Link to this page
Permanent link
Use the permanent link to the download page to share your document on Facebook, Twitter, LinkedIn, or directly with a contact by e-Mail, Messenger, Whatsapp, Line..
Short link
Use the short link to share your document on Twitter or by text message (SMS)
HTML Code
Copy the following HTML code to share your document on a Website or Blog
QR Code to this page

This file has been shared publicly by a user of PDF Archive.
Document ID: 0000603376.