JDIT 2015 0428 016 (PDF)
File information
This PDF 1.5 document has been generated by Microsoft® Word 2013, and has been sent on pdf-archive.com on 30/05/2017 at 00:36, from IP address 90.218.x.x.
The current document download page has been viewed 562 times.
File size: 1.05 MB (34 pages).
Privacy: public file


File preview
Journal of Diagnostic Imaging in Therapy. 2015; 2(2): 1-34
O’ Doherty
Open Medscience
Peer-Reviewed Open Access
JOURNAL OF DIAGNOSTIC IMAGING IN THERAPY
Journal homepage: www.openmedscience.com
Review Article
A review of 3D image-based dosimetry, technical considerations
and emerging perspectives in 90Y microsphere therapy
Jim O’ Doherty*
PET Imaging Centre, Division of Imaging Sciences and Biomedical Engineering, King’s College
London, King’s Health Partners, St. Thomas’ Hospital, London, United Kingdom
*Corresponding author:
Jim O’ Doherty, Ph.D.
Email: jim.odoherty@kcl.ac.uk
Abstract
Yttrium-90 radioembolization (90Y-RE) is a well-established therapy for the treatment of hepatocellular
carcinoma (HCC) and also of metastatic liver deposits from other malignancies. Nuclear Medicine and
Cath Lab diagnostic imaging takes a pivotal role in the success of the treatment, and in order to fully
exploit the efficacy of the technique and provide reliable quantitative dosimetry that are related to clinical
endpoints in the era of personalized medicine, technical challenges in imaging need to be overcome. In
this paper, the extensive literature on current 90Y-RE techniques and challenges facing it in terms of
quantification and dosimetry are reviewed, with a focus on the current generation of 3D dosimetry
techniques. Finally, new emerging techniques are reviewed which seek to overcome these challenges,
such as high-resolution imaging, novel surgical procedures and the use of other radiopharmaceuticals
for therapy and pre-therapeutic planning.
ISSN: 2057-3782 (Online)
http://dx.doi.org/10.17229/jdit.2015-0428-016
1
Journal of Diagnostic Imaging in Therapy. 2015; 2(2): 1-34
Keywords: dosimetry; molecular radiotherapy;
carcinoma
90
O’ Doherty
Y microspheres; Monte Carlo; hepatocellular
1. Introduction
The primary form of liver cancer (hepatocellular carcinoma - HCC) is the second largest contributor to
cancer mortality in the world, and is the second most common cause of death from cancer worldwide,
estimated to be responsible for 746,000 deaths in 2012 (9.1% of the total) [1]. In Europe, 63,500 new
cases of liver cancer were diagnosed in 2012 [2]. The prognosis for HCC is poor, with 5-year survival
rates (dependent on staging) in England approximately 5.5% [2] and in the United States less than 15%
[3].
The liver is also a common metastatic site for tumours in organs drained by the portal vein such as from
colorectal, pancreatic and stomach malignancies [4]. HCC and liver metastases represent different
tumour types, with more peripheral vascularization in HCC and a higher proportion of smaller lesions
in metastases [5]. Similar to primary HCC, surgical resection of metastases is usually considered the best
curative practice, although only approximately 25% of patients are eligible [6].
The liver possesses unique vascular anatomy due to its dual blood supply. Normal hepatic tissue obtains
over 70% of its blood supply from the portal vein while intrahepatic malignancies derive their blood
supply almost exclusively via the hepatic artery [7]. Using this process, intra-arterial techniques such as
radioembolisation of radioactive microspheres (RE) can selectively target the liver malignancies. RE
typically employs 90-yttrium microspheres (90Y-MS - β-emitter, t½ =64.2 hours, Eβ(av)=0.94 MeV,
average tissue penetration = 2.5 mm max. range = 1.1 cm) of which there are currently two types
commercially available; a glass microsphere (TheraSphere, BTG Inc./MDS Nordion Inc., Ottawa,
Canada) and a resin microsphere (SIRTeX Medical Ltd, Sydney, Australia) hereon denoted GMS and
RMS respectively. The properties of these MS are detailed in Table 1. Since approval of these devices,
a rapid increase in the amount of publications indicating their use has been published (see Figure 1).
Evidence has been mounting regarding the ability of a measurement of the absorbed dose to tumour to
help predict the tumour response and patient outcome, although dosimetry rarely finds routine clinical
use despite response being a key parameter in the clinic [8]. A recent review by the EANM Dosimetry
Committee identified 48 papers (out of 79 surveyed) employing the use of radionuclide dosimetry
showing a strong correlation between absorbed dose and the tumour response & toxicity over a wide
range of radionuclide treatments (including 90Y-RE) [9], and many works have noted the lack of
randomized trials comparing dosimetry-based radionuclide therapy to fixed dosing, or dosing per kg
body weight [10, 11]. For routine use, there is a requirement of standardized procedures for absorbed
dose calculations [12] and improved reliability of radiobiological models used to convert dosimetric data
to biologic endpoints [13].
ISSN: 2057-3782 (Online)
http://dx.doi.org/10.17229/jdit.2015-0428-016
2
Journal of Diagnostic Imaging in Therapy. 2015; 2(2): 1-34
O’ Doherty
90
Y-RE treatment planning should be based on a priori knowledge of the radiobiological effects to
predict the total absorbed tumour/normal liver doses (hereon denoted DT and DNL respectively) and
intended responses before or during the therapeutic intervention, as is common in brachytherapy or
external beam radiotherapy (EBRT). The principle disadvantages of patient-specific dosimetry for 90YRE centre around logistical aspects and enabling of resources/time [14].
SIR-Spheres
Radioisotope
Isotope location
β emission (MeV)
ϒ emission
Matrix material
Density (g/mL)
Av Diameter (μm)
Number of particles (range)
Bq per sphere
Embolic effect
Available activity (GBq)
Shelf life
Endpoint
TheraSphere
90
Y
Attached to surface
Incorporated into glass matrix
2.28 (100%)
None
Resin
Glass
1.6 [15]
3.2 [15]
32±10 [15]
25±10 [15]
30-60 x106 [16]
3-8 x 10⁶ [16]
50 [16]
2500 [16]
Mild-moderate
Mild
3
3, 5, 7, 10, 15, 20
24 hours
12 days
Target Activity/stasis
Target Dose
Table 1. Parameters of RMS and GMS for 90Y-RE.
Figure 1. The growth in publications related to 90Y-RE as of Jan. 1st 2015. An online publication search
http://www.ncbi.nlm.nih.gov/pubmed/ had the following search conditions: text strings “Microspheres” or
“radioembolization” to appear in Title/Abstract and “90” to appear in the Title/Abstract. The final publication list was
manually filtered for relevant publications and sorted by date.
ISSN: 2057-3782 (Online)
http://dx.doi.org/10.17229/jdit.2015-0428-016
3
Journal of Diagnostic Imaging in Therapy. 2015; 2(2): 1-34
O’ Doherty
Quantitative data acquisition procedures are complex and demanding and require significant expertise
to ensure the integrity of data, reduction of errors and reliability of the methodology. It is with this in
mind that current techniques of 90Y-RE are reviewed such as factors affecting accurate quantification,
3D-dosimetry techniques, and emerging techniques that may further help the efficacy of the technique
in providing reliable predictive clinical endpoints.
2. Current Techniques
2.1 Procedure
Implantation of 90Y-MS is typically a 2-stage process, a ‘mapping’ phase and later (usually 1-2 weeks)
an implantation phase. The mapping step is carried out using a microcatheter guided via fluoroscopy
through the common hepatic artery. Extrahepatic branches to critical organs are identified and
prophylactically embolized in order to limit the potential deposition of MS to the critical organs.
Although outside the scope of this review, the reader is referred to excellent reviews related to the
angiographic mapping procedure [17].
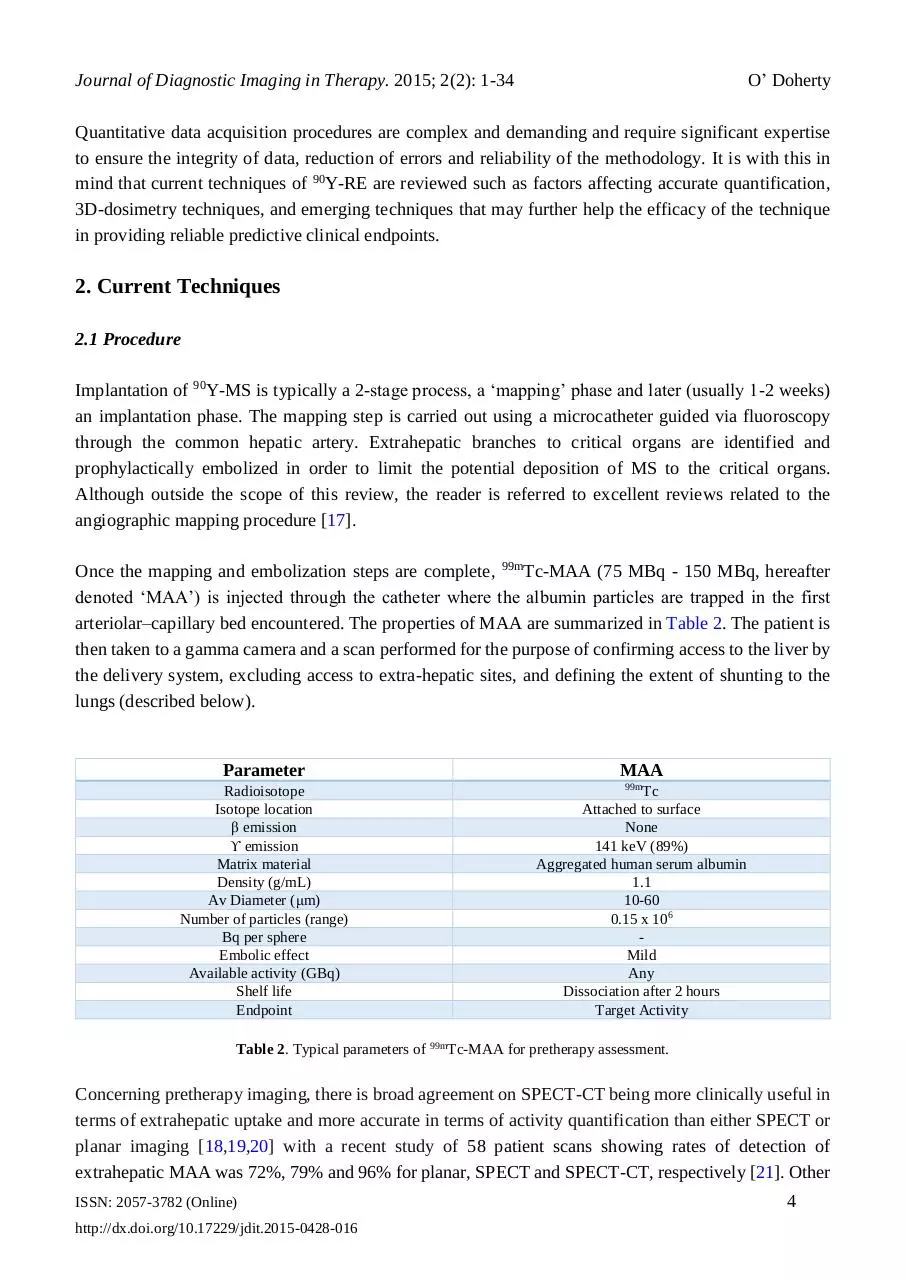
Once the mapping and embolization steps are complete, 99mTc-MAA (75 MBq - 150 MBq, hereafter
denoted ‘MAA’) is injected through the catheter where the albumin particles are trapped in the first
arteriolar–capillary bed encountered. The properties of MAA are summarized in Table 2. The patient is
then taken to a gamma camera and a scan performed for the purpose of confirming access to the liver by
the delivery system, excluding access to extra-hepatic sites, and defining the extent of shunting to the
lungs (described below).
Parameter
Radioisotope
Isotope location
β emission
ϒ emission
Matrix material
Density (g/mL)
Av Diameter (μm)
Number of particles (range)
Bq per sphere
Embolic effect
Available activity (GBq)
Shelf life
Endpoint
MAA
99m
Tc
Attached to surface
None
141 keV (89%)
Aggregated human serum albumin
1.1
10-60
0.15 x 10⁶
Mild
Any
Dissociation after 2 hours
Target Activity
Table 2. Typical parameters of 99mTc-MAA for pretherapy assessment.
Concerning pretherapy imaging, there is broad agreement on SPECT-CT being more clinically useful in
terms of extrahepatic uptake and more accurate in terms of activity quantification than either SPECT or
planar imaging [18,19,20] with a recent study of 58 patient scans showing rates of detection of
extrahepatic MAA was 72%, 79% and 96% for planar, SPECT and SPECT-CT, respectively [21]. Other
ISSN: 2057-3782 (Online)
http://dx.doi.org/10.17229/jdit.2015-0428-016
4
Journal of Diagnostic Imaging in Therapy. 2015; 2(2): 1-34
O’ Doherty
studies have identified extrahepatic uptake on SPECT-CT not discernible on planar or SPECT only,
leading to treatment adjustments such as additional surgical embolization [18,22]. Other work shows a
sensitivity of 100% of using SPECT-CT to detect extrahepatic uptake compared to 41% for nonattenuation corrected SPECT and 32% for planar imaging respectively [22]. Recently also evaluated is
the discordance between hepatic angiography and MAA SPECT, noting severe discordance in only 3 of
74 cases of patients with HCC [23].
The 90Y-MS implantation involves repeating the catheterization procedure on the treatment day. Extra
mapping may be performed to examine the viability of previously implanted embolization coils, and
further coil embolizations may be attempted as the time difference between the MAA and MS treatment
may allow for the development of arteriovenous anastamoses. 90Y-MS are then infused through the
hepatic arteries under fluoroscopic guidance, with caution paid to any reflux of spheres. The activity of
MS to be implanted is dependent on factors such as the type of spheres used, properties of the target site
(i.e. primary HCC or metastatic tumours) and the level of lung shunt determined from the MAA scan,
Typically, after the procedure is complete, the patient is again taken to a gamma camera and
Bremsstrahlung imaging performed to localize the MS.
2.2 Activity Planning
2.2.1 Resin Microspheres (RMS)
An empirical method was devised based on the intraoperative calculations from beta probes of early
clinical trials [24], providing tables of activity-dependent only on liver tumour volume. Tumour
involvement that was < 25%, 25%–50%, or > 50% of the total liver volume was treated with 2 GBq, 2.5
GBq, or 3 GBq respectively. A U.S. Consensus panel some years ago recommended discontinuation of
this method [25], as the high risk of REILD in small livers of early clinical trials using this method was
confirmed in a multicenter study [26].
In the body surface area (BAS) method, the administered activity is calculated as a function of the liver
tumour volume and the patient size by the empirical equation:
𝑽
𝑨 [𝑮𝑩𝒒] = (𝑩𝑺𝑨 [𝒎𝟐 ] − 𝟎. 𝟐) + ( 𝑽𝒕𝒖𝒎𝒐𝒓 )
(1)
𝒍𝒊𝒗𝒆𝒓
where BSA (m2) is calculated as 0.20247 × height (m)0.725 × weight (kg)0.425 . Vtumour and Vliver represent
the volumes of tumour and total liver respectively. A multiplicative factor is recommended concerning
whole lobar treatments:
𝑨[𝑮𝑩𝒒] = (𝑩𝑺𝑨 [𝒎𝟐 ] − 𝟎. 𝟐 +
ISSN: 2057-3782 (Online)
http://dx.doi.org/10.17229/jdit.2015-0428-016
𝑽𝒕𝒖𝒎𝒐𝒓
𝑽𝒍𝒐𝒃𝒆
𝑽
) × 𝑽 𝒍𝒐𝒃𝒆
𝒍𝒊𝒗𝒆𝒓
(2)
5
Journal of Diagnostic Imaging in Therapy. 2015; 2(2): 1-34
O’ Doherty
This method is the most common because of its ease of implementation, requiring only measurements
of the tumour volume and patient height and weight, and an online tool is available to aid the user in
activity calculation http://apps01.sirtex.com/smac/.
Early clinical trials with RMS noted the presence of radiation pneumonitis (RP) post-treatment [27].
Modifications to injected activity were proposed depending on the level of hepatopulmonary shunting
(LS) of MS through arteriovenous vessels bypassing the capillary bed to the lungs, as an absorbed dose
of 30 Gy to lungs (DLUNG) has been suggested to cause RP [28]. The manufacturer of SIR-Spheres and
recent guidelines recommend less than 25 Gy and preferably less than 20 Gy [29,30]. The lung shunt
fraction is calculated as LSF=lung counts/(liver counts + lung counts), and is a multiplicative
modification to the 90Y activity determined by Eqn 1 (LS<10% LSF=1; 10-15% LSF=0.8; 15-20%
LSF=0.6; >20% no treatment).
Via MIRD calculations, the target organ dose is calculated as the product of the cumulated activity in
the organ and the corresponding organ S-value [31], and the total target dose is the summation of all
source organ contributions. However the use of organ level S-values inherently assuming uniform
activity distribution in the organ, and the use of standardized anatomical models are the major limitations
to the technique. Complete reviews of the principles of organ-level MIRD dosimetry relating to 90Y-MS
are available in the literature [32].
The partition model (PM) incorporates tissue masses and a measurement of the tumour-to-normal tissue
(TN) ratio [33]. It requires separation of the organ system into compartments (normal liver, lungs and
tumour), and setting prescribed safe radiation doses whereby the maximum administered activity does
not exceed these dose limits (80 Gy to normal functioning liver [34], (70 Gy for patients with cirrhosis
[34]) and less than 25 Gy to the lungs [27]). The activity required for implantation (ATOTAL) is calculated
based on a limiting lung dose, and also for a limiting DNL:
𝑨𝑻𝑶𝑻𝑨𝑳 (𝒍𝒖𝒏𝒈) =
𝑫𝑳𝑼𝑵𝑮 ×𝑴𝑳𝑼𝑵𝑮 ×𝑳𝑺𝑭
𝑨𝑻𝑶𝑻𝑨𝑳 (𝒏𝒐𝒓𝒎𝒂𝒍 𝒍𝒊𝒗𝒆𝒓) =
(3)
𝟒𝟗𝟔𝟕𝟎
𝑫𝑵𝑳 ×(𝑴𝑳𝑰𝑽𝑬𝑹 +𝑻𝑵×𝑴𝑻𝑼𝑴𝑶𝑹 )
(4)
𝟒𝟗𝟔𝟕𝟎×(𝟏−𝑳𝑺𝑭)
where MLIVER, MLUNG, and MT represent the masses of normal liver, lungs and tumour (in g) respectively.
The TN ratio is the ratio of activity in the tumour (AT) and normal liver (ANL) per unit mass (MT and MNL
respectively) of the compartment as determined from the MAA scan:
𝑨𝑻
⁄𝑴
𝑻
𝑻𝑵 = 𝑨𝑵𝑳
⁄𝑴
𝑵𝑳
(5)
It should be noted that this is an estimate of the TN, and may not always be the same as the true TN.
ISSN: 2057-3782 (Online)
http://dx.doi.org/10.17229/jdit.2015-0428-016
6
Journal of Diagnostic Imaging in Therapy. 2015; 2(2): 1-34
O’ Doherty
2.2.2 Glass Microspheres (GMS)
The activity for administration of GMS relates directly to the desired absorbed dose based on a nominal
target dose (150 Gy/kg), and assumes a uniform distribution of microspheres throughout the liver. A
general equation for determining the activity based on 2-compartmental MIRD macrodosimetry is
written as:
𝑨𝑻𝑶𝑻𝑨𝑳 [𝑮𝑩𝒒] =
𝑫𝑻𝑨𝑹𝑮𝑬𝑻 [𝑮𝒚]×𝑴𝑻𝑨𝑹𝑮𝑬𝑻 [𝒌𝒈]
(6)
𝟒𝟗.𝟕 [𝑮𝒚∙𝒌𝒈/𝑮𝑩𝒒]
where MTARGET is the mass of the target (i.e. whole liver or liver lobe, or lungs). There are no adjustments
to the 90Y activity based on LSF; the treatment proceeds provided DLUNG <30 Gy (single treatment) and
<50 Gy (cumulative treatment). The maximum activity is calculated based on a limiting dose of 30 Gy
to the lungs taking into account the LSF:
𝑨𝑴𝑨𝑿 =
𝟑𝟎 ×𝑴𝑳𝑼𝑵𝑮
𝑳𝑺𝑭×𝟒𝟗.𝟕
(7)
From Eqn 6, the liver dose can be defined as:
𝑫𝒕𝒐𝒕𝒂𝒍 𝒍𝒊𝒗𝒆𝒓 =
𝟒𝟗.𝟕×𝑨𝑻𝑶𝑻𝑨𝑳 (𝟏−𝑳𝑺𝑭)×(𝟏−𝑹)
𝑀𝒕𝒐𝒕𝒂𝒍 𝒍𝒊𝒗𝒆𝒓
(8)
where R represents the percentage of the total activity remaining in the vial after treatment. Thus, the
absorbed dose is highly dependent on how the liver mass is calculated.
2.3 Differences between RMS and GMS
There are clear differences between GMS and RMS, and there is an ongoing debate as to whether these
differences lead to different efficacy and toxicity profiles [35,36]. Although it has been postulated that
the optimal combination of specific activity and embolic load is somewhere between that of GMS and
RMS [37], recent work shows that the overall survival of patients treated with either GMS or RMS
across different HCC stages is quite consistent [38]. A multicentre study of hepatic metastatic
neuroendocrine tumours showed a statistically significant greater median absorbed dose to liver lobes
delivered using GMS (right 117 Gy, left 108 Gy) than using RMS (right 50.8 Gy, left 44.5 Gy), although
a similar disease control rate for both (92% GMS and 94% RMS were partial responders or stable
disease) after 6 months [39]. More fundamentally, computer simulations have demonstrated the absorbed
dose deposited around a point source of resin and glass spheres shows differences of 1% to be with 1%
of each other [40].
Recent studies have shown a relatively large difference in microscopic radiobiology between GMS and
RMS behaviour, and that the lower number of GMS used for treatment provides a less uniform
ISSN: 2057-3782 (Online)
http://dx.doi.org/10.17229/jdit.2015-0428-016
7
Journal of Diagnostic Imaging in Therapy. 2015; 2(2): 1-34
O’ Doherty
irradiation, thus allowing a mean whole liver absorbed dose (DWL) of 120 Gy with no toxicity to the
radiosensitive portal triads [41,42], or 150 Gy for single treatment (268 Gy for repeat administrations)
[43]. Their results provide reasoning to the DNL threshold noted in other clinical studies of 70 Gy using
GMS [44] and approximately 40-50 Gy using RMS [13,45]. It should be noted that although no toxicity
was noted with absorbed doses of up to 100 Gy [46], the manufacturer of RMS recommends a DNL of
80 Gy and a recent summary suggests a preferable DNL of 50 Gy [29]. Toxicity of either GMS or RMS
is not only dependent on the dose volume factors, but also on the patient population, underlying liver
disease, liver function and concurrent therapies [47].
Stasis represents the main reason for stopping the delivery of RMS before full planned activity is given
due to the high number of spheres (20 million/GBq), and is not desired in part because of shunting into
normal liver causing tumour hypoxia [26]. Due to the lower number of GMS typically encountered
(400,000/GBq), stasis and embolic effects have yet to be reported [28]. Therefore because of the
mechanics of sphere deposition, a higher injected activity may not always lead to a higher DT. In a recent
editorial, it was noted that the specific activity and number of spheres per GBq should be considered a
crucial variable and thus reported in clinical trials [48].
3. Current issues in 90Y therapy
3.1 Assaying the Activity
Error in assaying the activity against the manufacturer determined activity creates further errors in
absorbed dose calculations. Although this verification is a fundamental requirement on which all
quantitative measurements are made, measurement of vial activity of 90Y-MS remains an important issue
due to lack of standardization in measurements [49,50]. Due to Bremsstrahlung production, the activity
measurements made in a dose calibrator vary with sample geometry, vial placement within the calibrator,
vial thickness and solution volume. RMS activity can also vary widely when in a settled state compared
to suspended state (distributed homogenously) in the vial. For example, a 20% difference was noted in
MS activity dependent on the material of the V-vial compared to shipping vial [50]. One study noticed
a 2-16% variance of the MS activity when compared to a reference source between 5 sites participating
in a multicentre study employing RMS [26]. Owing to these factors, a total dose delivery error on the
order of 20% is noted as possible [49].
There are also no current traceable standards in the UK, or USA for RMS, although there is a NIST
traceable calibration for GMS. Correction factors can be employed although this is not trivial process
[51]. It is recommended to characterize the local activity measurement standard rather than accepting
the calibration value of the calibrator manufacturer [50]. A previous work investigated a spectroscopic
assay of the 90Y positron decay of resin spheres measuring an activity 26% higher than manufacturer
indicated [52].
ISSN: 2057-3782 (Online)
http://dx.doi.org/10.17229/jdit.2015-0428-016
8
Journal of Diagnostic Imaging in Therapy. 2015; 2(2): 1-34
O’ Doherty
A dedicated work package of the ongoing European project MetroMRT (METROlogy for Molecular
RadioTherapy) is aiming to provide traceable dosimetry standards for 90Y-RE procedures, and is
described further below.
3.2 Limitations of current dosimetry models
Recent work has noted that there is no known association correlating a patient’s BSA with liver volume,
tumour volume or radiation sensitivity [53]. Inherent in the BSA method is the assumption of a fixed
mean TN liver ratio of 1 for all patients, sacrificing accuracy for simplicity, although patients typically
present with a more favourable ratio [19]. A recent retrospective study of 45 patients with liver
metastases treated by RMS showed that using Eqn. 1, the administered activity does not correlate with
DWL [54], with a 2.5 fold difference in DWL over all patients. They did, however, find a correlation
between liver weight and DWL, noting that patients with large livers are relatively under-dosed, and
patients with smaller livers are overdosed using this technique.
A recent study compared activity planning and dosimetry in 26 patients with RMS using 4 models (BSA,
empirical and PM) showing that maximum differences in injected activities between BSA and PM
methods vary from 123%-417% [55]. Although it has been noted that the PM would be the preferred
method of 90Y-RE for every patient [55,56], its main drawbacks are the reliance on segmentation of
tumour/non-tumour for activity determination and dosimetry purposes, and the assumption of
concordance between the MAA (from which the TN ratio is calculated) and MS distribution. This
assumed equivalency is a fact much disputed by recent studies, especially in liver metastases [57,58] and
is described further below. In clinical scenarios, the PM and GMS equations are employed mainly in
patients with hypervascular, large and numerically limited lesions, such as HCC.
In many metastatic cases, clear definition of the tumour boundaries proves difficult due to diffuse
metastatic spread and differing vascularity [5], and therefore the PM proves difficult to apply. Recent
work shows it cannot be recommended in general for patients with liver metastases [57,59]. This model
also disregards the spatial and temporal variation of the dose, dose rate and radiobiological effects,
providing a simplified picture for patient dosimetry [60].
3.3 Determination of lung shunt fraction (LSF)
Dissociation of 99mTc-MAA into free pertechnetate (99mTcO4-) has been known to change the patient
LSF classification and also degrade the image quality [61]. Clinical reporting issues also exist relating
to dissociation; in a recent study, uptake in the stomach could not be attributed either to pertechnetate or
true MAA uptake [61]. In certain clinics, patients undergoing RMS treatment are pre-treated with sodium
perchlorate before angiography, which aids in preventing unspecific uptake of MAA in the stomach and
thyroid [22,62].
ISSN: 2057-3782 (Online)
http://dx.doi.org/10.17229/jdit.2015-0428-016
9
Download JDIT-2015-0428-016
JDIT-2015-0428-016.pdf (PDF, 1.05 MB)
Download PDF
Share this file on social networks
Link to this page
Permanent link
Use the permanent link to the download page to share your document on Facebook, Twitter, LinkedIn, or directly with a contact by e-Mail, Messenger, Whatsapp, Line..
Short link
Use the short link to share your document on Twitter or by text message (SMS)
HTML Code
Copy the following HTML code to share your document on a Website or Blog
QR Code to this page

This file has been shared publicly by a user of PDF Archive.
Document ID: 0000603706.