Millennial Money Report Digital (1) (PDF)
File information
This PDF 1.5 document has been generated by Adobe InDesign CC 2017 (Macintosh) / Adobe PDF Library 15.0, and has been sent on pdf-archive.com on 27/06/2017 at 04:24, from IP address 24.186.x.x.
The current document download page has been viewed 465 times.
File size: 2.13 MB (17 pages).
Privacy: public file

File preview
VESTED RESEARCH SERIES
2017
MILLENNIALS AND MONEY
Why these whiners are ignoring your marketing campaigns
Millennial
MONEY
STUDY
Visit http://fullyvested.com/millennial-study for a digital copy of this report
INSIDE:
01
WHY MILLENNIALS STILL LOVE
BRICK & MORTAR BANKS
02
THE MOST POPULAR
FINTECH APPS OF 2017
03
WHY MILLENNIALS CARE ABOUT DATA
SECURITY BUT NOT DATA PRIVACY
04
TRUST IN THE TRUMP ECONOMY
05
WHO’S AFRAID OF THE FINANCIAL
CRISIS? MILLENNIALS 10 YEARS ON
06
WELLS FAR-TO-GO: MILLENNIALS
& FINANCIAL SCANDALS
VES TED RESE ARCH SERIES
VES TED RESE ARCH SERIES
M I L L E N N I A L M O N E Y S T U DY
Millennials
and money
Why these whiners are ignoring
your marketing campaigns
For those who practice the dark arts of
marketing, April 2017 marked a demographic turning point. For the first time,
by sheer numbers, Millennials eclipsed
their generational counterparts, Baby
Boomers and Gen Xer’s. Since then, we’ve
been inundated with all manner of stories
attempting to own the Millennial beat. To
a great extent, however, the narrative has
been anecdotal, imprecise, and often flat out wrong.
Where earning, investing, career, and
economic outlook are concerned, are they
risk-takers or risk-averse? Are they more
trusting of innovation and, perhaps, less
open to institutions? Are they bullish or
bearish about the next five years? And, in
regards to the current political climate,
does this Trump moment portend an impending change in their behavior?
Before embarking on this study we wanted
to answer a broad, expansive question,
given a financial lens:
WHAT IS A
MILLENNIAL?
80s-90s
babies
DIGITAL
native
A.K.A.
generation Y
When we parse this population across gender, income, race/ethnicity, educational background, and geography, is there a meaningful difference where trust, awareness, use, and adoption of
banking products are concerned?
Spoilers: We wouldn’t raise the question if it weren’t the case at
least some of the time. So, YES. In many cases, women and men
have vastly different relationships to money, decision-making,
perspectives about innovation, what, and who they trust. The
same can be said for different income levels: the aspirational
and the affluent oftentimes have radically different outlooks
and behaviors where banks and products are concerned.
Of course, any generational cohort that is so unwieldy in size
contains a multitude of opinions and approaches—in fact,
Millennials are now the largest living generation, according to
Pew. In this survey, we show that there are substantive differences between the mindsets of the youngest (20–24) and oldest
(30–35) Millennials.
While much has been written about this of late (C.f. Jesse
Singal’s recent New York Magazine article on self-identifying as
an “Old Millennial”), it is also at play with regard to financial attitudes and behaviors. Understanding, for example, that women
are far less trusting of Trump or that men and the affluent are
far more influenced by their social media networks, informs how
we design and market products and whether we succeed or fail
in reaching this population.
We hope that our findings will jump start a conversation on
how fintech products can best be deployed. In some cases,
our findings reinforce general findings about Millennials (for
example, they do seem to change jobs often), but in other cases,
where personal service IRL (in real life) is concerned, they are as
traditional as Baby Boomers. In some cases, more so.
Need more convincing that lumping all Millennials together is a
business mistake for marketers? Here’s a perfect example: One
would think that this cohort is all in for cloud banking, but you’d
be making a grave mistake. More than half (59%!) are currently
not open to moving from traditional branch banking to “cloud
banking.” That’s leaving lot of money on the table.
While even Gen X’ers place a lot of emphasis on data privacy
(avoiding a product like Venmo because of social sharing), they
have a far more sophisticated take on their data health (rejecting a product because it’s been hacked like a Hotmail account).
In fact, we found that data hygiene is Millennials’ #1 criteria for
selecting a banking product.
In this study we will look closely at legacy banking versus its
online counterpart. We’ll take the pulse of conventional products (cash, debit, and credit cards) and look closely at a range
of innovative products including Venmo, Mint, Square, Stash,
and PayPal. We’ll share our findings about the decision-making
process that goes into product discovery and adoption, explain
Millennial loyalty to branch banking, and offer guidance on how
to reach this cohort with greater success:
• How might we move over half of all Millennials into the cloud
banking space?
• Given that 1 in 5 Millennials is moving to the sidelines where
the stock market is concerned in the age of Trump, what offerings
might otherwise capture their interest?
This crucible of fintech is a test for financial marketers, but also
an incredible opportunity. The outlook, behavior, and needs of
Millennials combined with the agility and granularity of technology demands new approaches. Our findings are actionable, and
we look forward to discourse and debate over implementation
and interpretation of strategy.
Are Millennials really so different than
their Boomer and X’er counterparts?
Given that even the oldest Millennial is a
Digital Native—potentially more connected than any prior generation in history—
how does this inform their financial lives?
What is their relationship to money? Their
relationship to earning and saving? To
legacy and innovative banking products?
Do they prefer “cloud banking” (banks
without physical branches or ATM’s) to
“terra banks” (brick and m ortar ? ltraditional branches)?
1
MILLENNIALS ARE NOW
THE LARGEST LIVING
GENERATION.
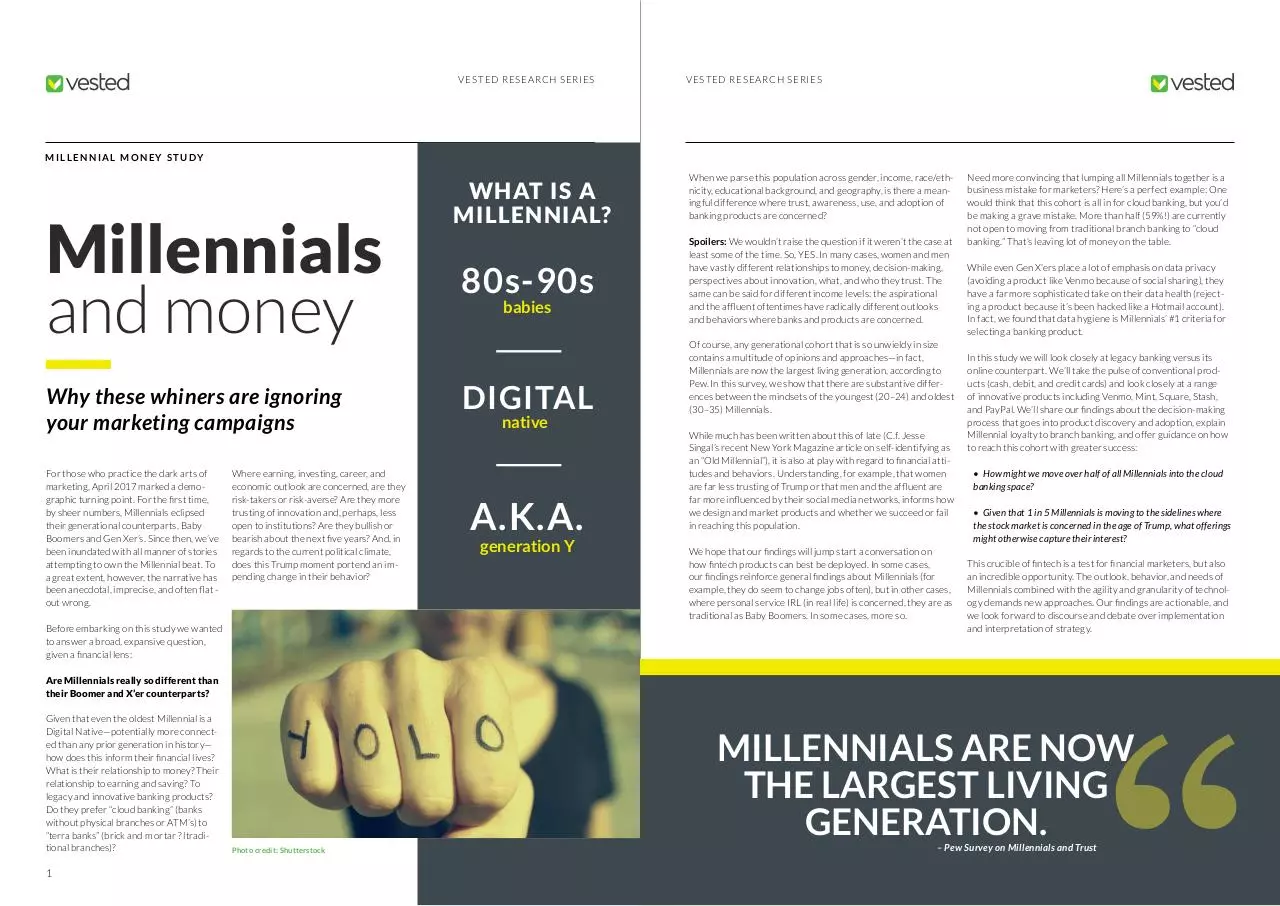
Photo credit: Shutterstock
– Pew Survey on Millennials and Trust
2
VES TED RESE ARCH SERIES
VES TED RESE ARCH SERIES
M I L L E N N I A L M O N E Y S T U DY
Our frame
Before we parsed attitudes about products, we
first wanted to index trust.
What do Millennials think of
financial institutions compared to their outlook on the
media, technology companies, and the government?
How does this trust—or
skepticism—then inform their
decision-making process
where financial products are
concerned?
While it is striking that this
generation does not innately
trust their peers, our findings
were much “healthier” than
recent studies by outlets
such as Pew. What is interesting is that while big banks
are among the least trusted
of institutions among this
cohort, “big tech” is the most
trusted—despite the chronic
hacks and privacy blunders
that have assaulted us all at
one point in time or another.
3
This seems to inform how
Square, Stash, Venmo, and
other products have been
marketed as “tech products”,
rather than bank products.
We suspect, then, that trust
in technology—as opposed
to banking—is a driving force
behind the explosive success
of a range of fintech products.
Influence
Social proof is a recent phenomenon where we can measure the influence of social
networks on decision-making
and behavior. We learned
that the more money Millennials made, the more that
they were influenced by their
social networks to choose
banking products. Also,
men overall were far more
likely—almost twice so—to be
influenced by their networks
as women.
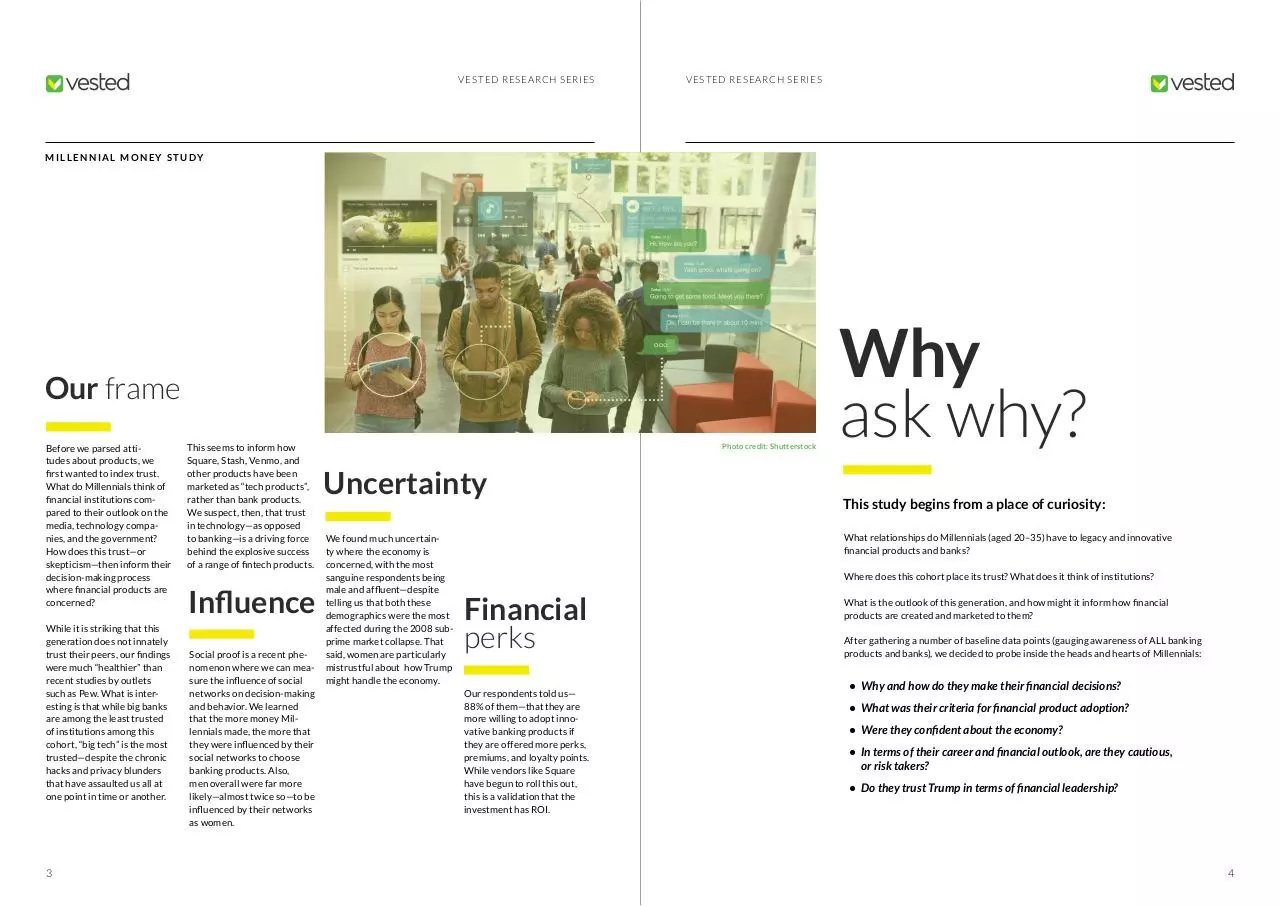
Photo credit: Shutterstock
Uncertainty
We found much uncertainty where the economy is
concerned, with the most
sanguine respondents being
male and affluent—despite
telling us that both these
demographics were the most
affected during the 2008 subprime market collapse. That
said, women are particularly
mistrustful about how Trump
might handle the economy.
Why
ask why?
This study begins from a place of curiosity:
What relationships do Millennials (aged 20–35) have to legacy and innovative
financial products and banks?
Where does this cohort place its trust? What does it think of institutions?
Financial
perks
Our respondents told us—
88% of them—that they are
more willing to adopt innovative banking products if
they are offered more perks,
premiums, and loyalty points.
While vendors like Square
have begun to roll this out,
this is a validation that the
investment has ROI.
What is the outlook of this generation, and how might it inform how financial
products are created and marketed to them?
After gathering a number of baseline data points (gauging awareness of ALL banking
products and banks), we decided to probe inside the heads and hearts of Millennials:
• Why and how do they make their financial decisions?
• What was their criteria for financial product adoption?
• Were they confident about the economy?
• In terms of their career and financial outlook, are they cautious,
or risk takers?
• Do they trust Trump in terms of financial leadership?
4
VES TED RESE ARCH SERIES
VES TED RESE ARCH SERIES
M I L L E N N I A L M O N E Y S T U DY
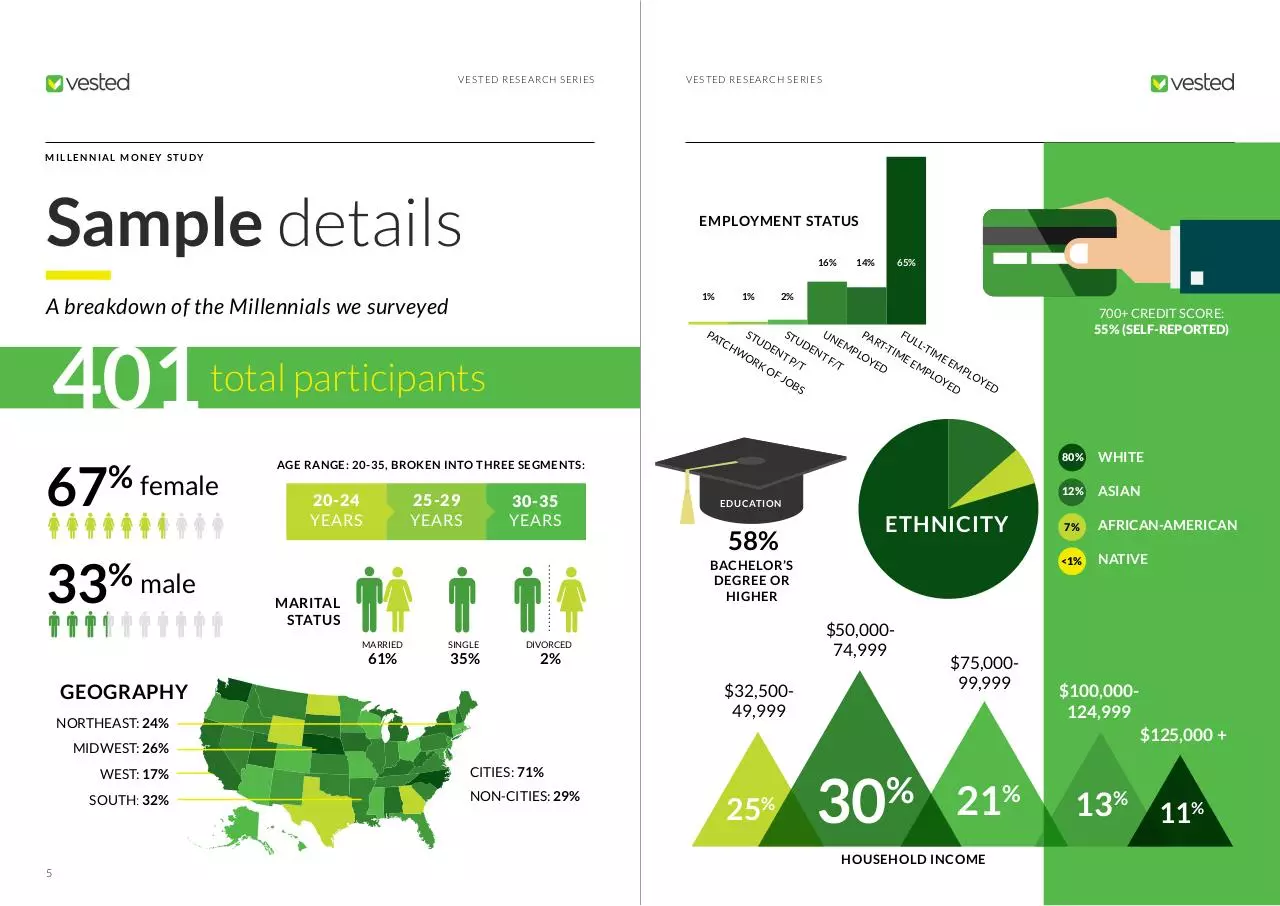
Sample details
EMPLOYMENT STATUS
16%
1%
A breakdown of the Millennials we surveyed
401
67
33
% male
65%
2%
AGE RANGE: 20-35, BROKEN INTO THREE SEGMENTS:
20-24
YEARS
25-29
YEARS
30-35
YEARS
MARITAL
STATUS
MARRIED
SINGLE
DIVORCED
61%
35%
2%
58%
ETHNICITY
$50,00074,999
$75,00099,999
12%
ASIAN
7%
AFRICAN-AMERICAN
NATIVE
$100,000124,999
$125,000 +
MIDWEST: 26%
SOUTH: 32%
WHITE
<1%
$32,50049,999
NORTHEAST: 24%
80%
EDUCATION
BACHELOR’S
DEGREE OR
HIGHER
GEOGRAPHY
WEST: 17%
700+ CREDIT SCORE:
55% (SELF-REPORTED)
PA
ST
ST
UN
PA
FU
UD
UD
TC
RT
LLEM
HW
TIM
T
EN
EN
P
I
M
L
TP
TF
OY
OR
EE
E
EM
/T
/T
ED
KO
MP
P
LO
FJ
LO
YE
OB
YE
D
D
S
total participants
% female
1%
14%
CITIES: 71%
NON-CITIES: 29%
25
%
30
%
21%
13% 11%
HOUSEHOLD INCOME
5
6
VES TED RESE ARCH SERIES
M I L L E N N I A L M O N E Y S T U DY
Survey says...
Photo credit: Shutterstock
To sum up, older Millennials, the more affluent, and males reported that they were
much more affected by 2008 than their
counterparts.
Initially, we tested the awareness of the
2008 FINANCIAL CRISIS as well as the
degree to which study participants were
personally impacted.
Breaking it down further according to:
We then asked our respondents if they
had closely followed the still unravelling
Wells Fargo kerfuffle. Finally, we queried
our participants to offer a forecast for the
economy.
This is where the age differences within
our cohort are telling; a logical explanation
concerns the 2008 ages of the “younger”
• Those who were seriously affected were
and “older” Millennials in question. In
represented by 14% of 30–35’s.
2008, our 22 year olds were 13 years old,
barely aware of the financial world, but
Income
perhaps covetous of their mother’s shiny
• High earners, at $100K+ and above,
were more likely to have been somewhat or new iPhone. Whereas, a 34 year old was
then 25 years old and new to the job marseriously affected—at 41%.
ket, when the Great Recession occurred.
• Of the most affluent income bracket,
33% of the $125,000+’s told us that they
UNAFFECTED
SOMEWHAT
had been seriously affected by this event.
OR SERIOUSLY
WHO’S AFRAID OF A BUBBLE?
Q: Were You Affected By the
2008 Banking Crisis?
Millennials—despite their relative youth
—were indeed affected by the 2008
subprime loan banking crisis, particularly
those who are older and more affluent.
They also tended to be disproportionately
male.
Topline: In broad strokes, 71% of our
survey said that they were not affected,
or inconvenienced at a minimum, by the
event. In turn, 29% of our respondents
were seriously or somewhat affected by
2008.Parsing overall categories:
• 11% said they had been seriously
affected.
• 29% “somewhat + serious” combined
• 44% were unaffected
• 27% were affected at a minimum.
7
Age
• Those who indicated—at 63%—that
they were completely unaffected were the
youngest slice of the cohort: 20–24’s.
48%
AFFECTED
Gender
• 44% of men told us that they had been
somewhat or seriously affected, as compared to 22% of women.
44%
While the subprime debacle was nearly
ten years ago, and thus was less likely to
affect younger Millennials, Wells Fargo is
just months behind us.
Topline: Overall, 70% heard of the event.
Recognition increased with age, from a
plurality of 59% to 66% to 74% across our
three age segments.
Generally, the more the affluent, the more
participants were aware. This ranged from
a low of 65% among the aspirationals to
80% among the highest earners.
expect another financial crisis—not just
a bear market—43% were unsure, while
23% are bullish about a robust economy.
It appears that this uncertainty does bear
tracking, particularly among women, the
youngest segment of Millennials, the most
affluent, and those living outside cities.
Gender: Women were significantly more
uncertain about the economy: 49% vs.
32% of men. Men were more than twice
as likely to be confident in the ongoing
strength of our economy (36% vs. 17%).
That is, despite being burnt in 2008.
Income: At the upper edges of the income
brackets—above $100K—43% of respondents believed the economy was in for a
world of hurt (vs. 33% overall).
Age: Uncertainty about the economy was
most present among the youngest slice of
the cohort, those aged 20–24 (at 53% vs.
43%).
Geographical: Uncertainty about the
economy is present in 61% of those who
are non-city dwellers vs. just 36% of city
dwellers.
How do these events and personal outlooks affect where the Millennials place
their trust?
We asked.
NON-CITY
DWELLERS
Gender made no difference in awareness.
38%
• In the most dire of categories, 24% of
men said that they had been seriously
affected, as compared to 5% of women.
• 48% of women indicated that they were
unaffected as compared to 38% of men.
Q: Have you heard of the Wells Q: Do you expect another
Fargo scandal, where bank
financial crisis in the next five
employees were registering
years?
customers for additional
products without their consent? Our participants were split. While 33%
SERIOUSLY
AFFECTED
22%
24%
Given the events of 2008 and 2016,
we then decided to gauge our survey’s
confidence in the economy over the next
five years:
5%
MEN
Finally, city dwellers were slightly more
aware of the imbroglio than their counterparts, at 73% v. 61%.
WOMEN
CITY
DWELLERS
36%
61%
WHICH MILLENNIALS FEEL UNCERTAIN
ABOUT THE ECONOMY?
8
VES TED RESE ARCH SERIES
M I L L E N N I A L M O N E Y S T U DY
Photo credit: Shutterstock
Trust in fellow man
Trust in institutions
Rationale: We were interested in finding
a trust baseline for this generation—a
prism with which to access their perspective, before extrapolating a look
at trust in institutions and loyalty to
financial products and brands.
Q: Which institutions do you
trust the most?
We asked participants to select which
statement most closely reflected their
point of view:
• Most people can be trusted
• You can’t be too careful when dealing
with people
Turns out, 43% showed themselves to
be innately trusting. However, 57% are
cautious, following the motto: “trust but
verify.”
The result of this survey question is in contrast with a Pew study on Millennials and
trust from 2014, which was consequently
written up by the Washington Post. This
study had the benefit of comparing Millennials with Generation Xers and Young
Baby Boomers. Also looking at 2008,
among other benchmarks, their Millennials
were markedly less trusting than their
counterparts.
The authors of the study theorized that
(growing) economic inequality informs
a less trusting disposition among Millennials, which can certainly inform how
we analyze attitudes and behaviors of
those in our survey who are female, less
educated, have less earning power, and are
non-white (in short, those more likely to
experience wealth inequality).
One point raised by Eric Uslaner, the
primary investigator of the Pew study,
is that “there is no relationship between
• The younger the millennial, the less
trusting: 20–24: 35%; 25–29: 37%; 30–35: internet use and trust.” He believes that
he’s proven this; however his premise that
49% (so much for young and naive).
“most of our interactions on the internet
are with people we know” is incorrect. This
• We also recorded that as income rises,
discounts the existence and frequency of
default trust follows, from 34% to 61%.
the “weak ties” we encounter across our
social networks. Depending if one is ha• Millennial males are noticeably more
rassed or supported, trust can be affected
trusting than women, showing a nearly
by internet experiences.
twenty point gap, 58% vs. 36%
Circling back to the Four-Year forecast, we
can speculate that distrust might inform
the lack of confidence that younger Millennials and women have in the economy,
but affluent Millennials do not. These high
earners were bearish about the economy,
yet the most trusting across income levels.
WHICH MILLENNIALS ARE
TRUSTING OF OTHERS?
43%
INNATELY TRUSTING
MILLENNIALS
Let’s break this down:
9
57%
TRUSTING, BUT CAUTIOUS
MILLENNIALS
While big banks, the government, and the
press are out of the public’s good graces,
(despite frequent hacks across all browsers and operating systems), Millennials
can’t quit “Big Tech” (definition of the
latter: companies like Apple, Amazon,
Facebook, and Google).
• Among the four institutions we queried,
Big Tech was the most trusted at 34%.
Whites trusted Big Tech significantly more
than non-whites: 37% v 22%.
• The government is the next most trusted
at 25%. Among 25–29’s, trust in the
government fell to 16%, significantly less
than either their younger or older peers.
The most affluent in our survey trusted the
Federal government at 18%, versus 25%
overall.
• The press is only trusted by 21% of those
polled.
• Coming in at last is the Big Banks at
20%.
Given the state of our Federal Government—at time of publication, early in the
Trump term—it’s eye-popping that the Big
Banks remain this unpopular.
Q: What institutions do you
trust the least?
• The press and the government are in a
tie for least trusted at 34%, with 41% of
our youngest Millennials distrusting the
press. While distrust in media waned with
income, wages were otherwise unrelated
where other institutions were concerned.
• Big Banks are only trusted by 24% of
those surveyed.
WHICH MILLENNIALS TRUST
BIG TECH COMPANIES?
• Big Tech is only found to be “least trustworthy” by 8% of our sample.
While these findings are in line with
Edelman’s annual survey on trust across
major industries, our results were starker.
It might be comparing apples and oranges, but they pegged trust in “financial
services” lower than any other industry
in their sample—at 54%, compared to our
21% that said, “our sample held Tech, Gov,
and Media in far lower esteem than Edelman’s general population survey.”
We’ve now garnered a sense of what our
survey participants know about the financial world as well as their trust and confidence in their peers and in institutions.
37%
WHITE
MILLENNIALS
22%
NON-WHITE
MILLENNIALS
10
VES TED RESE ARCH SERIES
M I L L E N N I A L M O N E Y S T U DY
WHICH
PAYMENT
PRODUCTS DO
YOU USE THE
MOST?
Products:
a deep dive
Interrogating product awareness and
choices exposed some interesting distinctions in the attitudes and perspectives
regarding the importance participants
attached to concepts such as “innovation,”
as well as “data hygiene” and “data privacy.” We looked at financial products from a
myriad of perspectives using the following
questions:
• Which financial products are you
aware of?
• Which have you used?
• Which do you use the most?
We then took a deep dive into each of the
financial products. Let’s first begin with
awareness.
While we’ve compared innovative banking
products against one another, here we
also look across all categories—including
debit, credit, and cash:
Q: Which products do you use
the most?
DEBIT
38%
CREDIT
PAYPAL
34%
19%
Parsing these:
• 32%: Ease of use
• 19%: Convenience (we presume that this
meant “easily accessible” to our respondents)
• 16%: Rewards: 10% + 6% (points +
cashback)
• 9%: Safe/secure
• Debit cards are used by 38% of our
sample. Debit card usage falls with age and
wage. Significantly fewer men use debit
more than women: 26% vs. 44%.
• 8%: Ubiquitous. Product is accepted
everywhere
• 7%: Product is “cool”
• How frequently?
• Why would you, or would you not,
choose a product?
• If given the option, which product would
you choose to use the most?
• While word of mouth has always been
important, how much influence does social
media have?
• Overall, credit cards are favored by 34%
of our respondents. The popularity of credit is inverse to debit. Credit cards usage
grows with age and income.
• PayPal is surprisingly strong at 19%.
Those who favor PayPal skews younger
(20–24) more affluent, and male.
Q: Why do you use this
payment method the most?
•5%: Fast/quick
•5%: Online
•5%: Link to bank
•5%: Track monies
•3%: Always available
•2%: Budgeting
• Can Millennials be incentivized to try
something new (such as tipping with
Square), or are they too savvy to be manipulated?
Our participants provided a range of basic
reasons.
•1%: Builds credit
•1%: Do not carry cash
* a dozen other reasons
11
Photo credit: Shutterstock
12
VES TED RESE ARCH SERIES
73%
WHICH MILLENNIALS LIKE CREDIT
CARD PERKS AND REWARDS?
57%
M I L L E N N I A L M O N E Y S T U DY
Photo credit: Shutterstock
Hack, not track
Plastic fantastic
Q: What criteria is most
important when selecting a
banking product?
Before we move into looking at innovative
banking products, we wanted to first capture the state of play in credit cards, since
they remain a top preference as a payment
option.
• Visa: 3%
Although 28% of our sample preferred
to use credit cards, we drilled down to
find out which banks occupy the greatest
mindshare and why a particular card was
chosen.
• Fidelity/Barclays: all under 1%
At 32%, data safety—or data hygiene—is
the #1 reason Millennials gave for choosing a banking product. What is noteworthy
is that data privacy is generally twinned
with data safety. Here privacy is almost
dead last as a rationale, at 8%.
The 20–24 segment of our Millennials
were most concerned about data hygiene
(12%), as were the less affluent (12%), and
women (9%).
Who is privacy important to? The less
affluent (12%) and younger Millennials
(12%) vs. the well-to-do, until we arrive
at highest income threshold where there
is an uptick in concern for data privacy at
13%. [While it’s been reported that Americans don’t care about their data safety is
concerned, this group does. Pointedly.]
• Convenience at 26% occupies the second
pole position. Those at the $100K–
$124,999 income level attach the greatest
importance, at 37%.
• At 19%, reputation is a factor in decision
making.
• Transfer time of funds comes in at 9%.
Quick access to monies is most important
to men (14%) and highest earners (15%).
[This is counterintuitive. We’d expect the
lower income brackets to prioritize this,
but this isn’t so.]
• Credit and Men: Men prefer credit to
debit (39% to 26%).
• Innovation in a product has bearing —
but far less so among women.
• Cash—favored by 12% of our participants—slightly declines with older millennial survey participants.
• Debit and Women: Women have the
opposite relationship with debit cards—
preferring them to credit (33% vs. 17%).
This might show that Millennials expect
that every new product implies innovation,
• It is surprising how unpopular Square
and that the term is met with skepticism,
is for this question—it polls less popularly
but it also speaks to a sizable percentage
than remittances, checks and even Bitcoin!
of Millennials who might be classed as
(6 people would use Bitcoin as compared 1
“young fogies.” (Note: We’ve read that
respondent.)
with this generation coming up during
9/11 and the subprime crisis, they are inNote: Venmo wasn’t in the mix for some
vesting in the stock market with too much reason.
caution—as if they were 70+ year olds.)
Q: If given the choice, which
payment option do you prefer?
• Debit, credit cards, and PayPal are almost equally preferred (28%/28%/29%).
Q: Which credit cards do you
use most often?
• Chase dominates: The aggregates of its
various products reaches 35%+.
• Chase Freedom is used most often of
each type at 20%.
• Capital One: 25% (combining its Platinum + Secured MasterCard)
• Other MasterCard: 1%
Note: 17% of those surveyed don’t use
any credit cards.
Q: Why do you use this credit
card most often?
• 67% of those surveyed told us they use
their credit card most often because of
rewards and perks. Women find rewards
even more compelling (73%) than men
(57%). Rewards become more important as
income rises (64%—0%).
Speaking of credit card scores, just as
we’ve tried to gauge our sample’s outlook,
later on, we’ll look at their financial fitness:
Student loan debt, credit scores, and balance repayment behavior.
Having developed a context for legacy
banking products, let’s focus on innovative banking products.
• Easy sign-up is important to 48% of our
sample. Apparently, getting this transaction right carries dividends.
• Citi: 5%
• Bank of America: 2%
• PayPal grows in favor as income rises,
from a low of 15% to a high of 37%.
It is also much more favored among men
(40% vs. 23%).
• Wells Fargo: 1%
To speculate, perhaps this is because high
earners tend to use credit cards more
frequently than debit cards, and so credit
scores have greater relevance to these
users.
• Interest rates are important to only
28% of our poll. The importance of rates
increases with age (20%—30%).
• Discover: 5%
• First Premier: 5%
• Ink Business: 3%
• Free credit card score check (which is
free to all) is a dealmaker to 25% of our
study. This is even more important for
higher incomes (37% and 39% for the
$100K and $125K brackets, respectively).
• American Express: 3%
13
14
VES TED RESE ARCH SERIES
M I L L E N N I A L M O N E Y S T U DY
Photo credit: Shutterstock
14%
• Square is a distant second when it comes
to past usage. While 28% of participants
had used the service, usage is gendered— a
32% of women have used Square, while
just 19% of men had.
• Venmo has been used by 21% of respondents.
• Chase QuickPay has been used by 20%
of our sample.
We’re now ready to take a closer look
at each innovative banking product, and
following that, banks themselves.
At the outset, we queried product awareness and asked after usage. Finally, we
asked our respondents to tell us which
products they had used.
93%
Based on this, for each innovative banking
product we drilled down to three questions:
1. How did you discover X?
2. Was it easy to use X (“How did it make
you feel”)?
3. Why did you use X?
• Likewise, 20% of our study have tried
Mint. (30% of our most affluent respondents)
MINT
54%
• PayPal leaves all other products in the
dust, with 93% of respondents signaling
that they had used it. In no category—
across age segment, income, or gender—
did it reach less than 90%.
• While Stash had only been used by 4%
of the sample, we discovered that it was
most appealing to highest income bracket
($125k+) at 13%.
20% 20%
STASH
PAYPAL
49%
52%
61%
STASH
• Household name Chase comes in third
with their QuickPay, known to 54% of this
sample. As with Mint below, its strongest
appeal is with 25–29’s. (Chase QuickPay
was known to more non-whites than the
overall sample: 65% vs. 54%.)
MINT
• Square’s awareness at 61% takes second
pole position and is particularly strong at
the highest income level where 74% know
the brand.
100%
SQUARE
• We polled participants on their awareness across the category of “innovative
banking products” — excepting credit,
debit, cash, and check.
CHASE QUICKPAY
Rewards are important; respondents told
us that perks and loyalty solutions could
persuade them to try new products like
Venmo.
• Stash clocked in at 14%. While all other
products have relatively similar appeal to
both genders, investment-vehicle Stash
lags with women. It’s known to 20% of
men, but just 12% of women.
VENMO
At 99%, PayPal is as ubiquitous to this cohort as cash once was, and credit/debit is.
Name recognition is 100% among above
$100K earners.
Note: the highest users of Mint and Stash
are the most affluent in our sample.
PAYPAL
Q: Which of the following
(innovative banking) products
have you used?
• Mint was familiar to 49% of our survey.
Mint’s strongest appeal is at $100K
earners and above, with 59% of 25–29’er
Millennials vs. 49% overall.
SQUARE
Q: Which of the following
products have you heard of?
VENMO
Usage
CHASE QUICKPAY
Awareness
28%
21%
4%
MILLENNIAL FAMILIARITY WITH
PAYMENTS PRODUCTS
15
MILLENNIAL USE OF
PAYMENTS PRODUCTS
16
Download Millennial Money Report Digital (1)
Millennial Money Report Digital (1).pdf (PDF, 2.13 MB)
Download PDF
Share this file on social networks
Link to this page
Permanent link
Use the permanent link to the download page to share your document on Facebook, Twitter, LinkedIn, or directly with a contact by e-Mail, Messenger, Whatsapp, Line..
Short link
Use the short link to share your document on Twitter or by text message (SMS)
HTML Code
Copy the following HTML code to share your document on a Website or Blog
QR Code to this page

This file has been shared publicly by a user of PDF Archive.
Document ID: 0000617170.