Rè¯è¨€é‡‘èžæ·±åº¦å¦ä¹ (PDF)
File information
This PDF 1.5 document has been generated by LaTeX with hyperref package / pdfTeX-1.40.14, and has been sent on pdf-archive.com on 31/07/2017 at 03:40, from IP address 221.192.x.x.
The current document download page has been viewed 1418 times.
File size: 388.93 KB (6 pages).
Privacy: public file


File preview
1. R语言金融深度学习
李智
Q群261821669,本篇数据下载
July 31, 2017
Chapter 1
深度学习
1.1
Deep Learning
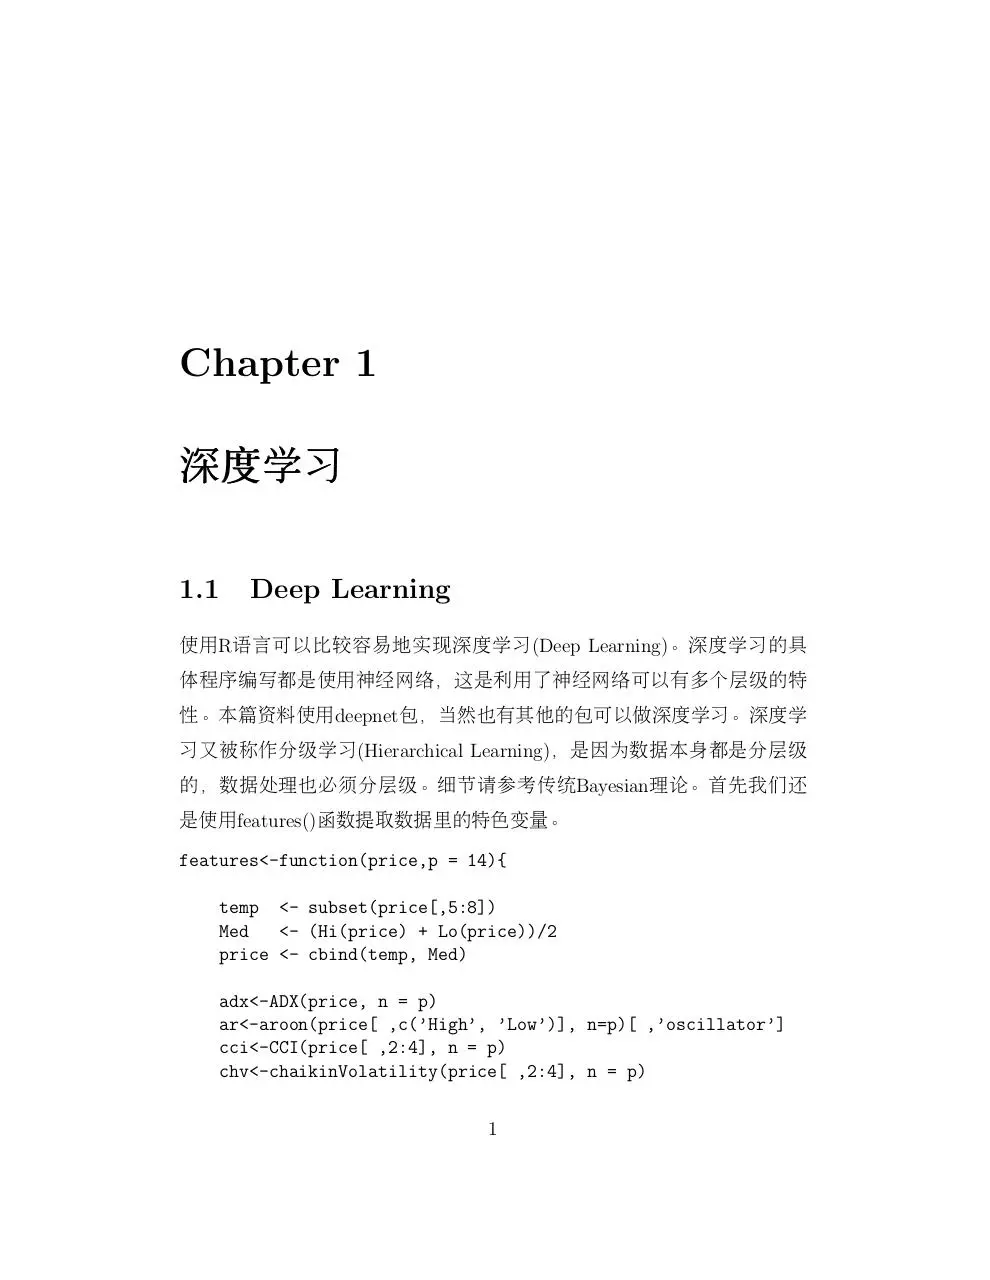
使用R语言可以比较容易地实现深度学习(Deep Learning)。深度学习的具
体程序编写都是使用神经网络,这是利用了神经网络可以有多个层级的特
性。本篇资料使用deepnet包,当然也有其他的包可以做深度学习。深度学
习又被称作分级学习(Hierarchical Learning),是因为数据本身都是分层级
的,数据处理也必须分层级。细节请参考传统Bayesian理论。首先我们还
是使用features()函数提取数据里的特色变量。
features<-function(price,p = 14){
temp <- subset(price[,5:8])
Med
<- (Hi(price) + Lo(price))/2
price <- cbind(temp, Med)
adx<-ADX(price, n = p)
ar<-aroon(price[ ,c(’High’, ’Low’)], n=p)[ ,’oscillator’]
cci<-CCI(price[ ,2:4], n = p)
chv<-chaikinVolatility(price[ ,2:4], n = p)
1
cmo<-CMO(price[ ,’Med’], n = p)
macd<-MACD(price[ ,’Med’], 12, 26, 9)[ ,’macd’]
osma<-macd - MACD(price[ ,’Med’],12, 26, 9)[ ,’signal’]
rsi<-RSI(price[ ,’Med’], n = p)
stoh<-stoch(price[ ,2:4],14, 3, 3)
vol<-volatility(price[ ,1:4],n = p,calc="yang.zhang", N=96)
xavg<-EMA(price[,4],n=p)
trend<-price[,4]-xavg;
atr5<-ATR(HLC(price),5)
atr5<-atr5[,2]
Input<-cbind(adx, ar, cci, chv, cmo, macd, osma, rsi, stoh,vol,
xavg,trend,atr5)
return(Input)
}
1.2
Zigzag
Zigzag是把价格序列的折返(pullback)点用直线连接。这就必须定义价格变
化的大小change,它可以是dollar或percent。这里用percent=T,计算方法
是ch=500*sd(na.omit(ROC(Cl(price)))) 。然后给zigzag线做差,如果差是
正的标记1说明价格上升,如果差是负的说明价格下降标记0。
trend<-function(price){
ch=500*sd(na.omit(ROC(Cl(price))))
zz<-ZigZag(Cl(price), change = ch, percent = T,
retrace = F, lastExtreme = T)
ts.plot(zz)
for(i in 1:length(zz)) { if(is.na(zz[i])) zz[i] = zz[i-1]}
dz<-c(diff(zz), NA)
sig<-ifelse(dz>0, 1, ifelse(dz<0, 0, NA))
return(sig)
}
2
1.3
DNN SAE
主程序读取两组数据,2011-2014年的xom1,2015-2016年的xom2。用xom1建
模,用xom2测试模型。xom1提取features,然后预处理,生成X。xom2提
取features, 然 后 预 处 理 生 成vali。Y是xom1的zigzag生 成 的 。 用X和Y建
立SAE模型。vali输入SAE模型,可以生成15-16年的预测。把这个预测乘
以xom2的回报率r,就可以作图了。最后的结果是1.1。
library(caret)
library(deepnet)
library(quantmod)
library(PerformanceAnalytics)
set.seed(1)
setwd("C:/Users/User/Dropbox/Writting Outlines/Deep Learning/")
xom1<-read.csv("XOM_110101_141231.csv",header=TRUE)
xom2<-read.csv("XOM_150101_161231.csv",header=TRUE)
training
<- na.omit(cbind(features(xom1),trend(xom1)))
validation <- na.omit(features(xom2))
preProc<- preProcess(training[,-ncol(training)],
method = "spatialSign")
X
<- predict(preProc, training[,-ncol(training)])
Y
<- training[,ncol(training)]
vali
<- predict(preProc, validation)
SAE<-sae.dnn.train(x= X, y=Y, hidden=c(50,50,50),
activationfun = "tanh", learningrate = 0.6,
momentum = 0.5, learningrate_scale = 1.0,
output = "sigm", sae_output = "linear",
numepochs = 10, batchsize = 100,
hidden_dropout = 0, visible_dropout = 0)
predict.vali <-round(nn.predict(SAE, vali))
vali.date <-as.Date(as.character(xom2$Date),format="%Y%m%d")
3
Figure 1.1: 深度学习回报率曲线图
r <-ROC(Cl(xom2))
m <- length(r)-length(predict.vali)
r <- tail(r,-m)
vali.date <- tail(vali.date,-m)
profit<-predict.vali*r
profit<-xts(profit,vali.date)
charts.PerformanceSummary(profit)
4
1.4
R语
语言 文 库 资 源
1. 统计套利2017
2. R语言量化金融工程2016
3. R语言时间序列中文教程
4. R语言金融工程中文教程
5. R语言样品比较应用举例
6. R语言德国坦克问题
7. R语言医药研究
8. R语言形成三角形的概率
9. R语言小波分析
10. R语言太空总署的蓄电池
5
Download Rè¯è¨€é‡‘èžæ·±åº¦å¦ä¹
Rè¯è¨€é‡‘èžæ·±åº¦å¦ä¹ .pdf (PDF, 388.93 KB)
Download PDF
Share this file on social networks
Link to this page
Permanent link
Use the permanent link to the download page to share your document on Facebook, Twitter, LinkedIn, or directly with a contact by e-Mail, Messenger, Whatsapp, Line..
Short link
Use the short link to share your document on Twitter or by text message (SMS)
HTML Code
Copy the following HTML code to share your document on a Website or Blog
QR Code to this page

This file has been shared publicly by a user of PDF Archive.
Document ID: 0000630737.