GISG104 Class Final Project (PDF)
File information
Title: Microsoft Word - GISG104 Class Final Project.docx
Author: E D Goff
This PDF 1.5 document has been generated by PScript5.dll Version 5.2.2 / Acrobat Distiller 11.0 (Windows), and has been sent on pdf-archive.com on 12/08/2017 at 00:18, from IP address 107.77.x.x.
The current document download page has been viewed 206 times.
File size: 241.45 KB (3 pages).
Privacy: public file


File preview
Class Final Project
You may have noted in our syllabus that the last assignment in this class is a Final Project map (due by
noon on August 12). I wanted to get you thinking about your map now and to begin planning for what
data you will use and how you will acquire and present that data‐‐acquiring data is always the number
one problem for students (often for professionals as well). Your map will be created in QGIS and will be
delivered as a professional‐looking map in PDF or .JPG format, incorporating the concepts you have
learned in this course. The goal of the final project map will be to present your topic in a well‐designed,
clearly‐understood map, which addresses both the artistic and scientific aspects of cartography.
I will post future reminders about the Final Project map, but here are the requirements.
Identify the theme or “story” you wish to tell with your map.
Be sure to refer to the Checklist on page 259 for map elements. For full credit you must address
all elements in this checklist (though your map may focus on an area other than the 48 states
listed there).
Locate sources of data needed, primarily Esri vector shapefiles and perhaps raster imagery (for
example in a GeoTIFF format—meaning the image is georeferenced). We will learn more about
this soon, but be sure to ask if you have questions.
Your data CANNOT be limited to the shapefiles we already used in the QGIS assignments—you
must go beyond that. The easiest solution for acquiring data is from the SanGIS.org website,
which we examined previously. That data is already in shapefile format and easy to download
and unzip for use in QGIS. All SanGIS data have the same coordinate system too. But there are
countless websites available and googling your subject matter (with keywords like GIS, data,
download) may lead you to other data. Again, if you have questions about data, please ask.
Determine what type of analysis or geoprocessing, if any, you may need to conduct in QGIS. For
example, following what you have learned in Chapter 5 and 6 QGIS labs, you may want to run
queries, selection by location, buffer, create new shapefiles from other shapefiles, etc.
Think about the layout, map extent, symbology, and contents of the final map product: for
example, if you are mapping features in Los Angeles County, your map extent will be the County,
not the entire world. You may include features that should be labeled, or you may have numeric
data that should use graduated symbols, as in the Chapter 7 lab (with population per square
mile).
Export the final map to a PDF or graphic (.jpg) format using the QGIS Composer (from Chapter7).
If you have questions about the Final Project, such as how to acquire data, please let me know ASAP. If
you wait until the final week of class to design and produce your map, it will almost certainly not be
well‐executed and my ability to assist you will be limited. This is something you will need several weeks
to finalize, especially to secure the data you need.
Keep in mind that if the data you want is for a very specific and uncommon subject or location and/or at
very high resolution/large scale, it has a low chance of being readily and freely available‐‐unless you
have, let’s say, a major connection to the primary researcher of the giant clams of Rose Atoll in the
Samoan Archipelago that you plan to map (and unless you do, don’t even try it!).
This is your opportunity to make the map YOU want to make and to design it as you choose. Envision
this as your chance to shine, with a “map story” that you want to tell and go for it.
See page 3 below for advice on adding a background / basemap to QGIS.
San Diego Mesa College
1
Extra Credit
To earn extra credit, submit a one‐to‐two‐page write‐up detailing what your final project map involves
in terms of the theme, data layers used, and the source for these data, and any geoprocessing or
analysis steps you applied. This write‐up is also due no later than noon on August 12 and will be
submitted with your final map via the Assignments page (available later in class). Feel free to include
additional pages for any helpful screenshots, if desired.
San Diego Mesa College
2
Using Background Imagery in QGIS
This is NOT a requirement for your final project map, but you may be interested in adding background
imagery (a basemap) to your QGIS map. There are a number of very useful layers available for use in
QGIS (see dropdown menu in graphic near bottom of page) that can add a background that will benefit
the map, such as roads or terrain.
To set this up in QGIS, click the Plugins menu on the upper QGIS toolbar and select Manage and Install
Plugins to open the Plugins window (this may take a few minutes, depending upon your connection):
Once connected, enter “OpenLayers” in the upper Search section of
the window and, from the list returned, select OpenLayers Plugin.
At the bottom of this window, click the Install plugin button—this may again take
a bit of time to download and install to your computer. Once installed, close the
window and return to the main QGIS window.
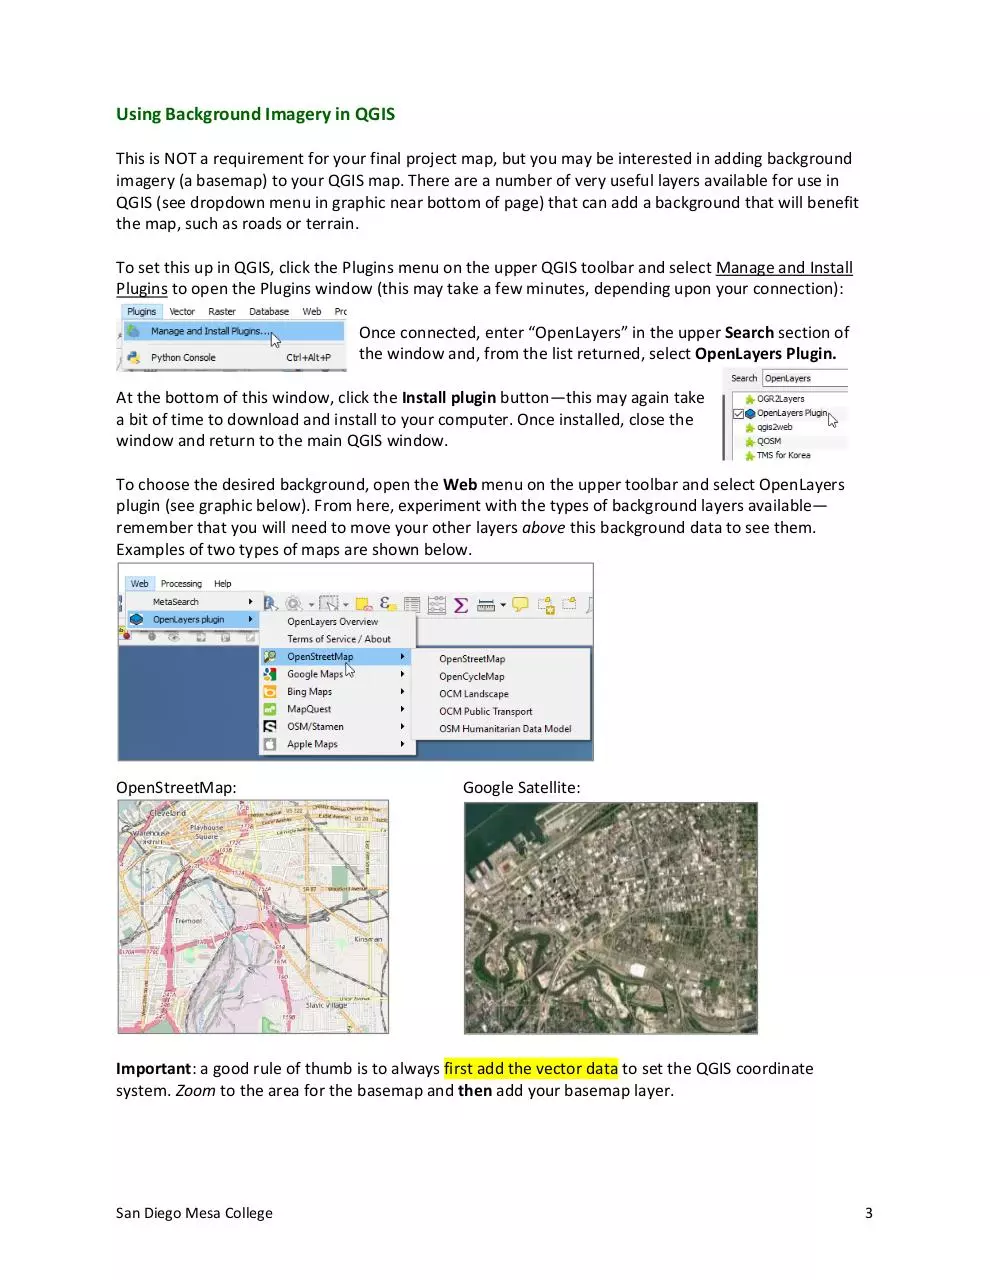
To choose the desired background, open the Web menu on the upper toolbar and select OpenLayers
plugin (see graphic below). From here, experiment with the types of background layers available—
remember that you will need to move your other layers above this background data to see them.
Examples of two types of maps are shown below.
OpenStreetMap: Google Satellite:
Important: a good rule of thumb is to always first add the vector data to set the QGIS coordinate
system. Zoom to the area for the basemap and then add your basemap layer.
San Diego Mesa College
3
Download GISG104 Class Final Project
GISG104 Class Final Project.pdf (PDF, 241.45 KB)
Download PDF
Share this file on social networks
Link to this page
Permanent link
Use the permanent link to the download page to share your document on Facebook, Twitter, LinkedIn, or directly with a contact by e-Mail, Messenger, Whatsapp, Line..
Short link
Use the short link to share your document on Twitter or by text message (SMS)
HTML Code
Copy the following HTML code to share your document on a Website or Blog
QR Code to this page

This file has been shared publicly by a user of PDF Archive.
Document ID: 0000641040.