10.1177 0960327111407644 (1) (PDF)
File information
Title: HET407644 1420..1428
This PDF 1.3 document has been generated by Arbortext Advanced Print Publisher 9.0.114/W / Acrobat Distiller 7.0.5 (Windows), and has been sent on pdf-archive.com on 28/12/2017 at 04:02, from IP address 193.182.x.x.
The current document download page has been viewed 510 times.
File size: 252.52 KB (9 pages).
Privacy: public file


File preview
Original Article
Infant mortality rates regressed
against number of vaccine doses
routinely given: Is there a
biochemical or synergistic toxicity?
Human and Experimental Toxicology
30(9) 1420–1428
ª The Author(s) 2011
Reprints and permission:
sagepub.co.uk/journalsPermissions.nav
DOI: 10.1177/0960327111407644
het.sagepub.com
Neil Z Miller and Gary S Goldman
Abstract
The infant mortality rate (IMR) is one of the most important indicators of the socio-economic well-being and
public health conditions of a country. The US childhood immunization schedule specifies 26 vaccine doses for
infants aged less than 1 year—the most in the world—yet 33 nations have lower IMRs. Using linear regression,
the immunization schedules of these 34 nations were examined and a correlation coefficient of r ¼ 0.70
(p < 0.0001) was found between IMRs and the number of vaccine doses routinely given to infants. Nations were
also grouped into five different vaccine dose ranges: 12–14, 15–17, 18–20, 21–23, and 24–26. The mean IMRs of
all nations within each group were then calculated. Linear regression analysis of unweighted mean IMRs
showed a high statistically significant correlation between increasing number of vaccine doses and increasing
infant mortality rates, with r ¼ 0.992 (p ¼ 0.0009). Using the Tukey-Kramer test, statistically significant differences in mean IMRs were found between nations giving 12–14 vaccine doses and those giving 21–23, and 24–26
doses. A closer inspection of correlations between vaccine doses, biochemical or synergistic toxicity, and IMRs
is essential.
Keywords
infant mortality rates, sudden infant death, SIDS, immunization schedules, childhood vaccines, drug toxicology,
synergistic effects, linear regression model
Introduction
The infant mortality rate (IMR) is one of the most
important measures of child health and overall
development in countries. Clean water, increased
nutritional measures, better sanitation, and easy
access to health care contribute the most to improving
infant mortality rates in unclean, undernourished, and
impoverished regions of the world.1–3 In developing
nations, IMRs are high because these basic necessities
for infant survival are lacking or unevenly distributed.
Infectious and communicable diseases are more
common in developing countries as well, though
sound sanitary practices and proper nutrition would
do much to prevent them.1
The World Health Organization (WHO) attributes
7 out of 10 childhood deaths in developing countries
to five main causes: pneumonia, diarrhea, measles,
malaria, and malnutrition—the latter greatly affecting
all the others.1 Malnutrition has been associated with
a decrease in immune function. An impaired immune
function often leads to an increased susceptibility to
infection.2 It is well established that infections, no
matter how mild, have adverse effects on nutritional
status. Conversely, almost any nutritional deficiency
will diminish resistance to disease.3
Despite the United States spending more per capita
on health care than any other country,4 33 nations
have better IMRs. Some countries have IMRs that are
less than half the US rate: Singapore, Sweden, and
Japan are below 2.80. According to the Centers for
Disease Control and Prevention (CDC), ‘‘The relative
position of the United States in comparison to countries with the lowest infant mortality rates appears
to be worsening.’’5
Corresponding author:
Neil Z Miller, PO Box 9638, Santa Fe, NM 87504, USA
Email: neilzmiller@gmail.com
Miller N Z and Goldman G S
1421
Table 1. 2009 Infant mortality rates, top 34 nations8
Rank
Country
IMR
1
2
3
4
5
6
7
8
9
10
11
12
13
14
15
16
17
18
19
20
21
22
23
24
25
26
27
28
29
30
31
32
33
34
Singapore
Sweden
Japan
Iceland
France
Finland
Norway
Malta
Andorra
Czech Republic
Germany
Switzerland
Spain
Israel
Liechtenstein
Slovenia
South Korea
Denmark
Austria
Belgium
Luxembourg
Netherlands
Australia
Portugal
United Kingdom
New Zealand
Monaco
Canada
Ireland
Greece
Italy
San Marino
Cuba
United States
2.31
2.75
2.79
3.23
3.33
3.47
3.58
3.75
3.76
3.79
3.99
4.18
4.21
4.22
4.25
4.25
4.26
4.34
4.42
4.44
4.56
4.73
4.75
4.78
4.85
4.92
5.00
5.04
5.05
5.16
5.51
5.53
5.82
6.22
CIA. Country comparison: infant mortality rate (2009). The World
Factbook. www.cia.gov (Data last updated 13 April 2010).8
There are many factors that affect the IMR of any
given country. For example, premature births in the
United States have increased by more than 20%
between 1990 and 2006. Preterm babies have a higher
risk of complications that could lead to death within
the first year of life.6 However, this does not fully
explain why the United States has seen little improvement in its IMR since 2000.7
Nations differ in their immunization requirements
for infants aged less than 1 year. In 2009, five of the
34 nations with the best IMRs required 12 vaccine
doses, the least amount, while the United States
required 26 vaccine doses, the most of any nation.
To explore the correlation between vaccine doses that
nations routinely give to their infants and their
infant mortality rates, a linear regression analysis was
performed.
Methods and design
Infant mortality
The infant mortality rate is expressed as the
number of infant deaths per 1000 live births.
According to the US Central Intelligence Agency
(CIA), which keeps accurate, up-to-date infant
mortality statistics throughout the world, in 2009
there were 33 nations with better infant mortality
rates than the United States (Table 1).8 The US
infant mortality rate of 6.22 infant deaths per
1000 live births ranked 34th.
Immunization schedules and vaccine doses
A literature review was conducted to determine the
immunization schedules for the United States and all
33 nations with better IMRs than the United States.9,10
The total number of vaccine doses specified for
infants aged less than 1 year was then determined for
each country (Table 2). A vaccine dose is an exact
amount of medicine or drug to be administered. The
number of doses a child receives should not be confused with the number of ‘vaccines’ or ‘injections’
given. For example, DTaP is given as a single injection but contains three separate vaccines (for
diphtheria, tetanus, and pertussis) totaling three vaccine doses.
Nations organized into data pairs
The 34 nations were organized into data pairs consisting of total number of vaccine doses specified for
their infants and IMRs. Consistent with biostatistical
conventions, four nations—Andorra, Liechenstein,
Monaco, and San Marino—were excluded from the
dataset because they each had fewer than five infant
deaths, producing extremely wide confidence intervals and IMR instability. The remaining 30 (88%)
of the data pairs were then available for analysis.
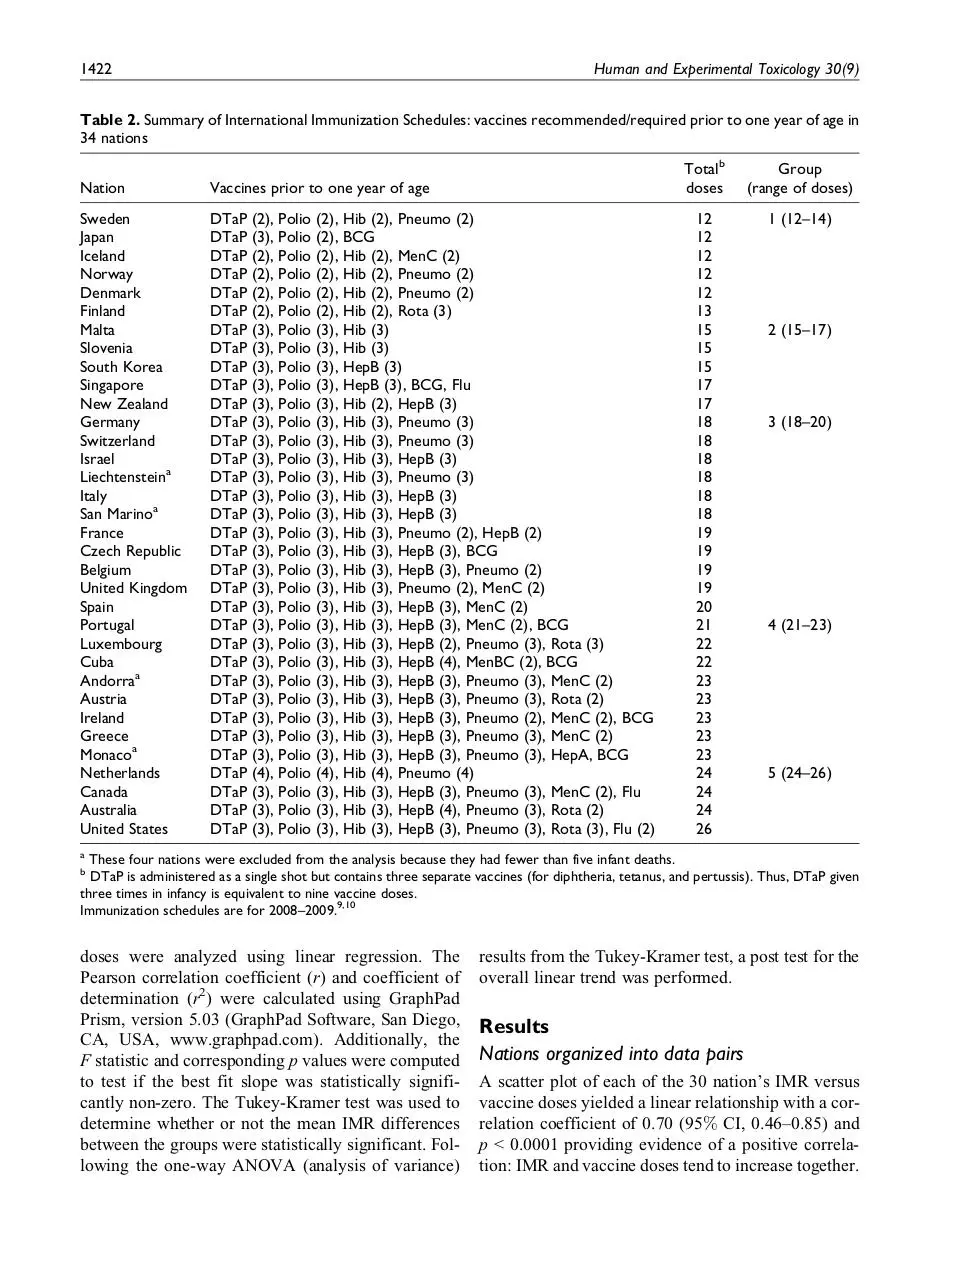
Nations organized into groups
Nations were placed into the following five groups
based on the number of vaccine doses they routinely
give their infants: 12–14, 15–17, 18–20, 21–23, and
24–26 vaccine doses. The unweighted IMR means
of all nations as a function of the number of vaccine
1422
Human and Experimental Toxicology 30(9)
Table 2. Summary of International Immunization Schedules: vaccines recommended/required prior to one year of age in
34 nations
Nation
Vaccines prior to one year of age
Sweden
Japan
Iceland
Norway
Denmark
Finland
Malta
Slovenia
South Korea
Singapore
New Zealand
Germany
Switzerland
Israel
Liechtensteina
Italy
San Marinoa
France
Czech Republic
Belgium
United Kingdom
Spain
Portugal
Luxembourg
Cuba
Andorraa
Austria
Ireland
Greece
Monacoa
Netherlands
Canada
Australia
United States
DTaP
DTaP
DTaP
DTaP
DTaP
DTaP
DTaP
DTaP
DTaP
DTaP
DTaP
DTaP
DTaP
DTaP
DTaP
DTaP
DTaP
DTaP
DTaP
DTaP
DTaP
DTaP
DTaP
DTaP
DTaP
DTaP
DTaP
DTaP
DTaP
DTaP
DTaP
DTaP
DTaP
DTaP
(2), Polio
(3), Polio
(2), Polio
(2), Polio
(2), Polio
(2), Polio
(3), Polio
(3), Polio
(3), Polio
(3), Polio
(3), Polio
(3), Polio
(3), Polio
(3), Polio
(3), Polio
(3), Polio
(3), Polio
(3), Polio
(3), Polio
(3), Polio
(3), Polio
(3), Polio
(3), Polio
(3), Polio
(3), Polio
(3), Polio
(3), Polio
(3), Polio
(3), Polio
(3), Polio
(4), Polio
(3), Polio
(3), Polio
(3), Polio
(2), Hib (2), Pneumo (2)
(2), BCG
(2), Hib (2), MenC (2)
(2), Hib (2), Pneumo (2)
(2), Hib (2), Pneumo (2)
(2), Hib (2), Rota (3)
(3), Hib (3)
(3), Hib (3)
(3), HepB (3)
(3), HepB (3), BCG, Flu
(3), Hib (2), HepB (3)
(3), Hib (3), Pneumo (3)
(3), Hib (3), Pneumo (3)
(3), Hib (3), HepB (3)
(3), Hib (3), Pneumo (3)
(3), Hib (3), HepB (3)
(3), Hib (3), HepB (3)
(3), Hib (3), Pneumo (2), HepB (2)
(3), Hib (3), HepB (3), BCG
(3), Hib (3), HepB (3), Pneumo (2)
(3), Hib (3), Pneumo (2), MenC (2)
(3), Hib (3), HepB (3), MenC (2)
(3), Hib (3), HepB (3), MenC (2), BCG
(3), Hib (3), HepB (2), Pneumo (3), Rota (3)
(3), Hib (3), HepB (4), MenBC (2), BCG
(3), Hib (3), HepB (3), Pneumo (3), MenC (2)
(3), Hib (3), HepB (3), Pneumo (3), Rota (2)
(3), Hib (3), HepB (3), Pneumo (2), MenC (2), BCG
(3), Hib (3), HepB (3), Pneumo (3), MenC (2)
(3), Hib (3), HepB (3), Pneumo (3), HepA, BCG
(4), Hib (4), Pneumo (4)
(3), Hib (3), HepB (3), Pneumo (3), MenC (2), Flu
(3), Hib (3), HepB (4), Pneumo (3), Rota (2)
(3), Hib (3), HepB (3), Pneumo (3), Rota (3), Flu (2)
Totalb
doses
Group
(range of doses)
12
12
12
12
12
13
15
15
15
17
17
18
18
18
18
18
18
19
19
19
19
20
21
22
22
23
23
23
23
23
24
24
24
26
1 (12–14)
2 (15–17)
3 (18–20)
4 (21–23)
5 (24–26)
a
These four nations were excluded from the analysis because they had fewer than five infant deaths.
DTaP is administered as a single shot but contains three separate vaccines (for diphtheria, tetanus, and pertussis). Thus, DTaP given
three times in infancy is equivalent to nine vaccine doses.
Immunization schedules are for 2008–2009.9,10
b
doses were analyzed using linear regression. The
Pearson correlation coefficient (r) and coefficient of
determination (r2) were calculated using GraphPad
Prism, version 5.03 (GraphPad Software, San Diego,
CA, USA, www.graphpad.com). Additionally, the
F statistic and corresponding p values were computed
to test if the best fit slope was statistically significantly non-zero. The Tukey-Kramer test was used to
determine whether or not the mean IMR differences
between the groups were statistically significant. Following the one-way ANOVA (analysis of variance)
results from the Tukey-Kramer test, a post test for the
overall linear trend was performed.
Results
Nations organized into data pairs
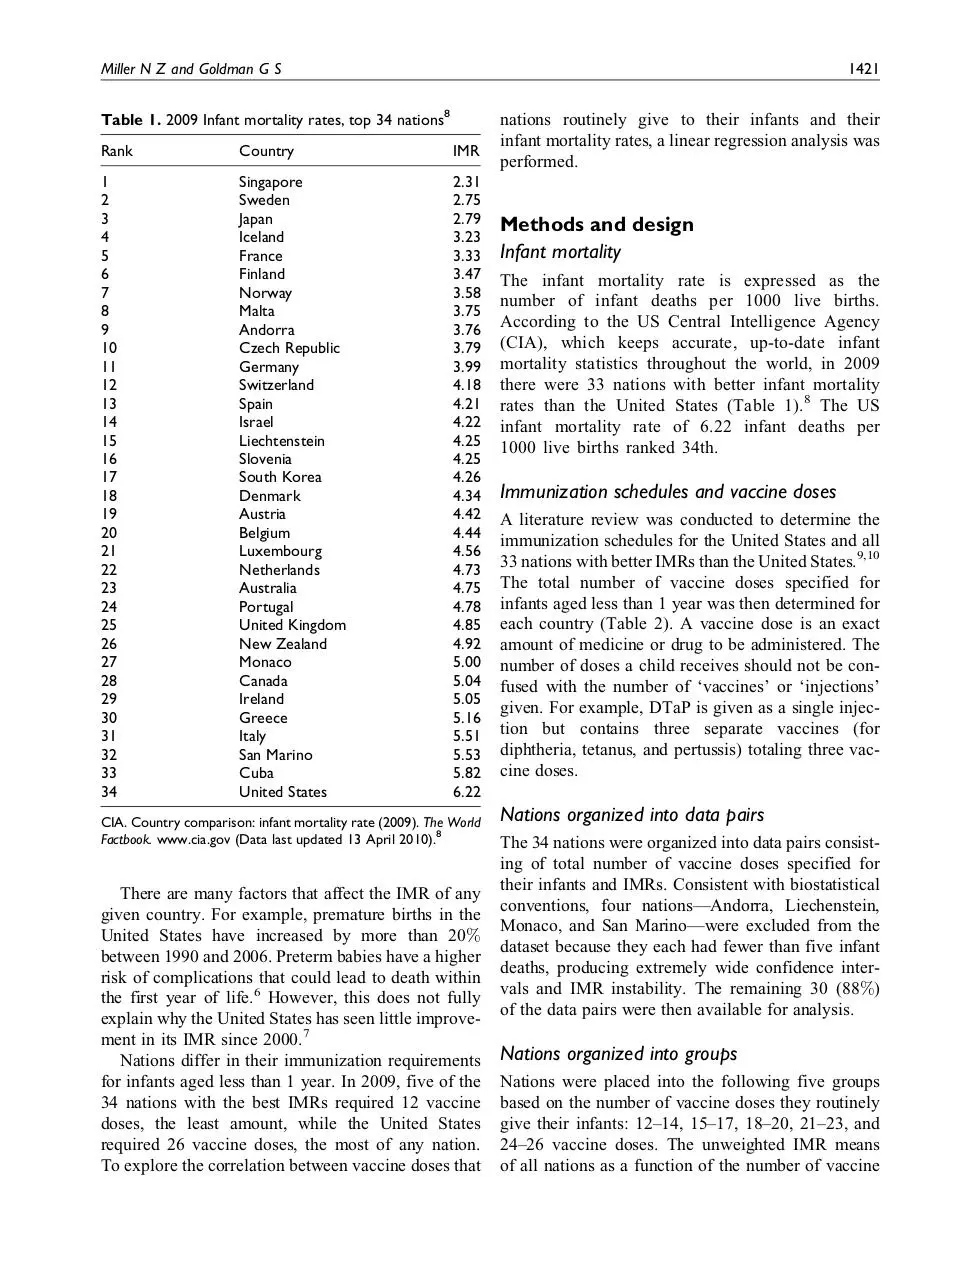
A scatter plot of each of the 30 nation’s IMR versus
vaccine doses yielded a linear relationship with a correlation coefficient of 0.70 (95% CI, 0.46–0.85) and
p < 0.0001 providing evidence of a positive correlation: IMR and vaccine doses tend to increase together.
Miller N Z and Goldman G S
7
1423
7
best fit line: y = 0.148x + 1.566, r = 0.7 (p < 0.0001)
slope F−statistic: F = 27.2, p < 0.0001
Mean infant mortality rate
(deaths/1,000)
Infant mortality rate
(deaths/1000)
6
5
4
best fit line
95% CI
3
12
15
18
21
24
6
5
21−23
4
27
Number of vaccine doses
Figure 1. 2009 Infant mortality rates and number of
vaccine doses for 30 nations.
The F statistic applied to the slope [0.148 (95% CI,
0.090–0.206)] is significantly non-zero, with F ¼ 27.2
(p < 0.0001; Figure 1).
Nations organized into groups
The unweighted mean IMR of each category was
computed by simply summing the IMRs of each
nation comprising a group and dividing by the number
of nations in that group. The IMRs were as follows:
3.36 (95% CI, 2.74–3.98) for nations specifying
12–14 doses (mean 13 doses); 3.89 (95% CI,
2.68–5.12) for 15–17 doses (mean 16 doses);
4.28 (95% CI, 3.80–4.76) for 18–20 doses (mean
19 doses); 4.97 (95% CI, 4.44–5.49) for 21–23 doses
(mean 22 doses); 5.19 (95% CI, 4.06–6.31) for 24-26
doses (mean 25 doses; Figure 2). Linear regression
analysis yielded an equation of the best fit line,
y ¼ 0.157x þ 1.34 with r ¼ 0.992 (p ¼ 0.0009) and
r2 ¼ 0.983. Thus, 98.3% of the variation in mean IMRs
is explained by the linear model. Again, the F statistic
yielded a significantly non-zero slope, with F ¼ 173.9
(p ¼ 0.0009).
The one-way ANOVA using the Tukey-Kramer
test yielded F ¼ 650 with p ¼ 0.001, indicating the
five mean IMRs corresponding to the five defined
dose categories are significantly different (r2 ¼
0.510). Tukey’s multiple comparison test found statistical significance in the differences between the mean
IMRs of those nations giving 12–14 vaccine doses
and (a) those giving 21–23 doses (1.61, 95% CI,
0.457–2.75) and (b) those giving 24–26 doses (1.83,
95% CI, 0.542–3.11).
24−26
18−20
3
12−14
2
9
best fit line: y = 0.157x +1.34, r = 0.992 (p = 0.0009)
slope F−statistic: F = 173.9, p = 0.0009
2
13
best fit line
15−17
16
19
Vaccine Doses
22
25
Figure 2. 2009 Mean infant mortality rates and mean
number of vaccine doses (five categories).
Discussion
Basic necessities for infant survival
It is instructive to note that many developing nations
require their infants to receive multiple vaccine doses
and have national vaccine coverage rates (a percentage of the target population that has been vaccinated)
of 90% or better, yet their IMRs are poor. For example, Gambia requires its infants to receive 22 vaccine
doses during infancy and has a 91%–97% national
vaccine coverage rate, yet its IMR is 68.8. Mongolia
requires 22 vaccine doses during infancy, has a
95%–98% coverage rate, and an IMR of 39.9.8,9
These examples appear to confirm that IMRs will
remain high in nations that cannot provide clean
water, proper nutrition, improved sanitation, and better access to health care. As developing nations
improve in all of these areas a critical threshold will
eventually be reached where further reductions of the
infant mortality rate will be difficult to achieve
because most of the susceptible infants that could
have been saved from these causes would have been
saved. Further reductions of the IMR must then be
achieved in areas outside of these domains. As developing nations ascend to higher socio-economic living
standards, a closer inspection of all factors contributing to infant deaths must be made.
Crossing the socio-economic threshold
It appears that at a certain stage in nations’ movement
up the socio-economic scale—after the basic necessities for infant survival (proper nutrition, sanitation,
clean water, and access to health care) have been
met—a counter-intuitive relationship occurs between
1424
the number of vaccines given to infants and infant
mortality rates: nations with higher (worse) infant
mortality rates give their infants, on average, more
vaccine doses. This positive correlation, derived from
the data and demonstrated in Figures 1 and 2, elicits
an important inquiry: are some infant deaths associated with over-vaccination?
A closer inspection of infant deaths
Many nations adhere to an agreed upon International
Classification of Diseases (ICD) for grouping infant
deaths into 130 categories.11–13 Among the 34 nations
analyzed, those that require the most vaccines tend to
have the worst IMRs. Thus, we must ask important
questions: is it possible that some nations are requiring
too many vaccines for their infants and the additional
vaccines are a toxic burden on their health? Are some
deaths that are listed within the 130 infant mortality
death categories really deaths that are associated with
over-vaccination? Are some vaccine-related deaths
hidden within the death tables?
Sudden infant death syndrome (SIDS)
Prior to contemporary vaccination programs, ‘Crib
death’ was so infrequent that it was not mentioned
in infant mortality statistics. In the United States,
national immunization campaigns were initiated in
the 1960s when several new vaccines were introduced
and actively recommended. For the first time in history, most US infants were required to receive several
doses of DPT, polio, measles, mumps, and rubella
vaccines.14 Shortly thereafter, in 1969, medical certifiers presented a new medical term—sudden infant
death syndrome.15,16 In 1973, the National Center for
Health Statistics added a new cause-of-death category—for SIDS—to the ICD. SIDS is defined as the
sudden and unexpected death of an infant which
remains unexplained after a thorough investigation.
Although there are no specific symptoms associated
with SIDS, an autopsy often reveals congestion and
edema of the lungs and inflammatory changes in the
respiratory system.17 By 1980, SIDS had become the
leading cause of postneonatal mortality (deaths of
infants from 28 days to one year old) in the United
States.18
In 1992, to address the unacceptable SIDS rate, the
American Academy of Pediatrics initiated a ‘Back to
Sleep’ campaign, convincing parents to place their
infants supine, rather than prone, during sleep. From
1992 to 2001, the postneonatal SIDS rate dropped by
Human and Experimental Toxicology 30(9)
an average annual rate of 8.6%. However, other causes
of sudden unexpected infant death (SUID) increased.
For example, the postneonatal mortality rate from ‘suffocation in bed’ (ICD-9 code E913.0) increased during
this same period at an average annual rate of 11.2%.
The postneonatal mortality rate from ‘suffocationother’ (ICD-9 code E913.1-E913.9), ‘unknown and
unspecified causes’ (ICD-9 code 799.9), and due to
‘intent unknown’ in the External Causes of Injury section (ICD-9 code E980-E989), all increased during this
period as well.18 (In Australia, Mitchell et al. observed
that when the SIDS rate decreased, deaths attributed to
asphyxia increased.19 Overpeck et al. and others,
reported similar observations.)20,21
A closer inspection of the more recent period from
1999 to 2001 reveals that the US postneonatal SIDS
rate continued to decline, but there was no significant
change in the total postneonatal mortality rate. During this period, the number of deaths attributed to
‘suffocation in bed’ and ‘unknown causes,’ increased
significantly. According to Malloy and MacDorman,
‘‘If death-certifier preference has shifted such that
previously classified SIDS deaths are now classified
as ‘suffocation,’ the inclusion of these suffocation
deaths and unknown or unspecified deaths with SIDS
deaths then accounts for about 90 percent of the
decline in the SIDS rate observed between 1999 and
2001 and results in a non-significant decline in
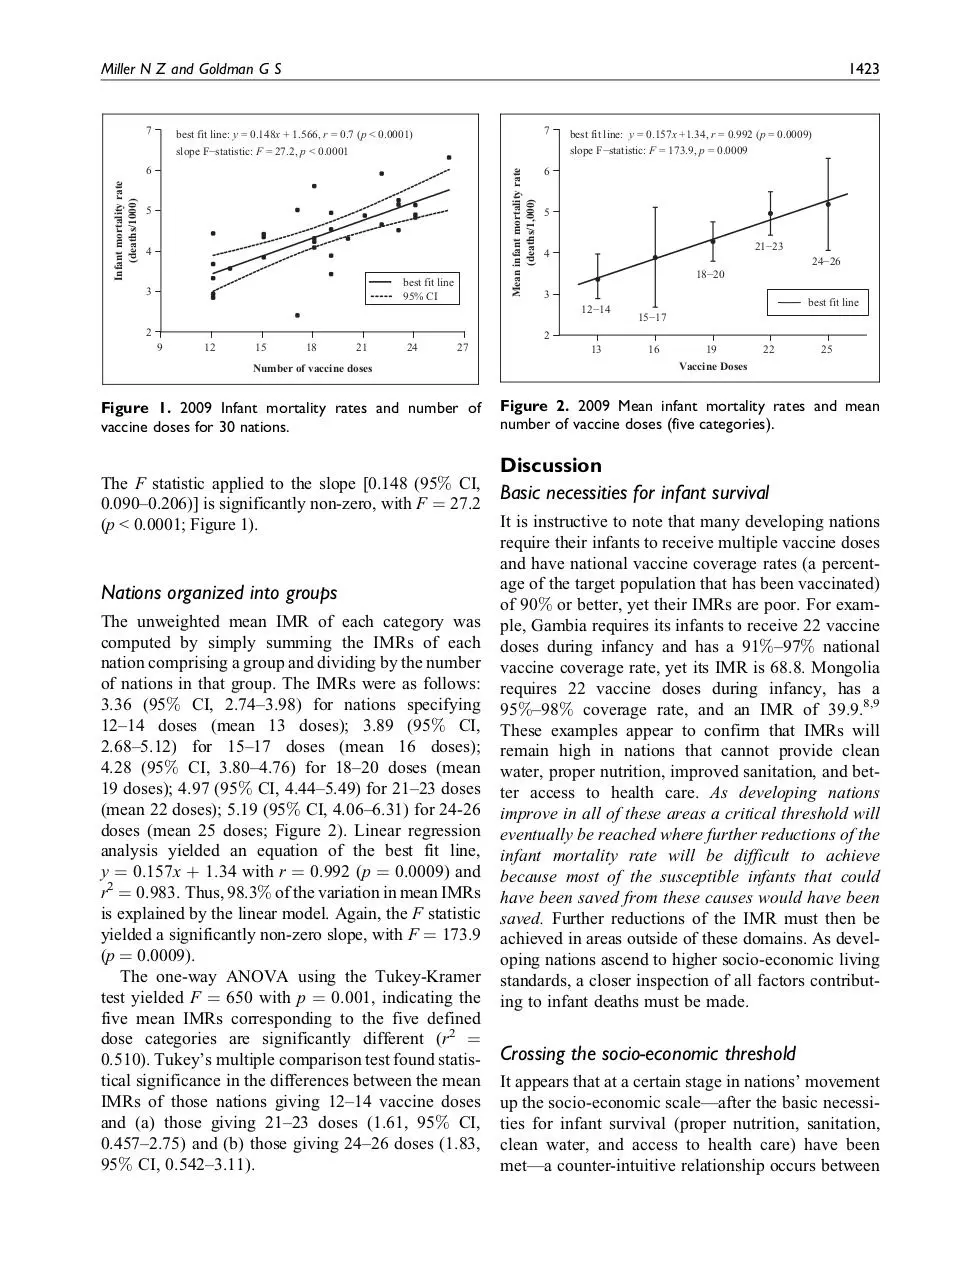
SIDS’’18 (Figure 3).
Is there evidence linking SIDS to vaccines?
Although some studies were unable to find correlations between SIDS and vaccines,22–24 there is some
evidence that a subset of infants may be more susceptible to SIDS shortly after being vaccinated. For
example, Torch found that two-thirds of babies who
had died from SIDS had been vaccinated against DPT
(diphtheria–pertussis–tetanus toxoid) prior to death.
Of these, 6.5% died within 12 hours of vaccination;
13% within 24 hours; 26% within 3 days; and 37%,
61%, and 70% within 1, 2, and 3 weeks, respectively.
Torch also found that unvaccinated babies who died
of SIDS did so most often in the fall or winter while
vaccinated babies died most often at 2 and 4
months—the same ages when initial doses of DPT
were given to infants. He concluded that DPT ‘‘may
be a generally unrecognized major cause of sudden
infant and early childhood death, and that the risks
of immunization may outweigh its potential benefits.
A need for re-evaluation and possible modification of
Miller N Z and Goldman G S
1425
Reclassification of SIDS Deaths to
Suffocation in Bed and Unknown Causes
Death per 100,000
90
80
77.4
77.1
75.4
70
60
61.6
57.1
50.9
50
40
1999
2000
2001
SIDS
SIDS + Suffocation + Unknown Causes
Figure 3. Reclassification of sudden infant death syndrome
(SIDS) deaths to suffocation in bed and unknown causes.
The postneonatal SIDS rate appears to have declined from
61.6 deaths (per 100,000 live births) in 1999 to 50.9 in
2001. However, during this period there was a significant
increase in postneonatal deaths attributed to suffocation
in bed and due to unknown causes. When these sudden
unexpected infant deaths (SUIDs) are combined with SIDS
deaths, the total SIDS rate remains relatively stable, resulting in a non-significant decline.
current vaccination procedures is indicated by this
study.’’25 Walker et al. found ‘‘the SIDS mortality rate
in the period zero to three days following DPT to be 7.3
times that in the period beginning 30 days after
immunization.’’26 Fine and Chen reported that babies
died at a rate nearly eight times greater than normal
within 3 days after getting a DPT vaccination.27
Ottaviani et al. documented the case of a 3-month-old
infant who died suddenly and unexpectedly shortly after
being given six vaccines in a single shot: ‘‘Examination
of the brainstem on serial sections revealed bilateral
hypoplasia of the arcuate nucleus. The cardiac conduction system presented persistent fetal dispersion and
resorptive degeneration. This case offers a unique
insight into the possible role of hexavalent vaccine in
triggering a lethal outcome in a vulnerable baby.’’ Without a full necropsy study in the case of sudden, unexpected infant death, at least some cases linked to
vaccination are likely to go undetected.28
Reclassified infant deaths
It appears as though some infant deaths attributed to
SIDS may be vaccine related, perhaps associated with
biochemical or synergistic toxicity due to overvaccination. Some infants’ deaths categorized as ‘suffocation’ or due to ‘unknown and unspecified causes’
may also be cases of SIDS reclassified within the
ICD. Some of these infant deaths may be vaccine
related as well. This trend toward reclassifying ICD
data is a great concern of the CDC ‘‘because inaccurate or inconsistent cause-of-death determination and
reporting hamper the ability to monitor national
trends, ascertain risk factors, and design and evaluate
programs to prevent these deaths.’’29 If some infant
deaths are vaccine related and concealed within the
various ICD categories for SUIDs, is it possible that
other vaccine-related infant deaths have also been
reclassified?
Of the 34 nations that have crossed the socioeconomic threshold and are able to provide the basic
necessities for infant survival—clean water, nutrition,
sanitation, and health care—several require their
infants to receive a relatively high number of vaccine
doses and have relatively high infant mortality rates.
These nations should take a closer look at their infant
death tables to determine if some fatalities are possibly related to vaccines though reclassified as other
causes. Of course, all SUID categories should be reinspected. Other ICD categories may be related to
vaccines as well. For example, a new live-virus orally
administered vaccine against rotavirus-induced
diarrhea—Rotarix1—was licensed by the European
Medicine Agency in 2006 and approved by the US
Food and Drug Administration (FDA) in 2008.
However, in a clinical study that evaluated the safety
of the Rotarix vaccine, vaccinated babies died at a
higher rate than non-vaccinated babies—mainly due
to a statistically significant increase in pneumoniarelated fatalities.30 (One biologically plausible explanation is that natural rotavirus infection might have a
protective effect against respiratory infection.)31
Although these fatalities appear to be vaccine related
and raise a nation’s infant mortality rate, medical
certifiers are likely to misclassify these deaths as
pneumonia.
Several additional ICD categories are possible candidates for incorrect infant death classifications:
unspecified viral diseases, diseases of the blood,
septicemia, diseases of the nervous system, anoxic
brain damage, other diseases of the nervous system,
diseases of the respiratory system, influenza, and
unspecified diseases of the respiratory system. All
of these selected causes may be repositories of
vaccine-related infant deaths reclassified as common
fatalities. All nations—rich and poor, industrialized
and developing—have an obligation to determine
whether their immunization schedules are achieving
1426
their desired goals. Progress on reducing infant
mortality rates should include monitoring vaccine
schedules and medical certification practices to ascertain whether vaccine-related infant deaths are being
reclassified as ordinary mortality in the ICD.
Human and Experimental Toxicology 30(9)
of the nations in this study had coverage rates in the
90%–99% range for the most commonly recommended vaccines—DTaP, polio, hepatitis B, and Hib
(when these vaccines were included in the schedule).
Therefore, this factor is unlikely to have impacted the
analyses.9
How many infants can be saved with an improved
IMR?
Minority races
Slight improvements in IMRs can make a substantial
difference. In 2009, there were approximately 4.5 million live births and 28,000 infant deaths in the United
States, resulting in an infant mortality rate of 6.22/
1000. If health authorities can find a way to reduce the
rate by 1/1000 (16%), the United States would rise
in international rank from 34th to 31st and about
4500 infants would be saved.
Limitations of study and potential
confounding factors
This analysis did not adjust for vaccine composition,
national vaccine coverage rates, variations in the
infant mortality rates among minority races, preterm
births, differences in how some nations report live
births, or the potential for ecological bias. A few comments about each of these factors are included below.
Vaccine composition
This analysis calculated the total number of vaccine
doses received by children but did not differentiate
between the substances, or quantities of those substances, in each dose. Common vaccine substances
include antigens (attenuated viruses, bacteria, toxoids),
preservatives (thimerosal, benzethonium chloride,
2-phenoxyethanol, phenol), adjuvants (aluminum
salts), additives (ammonium sulfate, glycerin, sodium
borate, polysorbate 80, hydrochloric acid, sodium
hydroxide, potassium chloride), stabilizers (fetal
bovine serum, monosodium glutamate, human serum
albumin, porcine gelatin), antibiotics (neomycin, streptomycin, polymyxin B), and inactivating chemicals
(formalin, glutaraldehyde, polyoxyethylene). For the
purposes of this study, all vaccine doses were equally
weighted.
Vaccine coverage rates
No adjustment was made for national vaccine coverage rates—a percentage of the target population that
received the recommended vaccines. However, most
It has been argued that the US IMR is poor in comparison to many other nations because African–American
infants are at greater risk of dying relative to White
infants, perhaps due to genetic factors or disparities
in living standards. However, in 2006 the US IMR for
infants of all races was 6.69 and the IMR for White
infants was 5.56.13 In 2009, this improved rate would
have moved the United States up by just one rank internationally, from 34th place to 33rd place.8 In addition,
the IMRs for Hispanics of Mexican descent and Asian–
Americans in the United States are significantly lower
than the IMR for Whites.6 Thus, diverse IMRs among
different races in the Unites States exert only a modest
influence over the United States’ international infant
mortality rank.
Preterm births
Preterm birth rates in the United States have steadily
increased since the early 1980s. (This rise has been
tied to a greater reliance on caesarian deliveries,
induced labor, and more births to older mothers.) Preterm babies are more likely than full-term babies to
die within the first year of life. About 12.4% of US
births are preterm. In Europe, the prevalence rate of
premature birth ranges from 5.5% in Ireland to
11.4% in Austria. Preventing preterm births is essential to lower infant mortality rates. However, it is
important to note that some nations such as Ireland
and Greece, which have very low preterm birth rates
(5.5% and 6%, respectively) compared to the United
States, require their infants to receive a relatively high
number of vaccine doses (23) and have correspondingly high IMRs. Therefore, reducing preterm birth
rates is only part of the solution to reduce IMRs.6,32
Differences in reporting live births
Infant mortality rates in most countries are reported
using WHO standards, which do not include any reference to the duration of pregnancy or weight of the
infant, but do define a ‘live birth’ as a baby born with
any signs of life for any length of time.12 However,
Miller N Z and Goldman G S
four nations in the dataset—France, the Czech
Republic, the Netherlands, and Ireland—do not report
live births entirely consistent with WHO standards.
These countries add an additional requirement that
live babies must also be at least 22 weeks of gestation
or weigh at least 500 grams. If babies do not meet this
requirement and die shortly after birth, they are
reported as stillbirths. This inconsistency in reporting
live births artificially lowers the IMRs of these
nations.32,33 According to the CDC, ‘‘There are some
differences among countries in the reporting of very
small infants who may die soon after birth. However,
it appears unlikely that differences in reporting are the
primary explanation for the United States’ relatively
low international ranking.’’32 Nevertheless, when the
IMRs of France, the Czech Republic, the Netherlands,
and Ireland were adjusted for known underreporting
of live births and the 30 data pairs retested for
significance, the correlation coefficient improved
from 0.70 to 0.74 (95% CI, 0.52–0.87).
Ecological bias
Ecological bias occurs when relationships among
individuals are inferred from similar relationships
observed among groups (or nations). Although most
of the nations in this study had 90%–99% of their
infants fully vaccinated, without additional data we
do not know whether it is the vaccinated or unvaccinated infants who are dying in infancy at higher rates.
However, respiratory disturbances have been documented in close proximity to infant vaccinations, and
lethal changes in the brainstem of a recently vaccinated baby have been observed. Since some infants
may be more susceptible to SIDS shortly after being
vaccinated, and babies vaccinated against diarrhea
died from pneumonia at a statistically higher rate than
non-vaccinated babies, there is plausible biologic and
causal evidence that the observed correlation between
IMRs and the number of vaccine doses routinely
given to infants should not be dismissed as ecological
bias.
Conclusion
The US childhood immunization schedule requires
26 vaccine doses for infants aged less than 1 year, the
most in the world, yet 33 nations have better IMRs.
Using linear regression, the immunization schedules
of these 34 nations were examined and a correlation
coefficient of 0.70 (p < 0.0001) was found between
IMRs and the number of vaccine doses routinely
1427
given to infants. When nations were grouped into five
different vaccine dose ranges (12–14, 15–17, 18–20,
21–23, and 24–26), 98.3% of the total variance in
IMR was explained by the unweighted linear
regression model. These findings demonstrate a
counter-intuitive relationship: nations that require
more vaccine doses tend to have higher infant mortality rates.
Efforts to reduce the relatively high US IMR have
been elusive. Finding ways to lower preterm birth
rates should be a high priority. However, preventing
premature births is just a partial solution to reduce
infant deaths. A closer inspection of correlations
between vaccine doses, biochemical or synergistic
toxicity, and IMRs, is essential. All nations—rich and
poor, advanced and developing—have an obligation
to determine whether their immunization schedules
are achieving their desired goals.
Acknowledgments
The authors wish to thank Gerard Jungman, PhD, Paul G.
King, PhD, and Peter Calhoun for their assistance in
reviewing the manuscript and sharing their expertise.
Funding
This research received no specific grant from any funding
agency in the public, commercial, or not-for-profit sectors.
References
1. Wegman ME. Infant mortality in the 20th century,
dramatic but uneven progress. J Nutr 2001; 131:
401S–408S.
2. Beck MA. The role of nutrition in viral disease. J Nutri
Biochem 1996; 7: 683–690.
3. Scrimshaw NS and SanGiovanni JP. Synergism of nutrition, infection, and immunity: an overview. Am J Clin
Nutr 1997; 66: 464S–477S.
4. Anderson GF, Hussay PS, Frogner BK, and Waters HR.
Health spending in the United States and the rest of the
industrialized world. Health Affairs 2005; 24: 903–914.
5. MacDorman MF and Mathews TJ. Recent trends in
infant mortality in the United States. NCHS Data Brief
(CDC), no 9. Hyattsville, MD, USA: National Center for
Health Statistics, 2008.
6. Kent MM. Premature births help to explain higher infant
mortality rate. Population Reference Bureau.
www.prb.org/articles/2009/prematurebirth.aspx
(accessed December 2009).
7. Xu Jiaquan, Kochaneck KD, and Tejada-Vera B.
Deaths: preliminary data for 2007. Natl Vital Stat Rep
2009; 58: 6.
1428
8. CIA. Country comparison: infant mortality rate (2009).
The World Factbook. www.cia.gov (accessed 13 April
2010).
9. WHO/UNICEF. Immunization Summary: A Statistical
Reference Containing Data Through 2008 (The 2010
Edition). www.childinfo.org.
10. Up-to-date European vaccination schedules may be
found here: www.euvac.net (accessed 13 April 2010).
11. WHO. International Classification of Diseases, 9th
Revision. Geneva, Switzerland: World Health Organization, 1979.
12. WHO. International Statistical Classification of Diseases and Related Health Problems, 10th Revision.
Geneva, Switzerland: World Health Organization, 1992.
13. CDC. Table 31. Number of infant deaths and infant
mortality rates for 130 selected causes, by race: United
States, 2006. Natl Vital Stat Rep 2009; 57: 110–112.
14. Iannelli V. Immunization timeline. Keep Kids Healthy.
keepkidshealthy.com (accessed 21 April 2010).
15. Bergman AB. The ‘‘Discovery’’ of Sudden Infant
Death Syndrome. New York, NY, USA: Praeger Publishers, 1986.
16. MacDorman MF and Rosenberg HM. Trends in infant
mortality by cause of death and other characteristics,
1960-88 (vital and health statistics), Volume 20.
Hyattsville, MD, USA: National Center for Health Statistics, U.S. Government Printing, 1993.
17. National Center for Health Statistics. Vital Statistics of
the United States 1988, Volume II, Mortality, Part A.
Washington, DC, USA: Public Health Service, 1991.
18. Malloy MH and MacDorman M. Changes in the classification of sudden unexpected infant deaths: United
States, 1992-2001. Pediatrics 2005; 115: 1247–1253.
19. Mitchell E, Krous HF, Donald T, and Byard RW.
Changing trends in the diagnosis of sudden infant
death. Am J Forensic Med Pathol 2000; 21: 311–314.
20. Overpeck MD, Brenner RA, Cosgrove C, Trumble AC,
Kochanek K, and MacDorman M. National under
ascertainment of sudden unexpected infant deaths
associated with deaths of unknown cause. Pediatrics
2002; 109: 274–283.
21. Byard RW and Beal SM. Has changing diagnostic preference been responsible for the recent fall in incidence
of sudden infant death syndrome in South Australia?
J Pediatr Child Health 1995; 31: 197–199.
22. Vennemann MM, Butterfass-Bahloul T, Jorch G,
Brinkmann B, Findeisen M, Sauerland C, et al. Sudden
Human and Experimental Toxicology 30(9)
23.
24.
25.
26.
27.
28.
29.
30.
31.
32.
33.
infant death syndrome: no increased risk after
immunisation. Vaccine 2007; 25: 336–340.
Stratton K, Almario DA, Wizemann TM, and
McCormick MC. Immunization safety review: vaccinations and sudden unexpected death in infancy.
Washington DC, USA: National Academies Press,
2003.
Silvers LE, Ellenberg SS, Wise RP, Varricchio FE,
Mootrey GT, and Salive ME. The epidemiology of
fatalities reported to the vaccine adverse event reporting system 1990-1997. Pharmacoepidemiol Drug Saf
2001; 10: 279–285.
Torch WC. Diphtheria-pertussis-tetanus (DPT) immunization: a potential cause of the sudden infant death
syndrome (SIDS). American Academy of Neurology,
34th Annual Meeting, Apr 25-May 1, 1982. Neurology
32(4): pt. 2.
Walker AM, Jick H, Perera DR, Thompson RS, and
Knauss TA. Diphtheria-tetanus-pertussis immunization and sudden infant death syndrome. Am J Public
Health 1987; 77: 945–951.
Fine PE and Chen RT. Confounding in studies of
adverse reactions to vaccines. Am J Epidemiol 1992;
136: 121–135.
Ottaviani G, Lavezze AM, and Matturri L. Sudden
infant death syndrome (SIDS) shortly after hexavalent
vaccination: another pathology in suspected SIDS?
Virchows Archiv 2006; 448: 100–104.
CDC. About the sudden unexpected infant death
investigation (SUIDI) reporting form. Department
of Health and Human Services (accessed 20 May
2010).
GlaxoSmithKline. Rotarix1 (Rotavirus Vaccine, Live,
Oral) Oral Suspension. Product insert from the manufacturer (April 2008): 6.
FDA. Center for biologics evaluation and research,
vaccines and related biological products advisory committee meeting (20 February 2008): 127–128.
MacDorman MF and Mathews TJ. Behind international rankings of infant mortality: how the United
States compares with Europe. NCHS data brief, no
23. Hyattsville, MD, USA: National Center for Health
Statistics, 2009.
Euro-Peristat Project, with SCPE, Eurocat, Euroneostat. European Perinatal Health Report: Data for
2004 (The 2008 Edition): Table 3.1:40. www.
europeristat.com.
Download 10.1177 0960327111407644 (1)
10.1177_0960327111407644 (1).pdf (PDF, 252.52 KB)
Download PDF
Share this file on social networks
Link to this page
Permanent link
Use the permanent link to the download page to share your document on Facebook, Twitter, LinkedIn, or directly with a contact by e-Mail, Messenger, Whatsapp, Line..
Short link
Use the short link to share your document on Twitter or by text message (SMS)
HTML Code
Copy the following HTML code to share your document on a Website or Blog
QR Code to this page

This file has been shared publicly by a user of PDF Archive.
Document ID: 0000713663.