Final Report (PDF)
File information
This PDF 1.4 document has been generated by Online2PDF.com, and has been sent on pdf-archive.com on 13/09/2019 at 22:45, from IP address 123.50.x.x.
The current document download page has been viewed 274 times.
File size: 211.18 KB (10 pages).
Privacy: public file


File preview
"Surprise Factor"
By Hayden BROWN, Tahiti, French Polynesia, 23/08/2017
Project for 'Statement Technologies AG'
Part 1:
The strategy "Surprise Factor" aims to exploit post revenue stock price moves. After restructuring the
data I was able to add simple buy/sell signals for data analysis. In analysing the 'class distribution' of
buy/sell signals for each company, Zalando was bias to the buy side by 70%, Zooplus was bias to the sell
side by 60% and Telefonica was 50/50 buy/sell. Which was also confirmed by plots the Buy/Sell signals.
This gave me the impression that Telefonica was more random than the other two companies and
maybe less favourable to trade.
Zalando Buy/Sell Distributions (Dot up is BUY, Dot down is SELL)
Zooplus Buy/Sell Distributions (Dot up is BUY, Dot down is SELL)
Telefonica Buy/Sell Distributions (Dot up is BUY, Dot down is SELL)
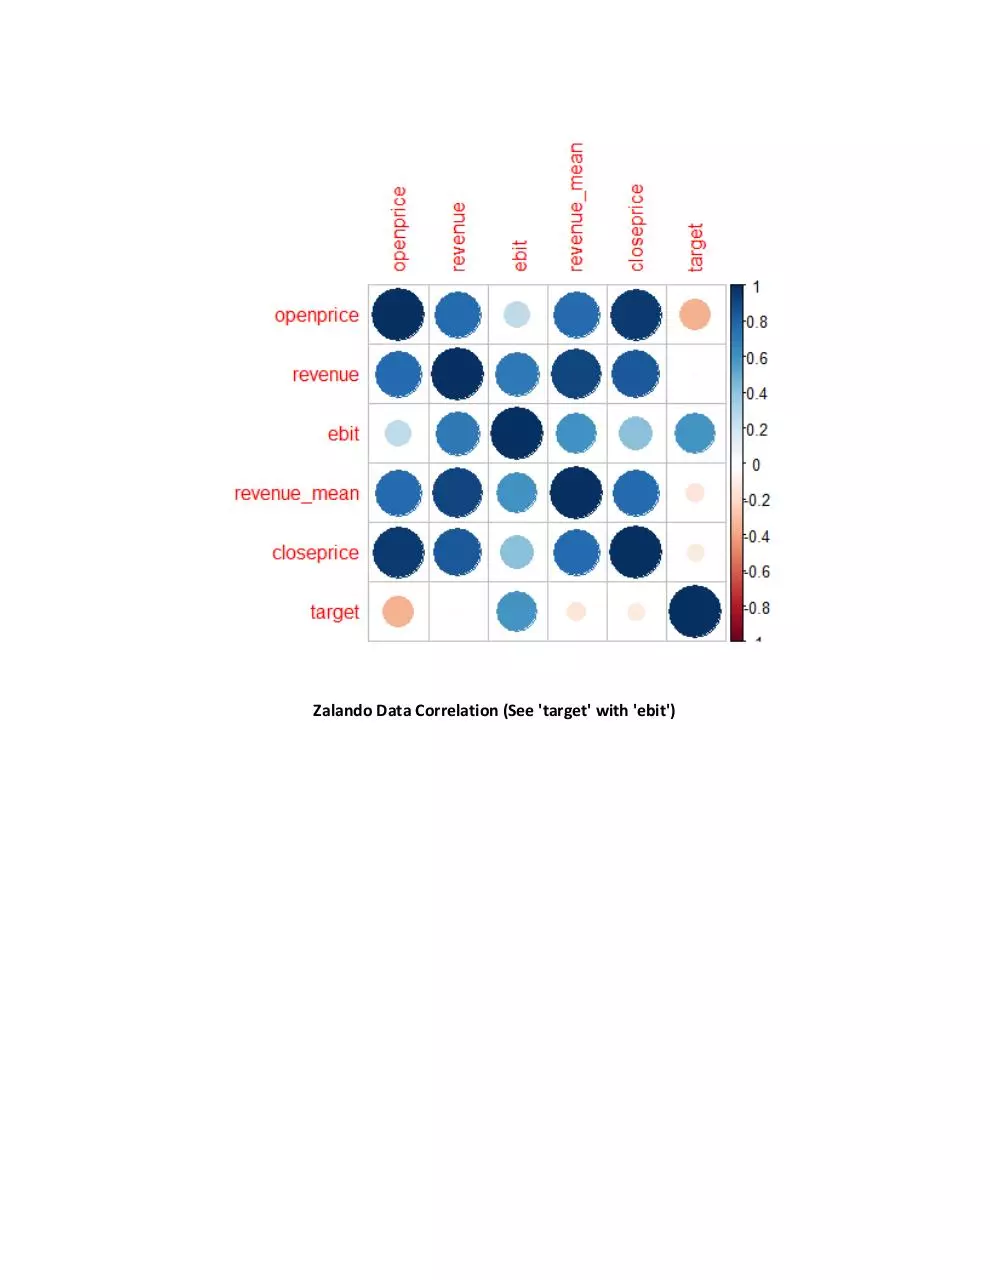
Next was a quick print out of correlations between the data, so I could assess how the data correlates
with the buy/sell signals. Zalando showed a strong positive correlation with EBIT data, Zooplus had
strong positive correlation with all data points (mainly; revenue, EBIT and revenue mean), and Telefonica
showed negative correlation with all main data points. This was confirmed with the plots below. (Blue is
positive correlation, Red is negative correlation and the size is the strength of correlation. 'target' is our
wanted buy/sell signals.)
Zalando Data Correlation (See 'target' with 'ebit')
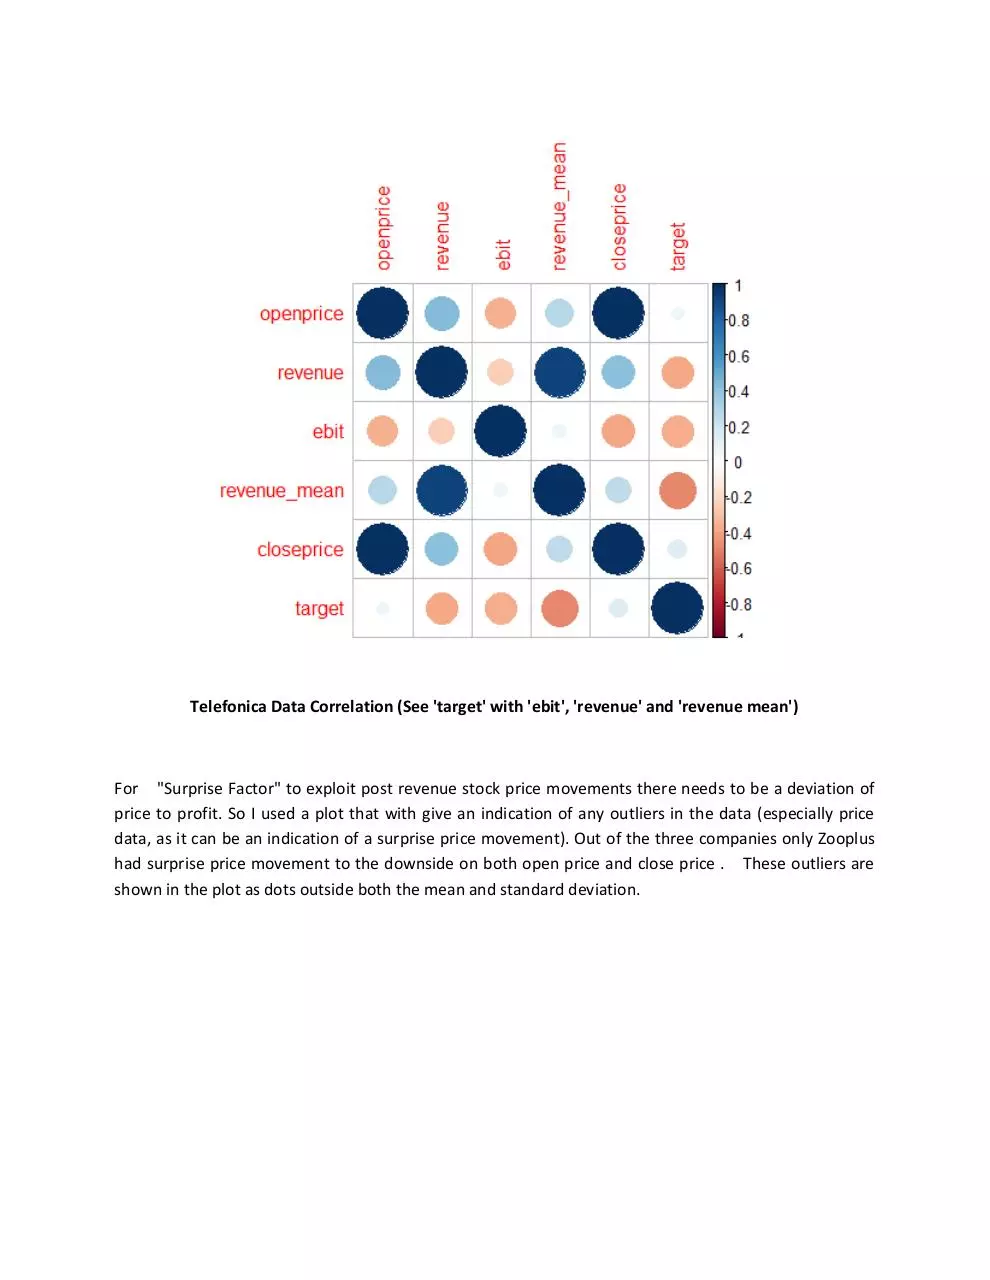
Zooplus Data Correlation (See 'target' with 'ebit', 'revenue' and 'revenue mean')
Telefonica Data Correlation (See 'target' with 'ebit', 'revenue' and 'revenue mean')
For "Surprise Factor" to exploit post revenue stock price movements there needs to be a deviation of
price to profit. So I used a plot that with give an indication of any outliers in the data (especially price
data, as it can be an indication of a surprise price movement). Out of the three companies only Zooplus
had surprise price movement to the downside on both open price and close price . These outliers are
shown in the plot as dots outside both the mean and standard deviation.
Zooplus Outliers (see the dots below open price and close price)
I also confirmed the above deviation, with a plot of the deviations from close price and open price for
each trading day, for each company. Zalando had standard deviation range of between 0 - 2.75 SD, but
most of the data points were on the small end. Telefonica had the smallest standard deviation range
which was between 0 - 0.06 SD. But Zooplus had the largest with a range of 0 - 6 SD and with 40% of data
points above 3 SD. See plot below.
Zooplus Price Standard Deviations
With Zooplus having a strong bias to the sell side, a strong positive correlation with revenue, EBIT and
revenue mean. Together with known surprise downside price movement and large price deviations for
profit. Zooplus would be the most eligible for the new strategy "Surprise Factor".
Part 2:
After analysing the data I preceded to develop a predictive model on all companies data. However the
dataset for each company was small with only 10 data points, which made testing and accuracy hard.
Also some predictive models don't run if there is not enough data. Two I wished I could have tried were
'Stochastic Gradient Boosting' and 'Least Squares Support Vector Machine'. I continued on with 'Neural
Networks with Feature Extraction', 'Multi-Layer Perceptron with Weight Decay' and 'Support Vector
Machine with Linear Kernel'. I have had good results with these models before and with more time I
could test others.
Initial testing on the data for each company was done using the CARET Test Harness. (CARET Classification And REgression Training; is a package for R). Results for Zalando showed a 87.5% accuracy
for 'Neural Networks with Feature Extraction' with the other two models being a good second with
62.5% accuracy (for both). Zooplus showed similar results to Zalando with 'Neural Networks with Feature
Extraction' having an accuracy of 80%, 'Multi-Layer Perceptron with Weight Decay' having 65%, and
'Support Vector Machine with Linear Kernel' having 60%. Lastly Telefonica showed a similar trend in
results with 'Neural Networks with Feature Extraction' having an accuracy of 100%, 'Multi-Layer
Perceptron with Weight Decay' having 50%, and 'Support Vector Machine with Linear Kernel' having
62.5%. It is hard to see any real significance in these results due to the small datasets, but 'Neural
Networks with Feature Extraction' seemed to work well.
Zalando Results
Zooplus Results
Telefonica Results
Next I tried to run the 'Neural Networks with Feature Extraction' model as a standalone model outside
the CARET Test Harness. Sometimes it can give better results. I noticed the output of data form the
'Neural Networks with Feature Extraction' model was different, which was not accepted by the
confusionMatrix function. After looking at the results manually I found the accuracy to be inconclusive.
I also tried to group the results of the 'Neural Networks with Feature Extraction' model and
'Multi-Layer Perceptron with Weight Decay' model in an ensemble, and have a 'Multi-Layer
Perceptron' model predict a better result accuracy. But this only gave an accuracy of 63%.
Finally, I tested the 'Neural Networks with Feature Extraction' model for each company's dataset with
an out of sample data that the model had not seen. All three datasets achieved 100% accuracy, which
given the small size of each dataset is meet with caution. In the process I saved the trained model for
each company to file.
Utilities:
Research was done using R-3.3.1-win and RStudio 0.99.903 on Windows 7 OS with i7 Intel processor.
All the files below are to be saved in the Libraries\Documents directory of windows and in
C:\program files\R\R-3.3.1\bin\
Associated Files:
Zalando_Executable.R – executable program which outputs a buy or sell signal with a
corresponding confidence level for the Zalando data (ZAL).
Zooplus_Executable.R – executable program which outputs a buy or sell signal with a
corresponding confidence level for the Zooplus data (ZO1).
Telefonica_Executable.R – executable program which outputs a buy or sell signal with a
corresponding confidence level for the Telefonica data (O2D).
<ticker symbol>.csv – holds the Historical tick data for Telefonica Deutschland Holding AG, Zooplus
AG, and Zalando SE companies.
<ticker symbol>_dates.csv – holds: For each financial quarter, the file contains the date of the
trading update (when the company published an update of the upcoming financial results), and the
official announcement date (when the company published the financial results).
revenue_and_estimates.csv – The file contains quarterly revenue results, analysts estimates, and
EBIT data.
To Execute:
Download and install R-3.3.1-win(or higher) and RStudio on the operating system. Place all the
associated files in the Libraries\Documents directory of windows. Next open the RStudio program,
then go 'File > Open File' and look for the '<company_name>_Executable.R' file you want, and then
click open. The script should appear in the top left window of the program. To run the script go 'Code >
Run Region > Run All' or press 'Ctrl + Alt + R'. The results will be shown in the bottom left window of
the program.
How the
'<company_name>_Executable.R' scripts work, is that they remove the last data point and
then train with the rest of the data. When the training is finished the script then predicts the last point,
displaying the probability of a BUY signal and the probability of a SELL signal.
Part 3:
With Zalando revenue forcasts expected to miss what the analysts are forcasting, I would say the best
strategy would be a breakout strategy using stop orders in case of a surprise price movement. Please see
the folders titled 'Breakout_StrategyA' and 'Breakout_StrategyB'. Inside each is a breakout strategy
Pseudo Source Code and another folder titled 'Report'. The 'Report' folder holds a HTML file with picture
files. If you click on the HTML file to open it, you will see all the statistics for that particular strategy and
each picture in the HTML is clickable too. 'Breakout_StrategyA' was developed to be higher profit with
low drawdown, but also has a low percentage of wins. 'Breakout_StrategyB' was developed to be higher
percentage of wins with low drawdown, but also has a lower profit.
Another strategy I would consider would be a scalping strategy, due to the low deviation of price
movement as seen in the above analysis. Please see the folders titled 'Scalper_Strategy'. Inside this
folder you will see the same again, Pseudo Source Code and another folder titled 'Report'. Again click
on the HTML file in the 'Report' folder to see all the statistics for that particular strategy.
'Scalper_Strategy' was developed to make a profit on smaller price movements with very high
percentage of wins .
Please note: that all the strategies would be more reliable if they were developed using minute or tick
data with a much longer time history (not 'daily' data).
For further enquires regarding the project, call me on:
PHONE: +(689)-87787242
or via
EMAIL: whitelight_1@hotmail.com
Hayden BROWN
Download Final Report
Final_Report.pdf (PDF, 211.18 KB)
Download PDF
Share this file on social networks
Link to this page
Permanent link
Use the permanent link to the download page to share your document on Facebook, Twitter, LinkedIn, or directly with a contact by e-Mail, Messenger, Whatsapp, Line..
Short link
Use the short link to share your document on Twitter or by text message (SMS)
HTML Code
Copy the following HTML code to share your document on a Website or Blog
QR Code to this page

This file has been shared publicly by a user of PDF Archive.
Document ID: 0001933479.