Fleet Strategies in a Changing Market (PDF)
File information
Title: PowerPoint Presentation
Author: Craig Wilson
This PDF 1.5 document has been generated by Microsoft® PowerPoint® 2013, and has been sent on pdf-archive.com on 23/10/2013 at 22:43, from IP address 70.102.x.x.
The current document download page has been viewed 793 times.
File size: 7.3 MB (60 pages).
Privacy: public file


File preview
Session Three:
Fleet Strategies in a
Changing Market
Moderator:
● Pete Seidlitz, President, Bristol Associates
Panelists:
● Frank Baistrocchi, Senior Director, Sales,
Bombardier
● Phil Blum, VP Aircraft Acquisition, Planning
and Performance, FedEx
● Tom Doxey, VP Fleet & Corporate Finance,
Allegiant Travel Company
● Torque Zubeck, Managing Director, Financial
Planning & Analysis, Alaska Airlines
October 22, 2013
This presentation and the discussion today will include forward-looking statements regarding the performance of Alaska
Air Group or its subsidiaries. Actual results may differ materially from these projections. Please see our most recent
Annual Report on Form 10-K for additional information concerning factors that could cause results to differ.
Updated 8-13-2013
Overview of Alaska Air Group
Parent company of Alaska Airlines and Horizon Air
$5
billion in annual operating revenues
Roughly 3% - 4% of US domestic capacity
A track
record of profitability
- Nine consecutive years of profits
- Profitable 34 of last 40 years
Award-winning
service
Excellent operational performance
Good labor relations
Where we fly
• 19 million
passengers/yr.
• 10,000 employees
• 128 B737 aircraft
• 68 cities served
• 465 daily
departures
Salt Lake City
San Antonio
• 6.8 million
passengers/yr.
• 3,000 employees
• 48 Q400 aircraft
Routes not yet started
PDX – DFW PDX – TUS
PDX – ATL
SEA – COS
ANC – PHX
ANC – LAS
SAN – BOI
SAN – MMH
PDX – RNO SEA – OMA
• 39 cities served
• 335 daily departures
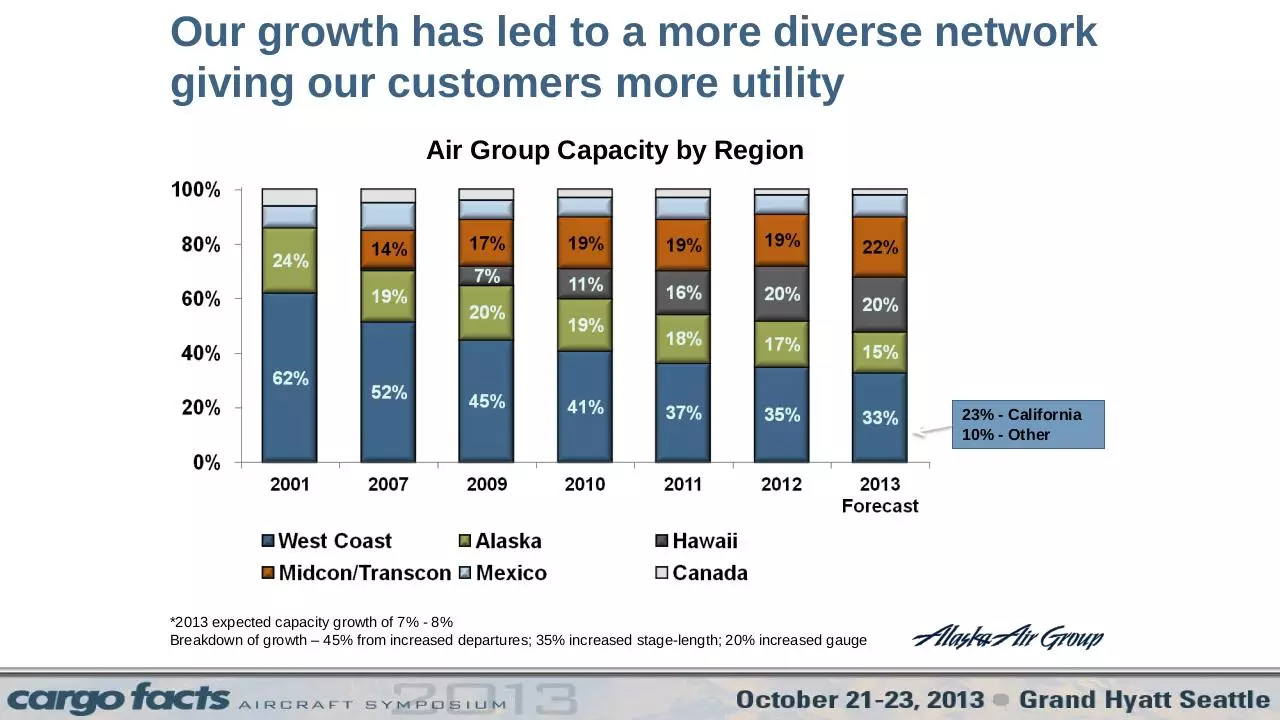
Our growth has led to a more diverse network
giving our customers more utility
Air Group Capacity by Region
23% - California
10% - Other
*2013 expected capacity growth of 7% - 8%
Breakdown of growth – 45% from increased departures; 35% increased stage-length; 20% increased gauge
Our excellent operation helps to reduce costs
and enhances customer satisfaction
1st
2nd
7th
Rankings in 2008-2010 are among the 10 largest domestic airlines.
1st
We have a strong customer preference
“Highest in customer satisfaction among traditional
carriers in North America, six years in a row.”
Performed particularly well in:
• Check-in experience
• Reservation experience
• Boarding/deplaning/baggage
• Flight crew
• Cost and fees
5 FOCUS AREAS
5 YEARS 2012-2017
Alaska’s fleet will grow modestly while retiring
737-400 fleet by 2017
737-900ERs
replacing aging
400 & 700 fleets
737-400 fleet
expected to be
fully retired by
2017
*Estimates based on current fleet plan, which is fluid. Growth options for 2 737-900ER aircraft are available in 2015 and 7 in
2016.
Horizon will add 3 Q400 aircraft this year and has
future options in place for potential growth
*Estimates based on current fleet plan, which is fluid. Growth options for Q400NG aircraft
Our bias has been toward owned vs. leased giving
us more flexibility
Investments such as seat project will improve
revenues and reduce costs.
Retrofit B737-800s and B737-900s with space enhancing Recaro seats.
Incremental Revenue Opportunity*
800/900 Aircraft
Average Seats Added per Aircraft
Total Seats
Average Trips per Day
Total Additional Seats per Day
Assumed Load Factor
Average Fare + Ancillary
Incremental Revenue per Day
Annual Impact
73
6.5
474
3.1
1,469
50%
$177
$130k
~$47m
Equivalent to adding nearly (3) B737-800s.
* Revenue and cost data are estimates.
Cost Reduction*
Average 800/900 Aircraft
Before
After
Cost per Departure
Average Stage Length
Seats per Aircraft
ASMs
$26.1k
1,499
159
239k
10.92¢
$26.2k
1,499
165.5
249k
10.56¢
Trip Cost / ASMs
Percentage Change
-3.3%
Both mainline and regional fleets lead in fuel
efficiency
Fuel Consumption (gallons/seat)
Fuel efficiency of narrow-body aircraft
New order for 50 737900ERs and 737 Max
aircraft will make our
fleet even more fuelefficient
• 1,500 mile stage-length
• 100% load factor
Fuel efficiency of regional aircraft
Better
• 400 statute miles
• 100% load factor
Alaska is Committed to Cargo
• The only mainline US passenger carrier with
dedicated cargo aircraft
• 120 million lbs of freight and mail moved annually
• Network covers over 85 destinations served by
Alaska Air Group
• Strong, profitable business unit of AAG
As part of the Long Term fleet plan, Alaska is
exploring NG 737 freighter conversion
Current Fleet
5 Combis
1 Freighter
Future Fleet*
3-4 NG
Freighter
Conversions
*Estimates based on current fleet plan, which is fluid and subject to change
Thank You
FedEx Express Fleet
Overview
Phil Blum
VP Aircraft Acquisitions, Performance and
Planning
Contents
FedEx Overview
Profit Improvement Program
Fleet Renewal Programs
757, 777, 767
ULD changes
Efficiency Improvements
Fuel Savings Programs
Environmental initiatives
Summary/Recap
FedEx: A Broad Portfolio of Services
FY13 Revenues:
FY13 Profit:
Team Members:
Countries and Territories Served:
$44.3 billion
$2.55 billion
More than 300,000
More than 220
Revenues: 61%
$27.2 billion
Revenues: 24%
$10.6 billion
Revenues: 12%
$5.4 billion
Revenues: 4%
$1.6 billion
*Express, Ground, Freight and Services show segment revenue. Not included in the chart is ($0.4) billion other & eliminations revenue
FedEx Operates the World’s Largest
All-Cargo Jet Fleet
Fleet Type
Count
777F
24
233,300
MD-11F
64
192,600
MD-10-10F/-30F
47 / 16
137,500 / 175,900
767-300F
2
127,100
A300-600F
71
106,600
A310-200F/-300F
16 / 14
83,170
757-200F
92*
63,000
346
43.3M lbs
Trunk Total
*Includes aircraft in modification
Gross Max Structural Payload (lbs)
FedEx Also Owns and Operates the World’s
Largest Turboprop Cargo Fleet
Fleet Type
Count
Gross Max Structural Payload (lbs)
ATR-72
21
17,970
ATR-42
26
12,070
C208
245
2,830
Trunk Total
292
1.4M lbs
Challenging Market Conditions
Stubbornly high fuel prices
Customer migration to lower cost modes of shipment
Customers demanding better value, faster service and more reliable
transportation every year
Environmental considerations are increasing
FedEx Corporation Annual Profit
Improvement Targets
Nearly $1.7 Billion by FY16
Efficiency of Staff
Functions and
Processes
Modernizing our
Air Fleet
U.S. Domestic
Transformation
International Profit
Improvement
Targeted Growth and
Yield Management
Factors Driving Fleet Renewal
Maintain High
Reliability
Aircraft
Age
Rising/High
Fuel Costs
Inefficiency
Supportability
Manufacturer
Support
Environmental Risk &
Regulatory Compliance
Increasing
Maintenance
Costs
Risk Exposure
Multiple Factors Driving Fleet Renewal
Fleet Renewal Programs: 757-200F
727-200F
Last Unit Retired: July 2013
757-200F
Entered Service 2008
Replacing our 727-200Fs and some A310-200Fs.
757 Provides 20% more capacity than the 727-200F
Uses 36% less fuel compared to the 727-200F (on a payload-adjusted-basis) with significantly
lower emissions
Range – 2,600 nautical miles at Maximum Operational Revenue Payload
Fleet Renewal Programs: 777F
43 Orders + 11 Options
Entered Service 2009
777F is the most reliable and efficient twin-engine, long-range cargo aircraft in the world.
18% less fuel and 18% lower emissions than the MD-11F (4,000 nautical mile trip).
17% greater max structural payload than the MD-11F and provides up to 57% greater range.
Provides our customers later cut-off times and delivery times on several long-haul routes.
777Fs are supporting International network growth and redeployment of some MD-11Fs into
domestic/regional operations to replace less-efficient MD-10 aircraft.
Fleet Renewal Actions: 767-300F
767-300F
MD-10
50 Orders + 35 Options
First delivery September 2013
767 offers 30% improvement in fuel efficiency; 29% lower unit cost vs. MD-10
Net payload similar to MD-10
Same ramp “footprint” as MD-10 (fits our standard W/B gate)
Common type rating and synergies in spares, training & tooling with 757s
3,400 nautical mile range at FedEx Express payloads
ULD Efficiency – New Container Types
SAA, AYY, AMJ and LD-3 containers are long-time FedEx mainstays.
LD3 (Wide-body Lower Deck)
AMJ (Wide-body Main Deck)
SAA (Narrow-body Full Contour)
Introduction of new AAD and LD-2 containers will optimize 767.
AAD (Wide-body Main Deck)
LD2 (767 Lower Deck)
AYY (N/B and W/B Main Deck)
Earthsmart Innovations: The FedEx Efficient Container
ULD Type
AMJ
SAA
AYY
LD-3
Current Weight
(lbs)
Weight After
Modification
(lbs)
Weight
Reduction (lbs)
758
550
303
202
607
470
225
164
151
80
78
38
Light weight container modifications will reduce the overall weight
of our existing container types by 19 – 27% each.
When fully implemented, 2.8M gallons of annual fuel will be saved
while CO2 emissions will be reduced by nearly 78M lbs. per year.
Fuel and Carbon Reduction
Goal: Reduce aircraft unit carbon emissions by 30% between 2005 and 2020. We’re on track!
FedEx Fuel Sense Program has reduced air network fuel usage by more than 5% through
improved procedures and best practices. This translates to $200M+/year in fuel savings.
Goal: 30% improvement in our ground vehicle fuel efficiency:
More than 10,000 clean diesel FedEx Express Sprinter vans are now in the FedEx Express
service. These vans are 70% to 100% more efficient than the vehicles they replaced.
364 FedEx Low Emission Hybrid Electric Vehicles and 118 FedEx Zero Emission All Electric
Vehicles were in the FedEx Express fleet by the end of 2012. We are also testing cleanerburning LNG trucks in Dallas, Texas
FedEx Freight has successfully tested synthetic diesel fuel derived from biomass in trucks
at the Birmingham, Ala., service center.
Other Major Environmental Initiatives
Nine solar energy systems installed across FedEx facilities in the US (6) and Europe (3), more
than any other transportation company.
FedEx Express has made LEED certification the standard for newly-built US facilities. Currently
9 FedEx Express buildings are LEED certified.
Since 2006, FedEx Ground has recycled 93 million lbs. of waste, shredding some to provide an
alternative to conventional packing material.
FedEx Office purchased 25,000 megawatt-hours of renewable energy credits (RECs) in 2012 to
support renewable energy generation.
In Summary…
Our operating company strategy is working well
We’re taking the steps necessary to keep our company healthy during the
current challenging economic conditions while fulfilling the Purple Promise
to our customers.
We anticipate some recovery in international but are building our network
to be profitable even if economic conditions remain weak.
Thank You!
Frank Baistrocchi
Senior Director Sales
Bombardier Commercial Aircraft
October, 2013
PRIVATE AND CONFIDENTIAL
© Bombardier Inc. or its subsidiaries. All rights reserved.
Cargo Facts 2013:
Bombardier
Commercial Aircraft
Update
12,800 DELIVERIES IN THE NEXT 20 YEARS
20- TO 149- SEAT COMMERCIAL AIRCRAFT MARKET WILL BE WORTH $646 BILLION
Regional 20-Year Delivery Outlook
Total Deliveries: 12,800 Units
Total Delivery Value: $646 Billion USD
35
Source: Bombardier Commercial Aircraft Market Forecast 2013-2032
PRIVATE AND CONFIDENTIAL
© Bombardier Inc. or its subsidiaries. All rights reserved.
© Bombardier Inc. or its subsidiaries. All rights reserved.
[Units, 20- to 149- seats]
5,650 Deliveries Forecast in
60-99 Seat Regional Aircraft Fleet
20-Year Commercial Aircraft Fleet Forecast
20- to 59-seat
2012
Fleet
Deliveries Retirements
100- to 149-seat
60- to 99-seat
Fleet
2032
2012
Fleet
Deliveries Retirements
Fleet
2032
2012
Fleet
Deliveries Retirements
DEMAND SHIFTING AWAY FROM 20- TO 59-SEAT CATEGORY
36
Source: Bombardier Commercial Aircraft Market Forecast 2013-2032
Fleet
2032
PRIVATE AND CONFIDENTIAL
© Bombardier Inc. or its subsidiaries. All rights reserved.
[Units, 2012-2032]
Lowest Operating Cost
Greater Flexibility
Enhanced Passenger
Experience
Proven Performance
Low Risk
Excellent Reliability
37
PRIVATE AND CONFIDENTIAL
© Bombardier Inc. or its subsidiaries. All rights reserved.
Best Fuel Burn
CRJ Future is Building on a Solid Foundation
The Most Successful Regional Aircraft Program Ever
723
CRJ700/900/1000
FIRM ORDERS AND COUNTING…
Including
60+
AIRLINES
EVERY
10
SECONDS
CRJ TAKES-OFF
FLIGHT HOURS
PASSENGERS
* Program Status Report to June 30,2013
COUNTRIES
34,000,000+
1,200,000,000+
38
50+
99.6%
PROVEN DR
PRIVATE AND CONFIDENTIAL
© Bombardier Inc. or its subsidiaries. All rights reserved.
1,777
Continuous Enhancements Ensure CRJ Aircraft Deliver the Lowest Operating
Cost in the Regional Jet Market Today
4%
• Lowest Fuel Burn per
Seat of any Regional Jet
Fuel Burn Reduction
already in service
48%
17%
Maintenance Cost
Reduction in last 7 years
Lightest OWE
Highest LRC
Cruise Speed
COC cost is for CRJ900 NextGen, European conditions, 500nm, Fuel $3.20/gal
39
• Lowest Operating Cost
• Lowest Direct Maintenance
Cost (DMC) in class
15%
• 2 extra flying days per year
24%
• Lowest Weight Related
Fees (Landing & NAV)
• Shorter Block Times
13%
• Lower Crew Cost
PRIVATE AND CONFIDENTIAL
© Bombardier Inc. or its subsidiaries. All rights reserved.
COC Breakdown
CRJ OPERATORS WORLDWIDE
Operators Aircraft
Scheduled Airlines
57 1,401
Non-Sched. Airlines
21
49
Governments
5
12
Corporations
10
15
1
5
94
1,482
Leasing/ Brokers
Total
SOURCE: FLEET INET, BOMBARDIER. IN-SERVICE AND ON-ORDER AIRCRAFT. FIGURES AS OF JUNE 30TH, 2013
LIVERIES REPRESENT A SAMPLE OF BOMBARDIER OPERATORS
PRIVATE AND CONFIDENTIAL
© Bombardier Inc. or its subsidiaries. All rights reserved.
7 NEW CRJ700/900/1000 OPERATORS, 24 NEW CRJ100/200 OPERATORS SINCE 2010
1
3
RD
EVERY
MOST SUCCESSFUL
IN-PRODUCTION AIRCRAFT
PROGRAM
1,777
FIRM ORDERS
AND COUNTING…
20%
DELIVERED VIA LEASING COMPANIES
SINCE 2011
99.6%
PROVEN DISPATCH RELIABILITY
10
SECONDS A CRJ
TAKES OFF
>5%
ECONOMIC ADVANTAGE VS.
ANTICIPATED COMPETITORS
PRIVATE AND CONFIDENTIAL
© Bombardier Inc. or its subsidiaries. All rights reserved.
CRJ RESULTS SPEAK FOR THEMSELVES
30% Faster Cruise Speed
35% More Cargo Volume
Flexible Cabin Layout and
Enhanced Cabin Comfort
Excellent Field
Performance
Proven 99.5% Dispatch
Reliability
Constantly Expanding
Capabilities
42
PRIVATE AND CONFIDENTIAL
© Bombardier Inc. or its subsidiaries. All rights reserved.
8% Lower cash seat-mile
costs
Q-Series – The World’s Most Successful Turboprops
Including
475
Q400
FIRM ORDERS AND COUNTING…
30+
50+
COUNTRIES
EVERY
16
SECONDS A
Q SERIES TAKES-OFF
OPERATORS
THE Q400 IS THE MOST ECONOMICAL
REGIONAL AIRCRAFT IN ITS CLASS
43
* Program Status Report to June 30,2013
PRIVATE AND CONFIDENTIAL
© Bombardier Inc. or its subsidiaries. All rights reserved.
1,146
Q400 NextGen: Get More REVENUE
30% More Revenue Generating ASMs
+ 17% More Flights
350
30%
More Productive
325
300
+ 11% More Seats (8 to 10)
275
250
60
64
68
72
76
80
Seats
8 Seats: $ 1.9 M in ADDED REVENUE VALUE per Q400*
44
*12-yr NPV at 9% discount rate: Seat value base on spill modeling assuming unconstrained
demand of 50, k-factor = 0.36, c-factor = 1.00, avg fare $100
PRIVATE AND CONFIDENTIAL
© Bombardier Inc. or its subsidiaries. All rights reserved.
Max Cruise Speed (kts)
375
PRIVATE AND CONFIDENTIAL
© Bombardier Inc. or its subsidiaries. All rights reserved.
Q-SERIES OPERATORS WORLDWIDE
Operators Aircraft
Scheduled Airlines
79
830
Non-Sched. Airlines
31
110
Governments
31
76
Corporations
12
18
1
1
154
1,035
Leasing/ Brokers
Total
15+ NEW
CUSTOMERS
SINCE 2010
SOURCE: FLEET INET, BOMBARDIER. IN-SERVICE AND ON-ORDER AIRCRAFT. FIGURES AS OF JUNE 30TH, 2013
LIVERIES REPRESENT A SAMPLE OF BOMBARDIER OPERATORS
100+
COMMITTMENTS IN
RUSSIA IN 2013
Q-SERIES AIRCRAFT
DELIEVERED
475
Q400 FIRM ORDERS
AND COUNTING**
*FAR Part 25
** As of June 30 2013
20%
40
COUNTRIES
PRIVATE AND CONFIDENTIAL
© Bombardier Inc. or its subsidiaries. All rights reserved.
1,100
50
Q400 OPERATORS
IN
DELIVERED VIA LEASING
COMPANIES SINCE 2011
8%
30%
LOWER SEAT MILE COSTS
PROVEN
OVER
#1
MOST SUCCESSFUL
COMMERCIAL
TURBOPROP FAMILY*
NEARLY
Q400 NEXTGEN: NOT A CONVENTIONAL TURBOPROP
FASTER CRUISE
SPEED
99.4%
DISPATCH RELIABILITY
OPENING NEW MARKETS FOR TODAY’S PRODUCTS
PRIVATE AND CONFIDENTIAL
© Bombardier Inc. or its subsidiaries. All rights reserved.
LOI COVERING UP TO 100 Q400 AIRCRAFT FOR RUSSIAN MARKET
100%
CLEANSHEET
DESIGN
4x
50%
SMALLER
NOISE
FOOTPRINT
LOWER NOx
EMISSIONS
20%
LOWER CO2
EMISSIONS
20%
FUEL BURN
ADVANTAGE
15
OPERATORS, CUSTOMERS
& LESSEES AROUND THE
WORLD
15%
SEAT-MILE COST
ADVANTAGE
99.5%
DISPATCH RELIABILITY @ EIS
PRIVATE AND CONFIDENTIAL
© Bombardier Inc. or its subsidiaries. All rights reserved.
CSERIES: CHANGE IS IN THE AIR
100- TO 149-SEAT MARKET: 2010-2020+
• The only 100% new aircraft
• The only aircraft optimized
for this market segment
CS100
Bombardier
E170
Embraer
E175
E190
E195
• 2025+: new aircraft
• 2014: Improved package
Boeing
• 2017: re-engines
• 2018/19: Re-engines +..
737-700
737-800
737-900
Airbus
A319
A320
MRJ70
MHI
SSJ100-75
SSJ100-95
Sukhoi / Irkut
COMAC
New Entrants
Below 100 Seats
50
49
A321
MRJ90
• 2013: Sharklets
• End 2015: re-engines
C919
New Entrant
above 150 Seats
• 2025+: new aircraft
100
150
200
PRIVATE AND CONFIDENTIAL
© Bombardier Inc. or its subsidiaries. All rights reserved.
CS300
CS300
50 Pax
A319neo
12,000 lb. lighter =
50
PRIVATE AND CONFIDENTIAL
© Bombardier Inc. or its subsidiaries. All rights reserved.
CSERIES • 100% NEW AIRCRAFT OPTIMIZATION
Download Fleet Strategies in a Changing Market
Fleet Strategies in a Changing Market.pdf (PDF, 7.3 MB)
Download PDF
Share this file on social networks
Link to this page
Permanent link
Use the permanent link to the download page to share your document on Facebook, Twitter, LinkedIn, or directly with a contact by e-Mail, Messenger, Whatsapp, Line..
Short link
Use the short link to share your document on Twitter or by text message (SMS)
HTML Code
Copy the following HTML code to share your document on a Website or Blog
QR Code to this page

This file has been shared publicly by a user of PDF Archive.
Document ID: 0000130136.