Moderating Volatility and Equity Exposures (PDF)
File information
Author: Reece, Christopher
This PDF 1.5 document has been generated by Microsoft® Word 2013, and has been sent on pdf-archive.com on 24/03/2015 at 23:08, from IP address 86.162.x.x.
The current document download page has been viewed 500 times.
File size: 375.05 KB (6 pages).
Privacy: public file


File preview
Strategy and Solutions Research
28 January 2015
Strategy and Solutions Research
Moderating Volatility and Equity Exposures
j
A note on potential changes to the CBOE’s standard VIX formula, investigating methods of increasing
responsiveness to diminishing fear in equity markets.
Christopher Reece
christopher.reece@marsh.com
(+44)7875 427 220
Strategy and Solutions Research
Moderating Volatility and Equity
Exposures
28 January 2015
Executive Summary
-
Contents:
Executive Summary
Active Underperformance
Illustrative Back-test
Enhancing Volatility Triggers
Review
Opportunities
1
1
1
4
5
6
-
-
Simple volatility triggers lag bullish moves in equities.
A hangover of expected volatility in instruments such as the VIX can cause actively managed
funds to miss significant rallies at the start of bull markets.
By incorporating trends in the range of options strike prices into the VIX formula, redeployment
of capital can be accelerated.
Whilst inclusion of such trends should prove beneficial when purchasing stocks, the sudden,
erratic spikes for which the VIX is well known will render them of little use at the beginning of
bear markets.
Funds could be allocated to specific sectors in response to the new VIX formula with more
speculative investments favoured as the updated volatility value falls into its bottom quartile.
Active Underperformance
It has been established that the majority of active funds fail to beat their benchmarks during bull
markets. The opposite would appear to be true as asset values decline, with a Vanguard study in
2008 finding 60% of active funds successfully outperformed during the last bear market. The
contributing factors to this underperformance are easily identifiable; significant and often complex fee
structures, cash positions, and active hedges work together to lessen returns when equities advance.
Additionally, fund governance requirements and psychological factors play a role, particularly at the
beginning of bull market cycles.
Whilst hedge funds and prop. shops are more likely to utilise aggressive strategies in volatile markets,
reallocating capital into equities, more conservative managers such as those running pension and
mutual funds will often find themselves corsetted by board limitations. For example maximum levels
of portfolio volatility, articulated in the funds investment policy statements, may disincentivise
managers from attempting to call the bottom and subsequent rally from a bear market.
Beginning with a simple back-test highlighting this issue around the inflection points between bull and
bear markets, this note proposes modifications to the VIX formula in an attempt to remedy the
problem.
Illustrative Back-test
The back-test, VSP(20), below utilises a binary trigger of 20.00 on the VIX to either allocate funds into
an ETF tracking the S&P500 or simply hold cash. This trigger was chosen as a result of the following,
high-level information.
There is a low negative correlation of -0.46 between the VIX and the S&P500 (Jan’00-June’14),
as illustrated in figure 1.
Although not strictly mean-reverting the 14-year average of the VIX is 21.16, with the instrument
spending c60% of all trading days below 22.00.
Further strategy variables are detailed below.
1
For further information please contact
Christopher Reece at christopher.reece@marsh.com.
Strategy and Solutions Research
28 January 2015
Development: Sector Rotation
Figure 1: Correlation – S&P500 vs. VIX (01/01/00 – 31/06/14)
2000
55
80
1800
70
1600
60
40
1400
50
1200
25
1000
40
800
10
2000
30
600
2004
2008
XLU - Utilities
2012
XLK - Technology
20
400
10
200
Performance of sector specific ETF’s
(01/01/00 – 31/06/14).
0
2000
0
2002
2004
2006
2008
CORRELATION (-0.46)
S&P500
2010
2012
2014
VIX
120%
80%
40%
0%
XLU
XLK
-40%
-80%
Bull
Bear
Performance of sector specific ETF’s during
bear (‘00-‘03, ‘08-‘09) / bull (‘04-‘07, ‘10-‘13)
markets.
In back testing the VSP(20) an initial account balance of USD100,000.00 was assumed, with a fixed
200 point Stop / Loss and no Limit order. The strategy enters into a long position on the first trading
day of each month, when the VIX >20.00. Positions will be held until the close of the final trading day
of the month, subject to the Stop / Loss remaining dormant.
The study utilises data from IG Markets and, as such, may deliver results which differ slightly from
similar examinations employing more widely traded ETF’s (due to varying commission and financing
levels).
Timeframe and Risk Management
Trades were held for a period of one month to minimise the impact of daily market noise and smaller
price swings, and to deliver returns in line with the prevailing volaility. In addition to incurring greater
financing charges it stands to reason that correlation with the markets present perception of volaility
would decrease over a larger timeframe.
Results and Benchmarking
The obvious benchmark for the VSP(20) strategy is the S&P500 itself, comparisons with which can be
seen in figures 2 and 3.
Figure 2: Benchmarking – VSP(20) vs. S&P500 (01/01/00 – 31/06/14)
200,000
180,000
160,000
140,000
120,000
100,000
80,000
60,000
40,000
20,000
0
2000
2002
2004
2006
2008
VSP(20)
2
2010
2012
2014
S&P500
For further information please contact
Christopher Reece at christopher.reece@marsh.com.
Strategy and Solutions Research
28 January 2015
Figure 3: VSP(20) back-test results (01/01/00 – 31/06/14)
VSP(20) vs. S&P500 (Annual)
VSP(20)
188,229.75
88,229.75
88.2
6.3
54.3
4.18
173
94
71
76
23
24
50,000
Final Equity
Profit
Total profit (%)
Annualised profit (%)
In-market (%)
Volatility
Months
Trades
Winning trades
Winning trades (%)
Losing trades
Losing trades (%)
40,000
30,000
20,000
10,000
0
-10,000
All figures USD
-20,000
2003
2000
Year
S&P500
88,376.79
(11,623.21)
(11.6)
(0.8)
100
20.86
173
173
97
56
76
44
2006
2009
2012
VSP(20)
S&P500
+/-
2000
5330.37
(12,139.36)
17,469.73
2001
(1,934.50)
(11,676.59)
9,742.09
2002
1,111.32
(16,420.48)
17,531.80
2003
9,637.46
9,884.66
(247.20)
2004
2,870.55
2,870.55
-
2005
(1,038.97)
(1,038.97)
2006
6,005.37
6,005.37
-
2007
7,281.53
(879.49)
8,161.02
2008
617.90
(39,834.61)
40,452.51
2009
-
11,494.03
(11,494.03)
2010
10,208.93
4,961.74
5,247.19
2011
1,255.14
(4,831.86)
6,087.00
2012
14,760.71
7,857.89
6,902.82
2013
28,182.41
28,182.41
-
-
All figures USD
Although VSP(20) did not utilize leverage to enhance returns, the combination of a wide Stop / Loss
order and aggressive position sizing had the potential to result in significant drawdowns of up to 10%
of total equity. January 2014 saw the back-tests biggest realised monthly loss (-3.14%), whilst the
largest paper loss stood at -4.59% in June 2011. These results are far superior to those of the
S&P500, which experienced ten drawdowns in excess of 10%, with the largest unprotected loss
reaching -23.9%.
Whilst the simple VSP(20) strategy performed well, the shortcomings of inflection point
underperformance are clearly evident and illustrated in figure 4. Much of this 22-month period from
2009-10 saw the hangover from the global economic crisis support the VIX above the 20.00 point
trigger, in spite of a surge in the S&P.
Figure 4: Underperformance – VSP(20) vs. S&P500 (01/03/09 – 30/11/10)
28,000
24,000
20,000
16,000
12,000
8,000
4,000
0
Mar-09
Jul-09
Nov-09
VSP(20)
3
Mar-10
Jul-10
Nov-10
S&P500
For further information please contact
Christopher Reece at christopher.reece@marsh.com.
Strategy and Solutions Research
28 January 2015
Enhancing Volatility Triggers
Increasing Volatility
One potential solution for the latency detailed above could be to increase the sensitivity of the VIX, in
relation to the short term trend of options on the S&P500. Allowing for a more responsive VIX during
periods of heightened, yet steadily decreasing market unrest (such as March 2009), would enable
long positions to be entered into earlier than otherwise condoned by the binary threshold.
Figures 5 and 6 below illustrate both the current VIX formula and the revised version, which looks to
increase the volatility of the indicator in response to trending SPX options interest.
Figure 5: VIX generalised formula
Figure 6: Revised VIX formula
where:
contribution to strike at
x
- contribution to strike at
monthly range of strike prices
if
and (
) < Put / Call Average
or
if
and (
) > Put / Call Average
else
Explanation
Under the standard VIX formula the range of options included within the calculation fluctuates in
response to demand at different prices. Through monitoring the scope and trend of this demand, and
weighting the value of strike prices as a result, the revised formula should prove more responsive to
changes in sentiment among market participants.
Volatility, Variables and Weighting
The revised formula introduces variable, Cj which has the potential to alter the ‘contribution to strike’
value of each individual strike price, dependent on the short term trend of monthly strike prices (x).
Should the range trend lower for three consequtive months, Cj decreases the ‘contribution to strike’
values around F, lessening the VIX at a time when uncertainty in the marketplace is beginning to
decrease. Inversely, if the range of strike prices trends higher for three months in a row, ‘contribution
to strike’ values were be heightened around F to represent increased perceptions of unpredictability.
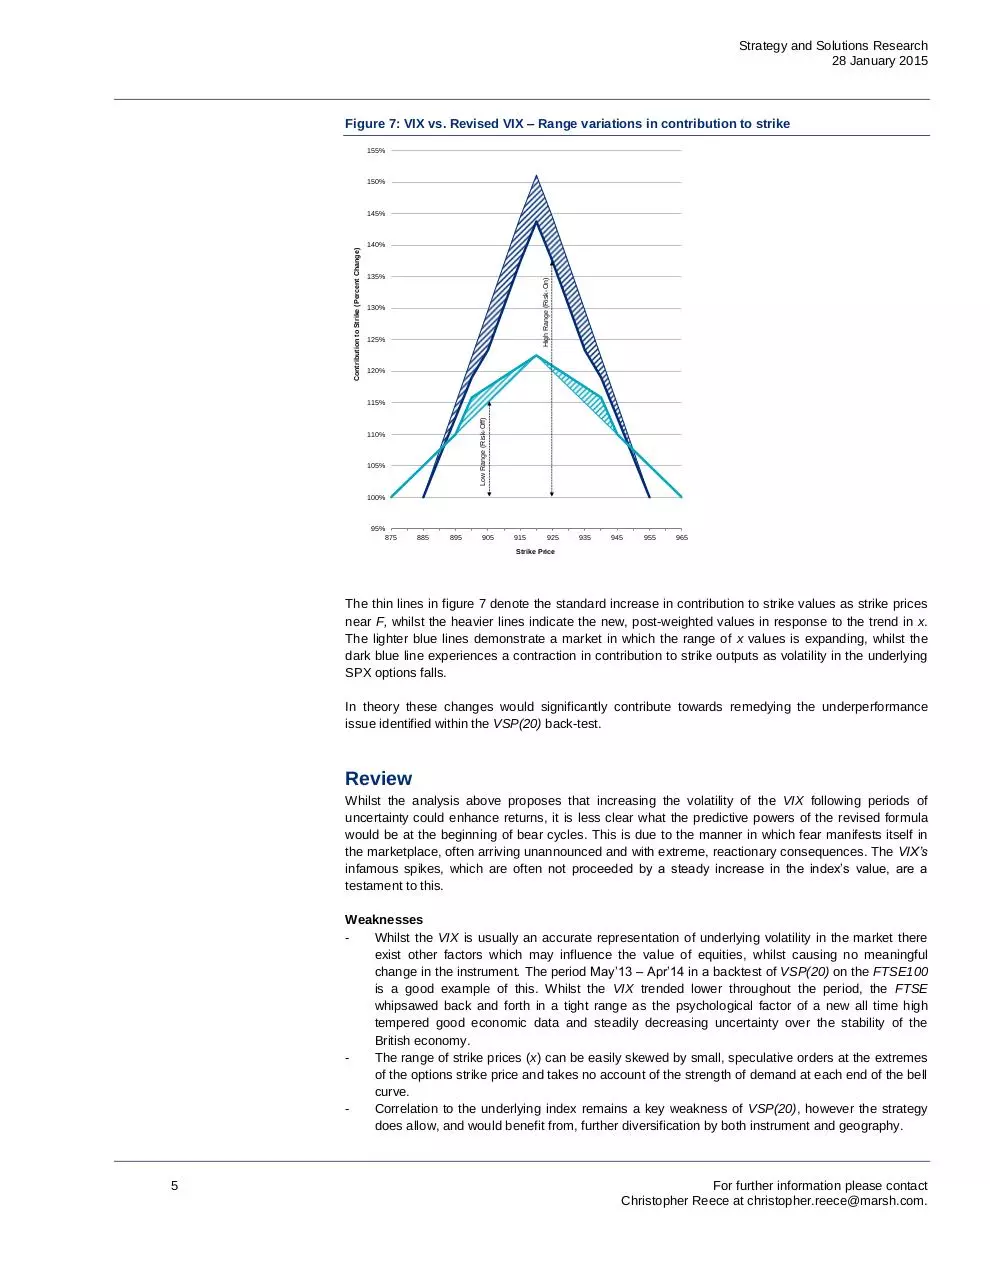
These alterations are illustrated in figure 7 below which details the change in contribution to strike
values for a range of example strike prices, in both of the scenarios above.
4
For further information please contact
Christopher Reece at christopher.reece@marsh.com.
Strategy and Solutions Research
28 January 2015
Figure 7: VIX vs. Revised VIX – Range variations in contribution to strike
155%
150%
140%
135%
High Range (Risk-On)
Contribution to Strike (Percent Change)
145%
130%
125%
120%
Low Range (Risk-Off)
115%
110%
105%
100%
95%
875
885
895
905
915
925
935
945
955
965
Strike Price
The thin lines in figure 7 denote the standard increase in contribution to strike values as strike prices
near F, whilst the heavier lines indicate the new, post-weighted values in response to the trend in x.
The lighter blue lines demonstrate a market in which the range of x values is expanding, whilst the
dark blue line experiences a contraction in contribution to strike outputs as volatility in the underlying
SPX options falls.
In theory these changes would significantly contribute towards remedying the underperformance
issue identified within the VSP(20) back-test.
Review
Whilst the analysis above proposes that increasing the volatility of the VIX following periods of
uncertainty could enhance returns, it is less clear what the predictive powers of the revised formula
would be at the beginning of bear cycles. This is due to the manner in which fear manifests itself in
the marketplace, often arriving unannounced and with extreme, reactionary consequences. The VIX’s
infamous spikes, which are often not proceeded by a steady increase in the index’s value, are a
testament to this.
Weaknesses
Whilst the VIX is usually an accurate representation of underlying volatility in the market there
exist other factors which may influence the value of equities, whilst causing no meaningful
change in the instrument. The period May’13 – Apr’14 in a backtest of VSP(20) on the FTSE100
is a good example of this. Whilst the VIX trended lower throughout the period, the FTSE
whipsawed back and forth in a tight range as the psychological factor of a new all time high
tempered good economic data and steadily decreasing uncertainty over the stability of the
British economy.
The range of strike prices (x) can be easily skewed by small, speculative orders at the extremes
of the options strike price and takes no account of the strength of demand at each end of the bell
curve.
Correlation to the underlying index remains a key weakness of VSP(20), however the strategy
does allow, and would benefit from, further diversification by both instrument and geography.
5
For further information please contact
Christopher Reece at christopher.reece@marsh.com.
Strategy and Solutions Research
28 January 2015
Manipulation
It must be noted that this study’s manipulation of the VIX formula is subject to hindsight bias and,
whilst the 14-year back test period of VSP(20) does encompass a broad range of market conditions,
the revisions proposed above represent remedies to historical events.
Opportunities
Further studies could experiment with combining sector rotational theories to the revised VIX formula.
In place of buying into an ETF tracking a national bourse, sector specific instruments could be
purchased in relation to the value of the enhanced VIX, with more historically speculative areas such
as Technology favoured as x values trend lower, and a more conservative asset allocation into
Utilities as they expand.
6
For further information please contact
Christopher Reece at christopher.reece@marsh.com.
Download Moderating Volatility and Equity Exposures
Moderating Volatility and Equity Exposures.pdf (PDF, 375.05 KB)
Download PDF
Share this file on social networks
Link to this page
Permanent link
Use the permanent link to the download page to share your document on Facebook, Twitter, LinkedIn, or directly with a contact by e-Mail, Messenger, Whatsapp, Line..
Short link
Use the short link to share your document on Twitter or by text message (SMS)
HTML Code
Copy the following HTML code to share your document on a Website or Blog
QR Code to this page

This file has been shared publicly by a user of PDF Archive.
Document ID: 0000217085.