Search Fund Financial Models (PDF)
File information
Title: The Search Fund Bible
Author: Elad Benjamin
This PDF 1.5 document has been generated by Acrobat PDFMaker 9.1 for Word / Adobe PDF Library 9.0, and has been sent on pdf-archive.com on 02/02/2016 at 19:47, from IP address 128.237.x.x.
The current document download page has been viewed 1457 times.
File size: 174.19 KB (6 pages).
Privacy: public file
File preview
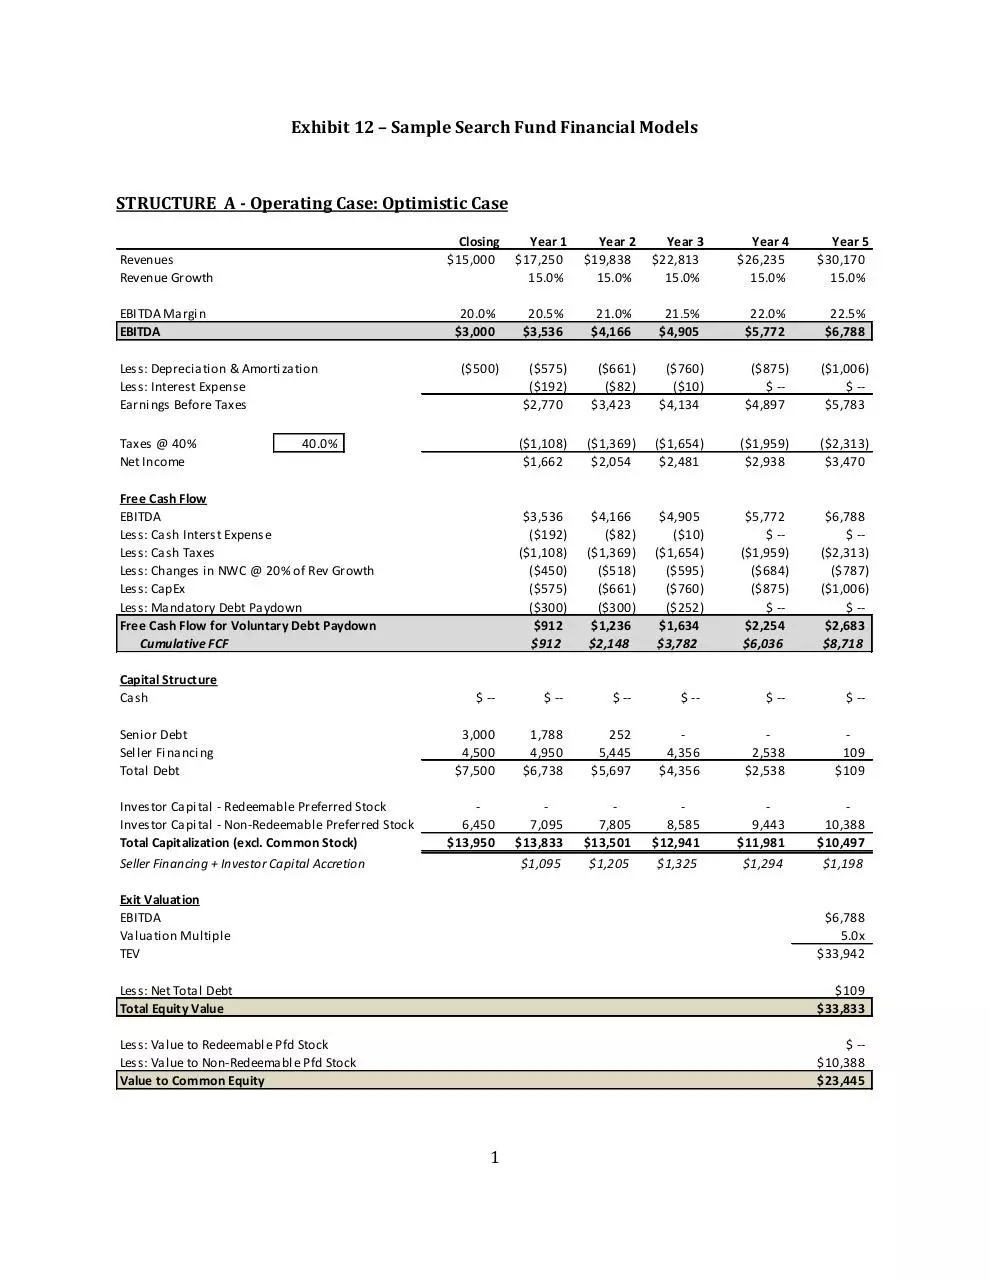
Exhibit 12 – Sample Search Fund Financial Models
STRUCTURE A - Operating Case: Optimistic Case
Year 0
Revenues
Revenue Growth
EBITDA Margin
EBITDA
Less: Depreciation & Amortization
Less: Interest Expense
Earnings Before Taxes
Taxes @ 40%
Net Income
Closing
$15,000
Year 1
$17,250
15.0%
Year 2
$19,838
15.0%
Year 3
$22,813
15.0%
Year 4
$26,235
15.0%
Year 5
$30,170
15.0%
20.0%
$3,000
20.5%
$3,536
21.0%
$4,166
21.5%
$4,905
22.0%
$5,772
22.5%
$6,788
($500)
($575)
($192)
$2,770
($661)
($82)
$3,423
($760)
($10)
$4,134
($875)
$ -$4,897
($1,006)
$ -$5,783
($1,108)
$1,662
($1,369)
$2,054
($1,654)
$2,481
($1,959)
$2,938
($2,313)
$3,470
$3,536
($192)
($1,108)
($450)
($575)
($300)
$912
$912
$4,166
($82)
($1,369)
($518)
($661)
($300)
$1,236
$2,148
$4,905
($10)
($1,654)
($595)
($760)
($252)
$1,634
$3,782
$5,772
$ -($1,959)
($684)
($875)
$ -$2,254
$6,036
$6,788
$ -($2,313)
($787)
($1,006)
$ -$2,683
$8,718
40.0%
Free Cash Flow
EBITDA
Less: Cash Interst Expense
Less: Cash Taxes
Less: Changes in NWC @ 20% of Rev Growth
Less: CapEx
Less: Mandatory Debt Paydown
Free Cash Flow for Voluntary Debt Paydown
Cumulative FCF
Capital Structure
Cash
$ --
$ --
$ --
$ --
$ --
$ --
Senior Debt
Seller Financing
Total Debt
3,000
4,500
$7,500
1,788
4,950
$6,738
252
5,445
$5,697
4,356
$4,356
2,538
$2,538
109
$109
6,450
$13,950
7,095
$13,833
$1,095
7,805
$13,501
$1,205
8,585
$12,941
$1,325
9,443
$11,981
$1,294
10,388
$10,497
$1,198
Investor Capital - Redeemable Preferred Stock
Investor Capital - Non-Redeemable Preferred Stock
Total Capitalization (excl. Common Stock)
Seller Financing + Investor Capital Accretion
Exit Valuation
EBITDA
Valuation Multiple
TEV
$6,788
5.0x
$33,942
Less: Net Total Debt
Total Equity Value
$109
$33,833
Less: Value to Redeemable Pfd Stock
Less: Value to Non-Redeemable Pfd Stock
Value to Common Equity
$ -$10,388
$23,445
1
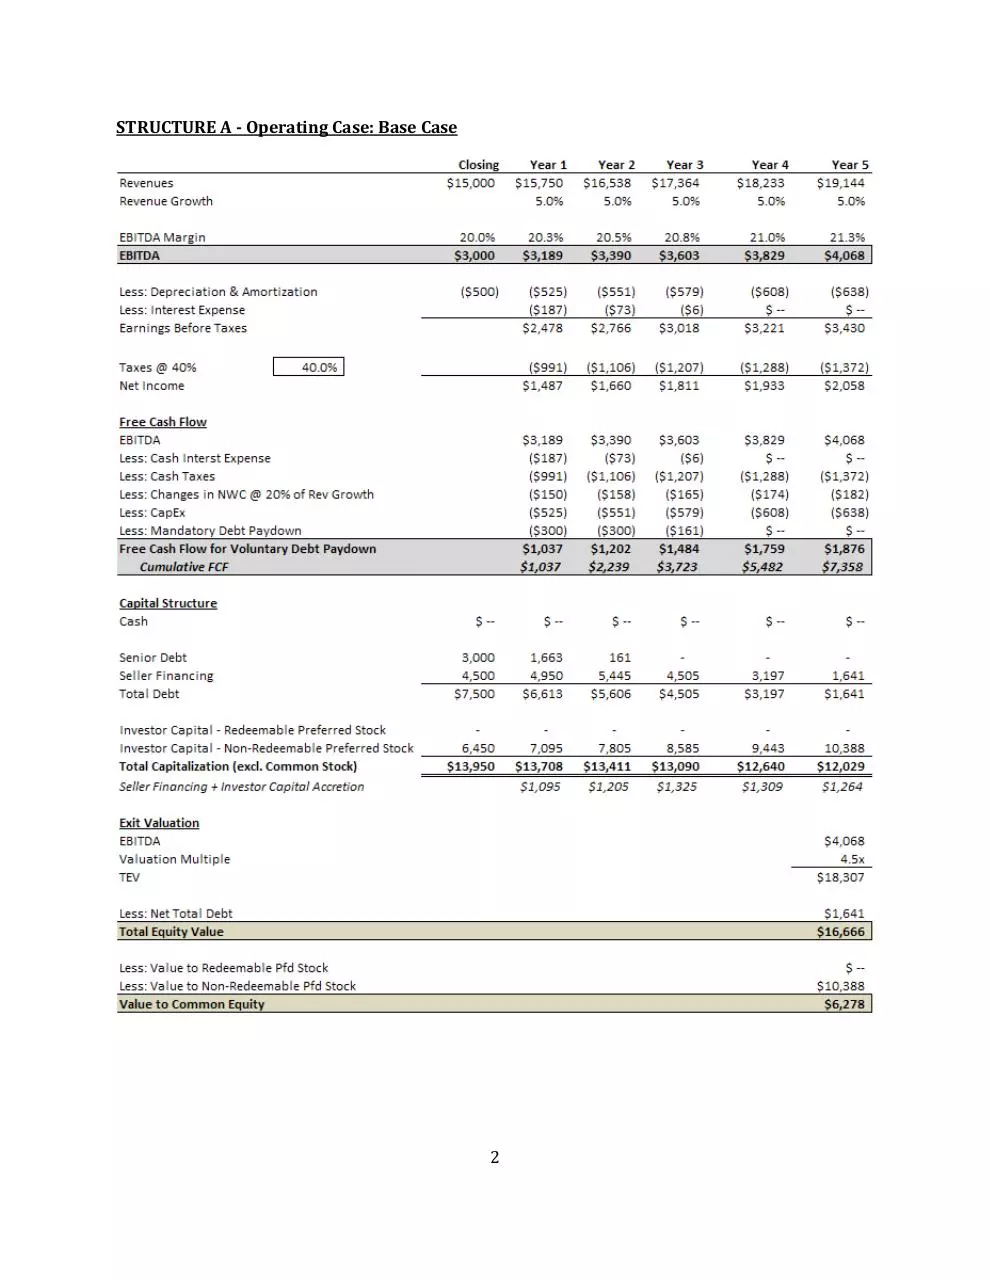
STRUCTURE A - Operating Case: Base Case
2
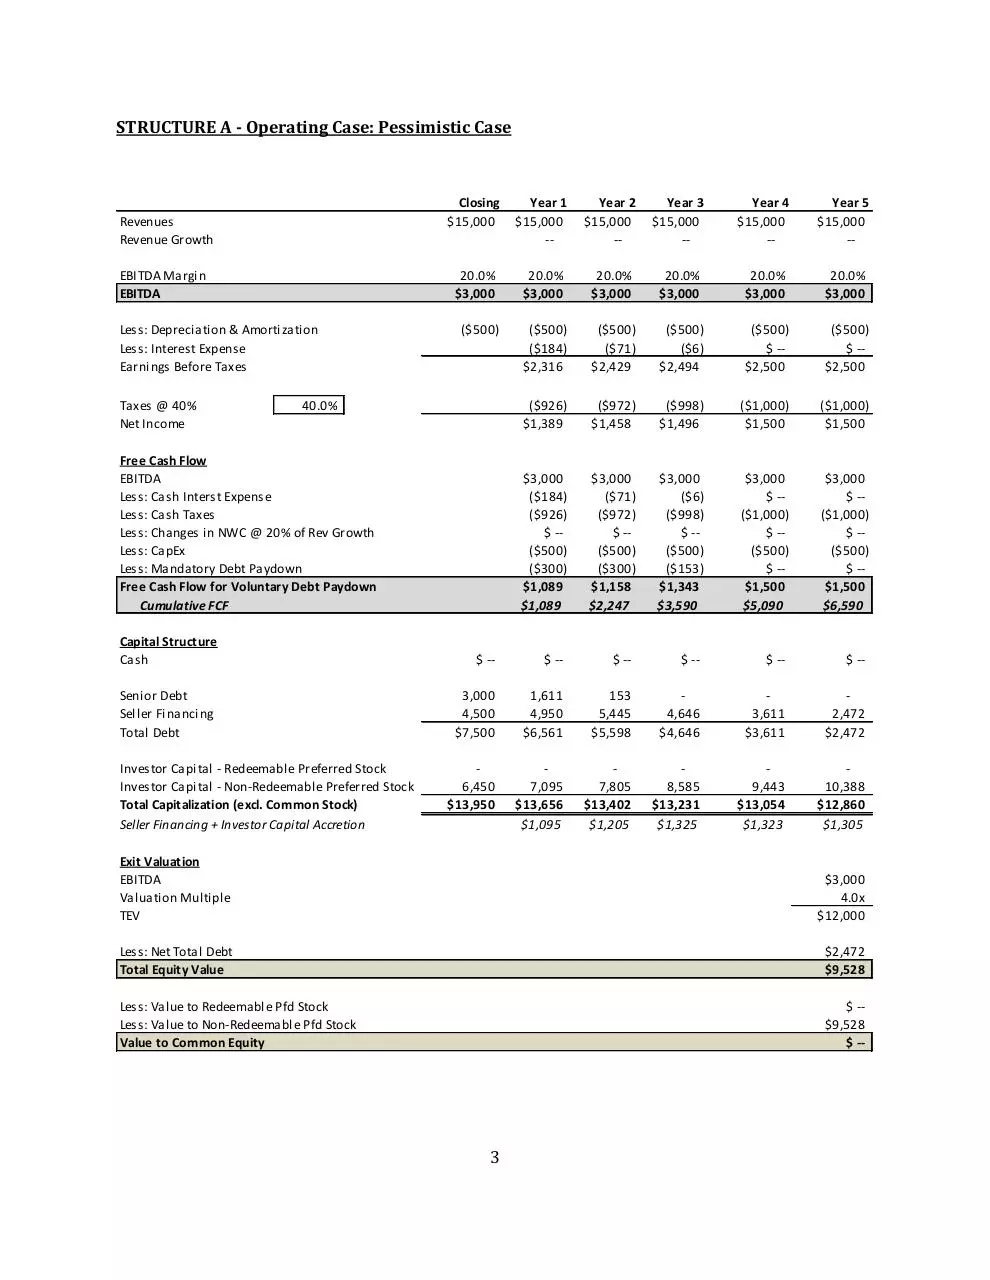
STRUCTURE A - Operating Case: Pessimistic Case
Year 0
Revenues
Revenue Growth
EBITDA Margin
EBITDA
Less: Depreciation & Amortization
Less: Interest Expense
Earnings Before Taxes
Taxes @ 40%
Net Income
Closing
$15,000
Year 1
$15,000
--
Year 2
$15,000
--
Year 3
$15,000
--
Year 4
$15,000
--
Year 5
$15,000
--
20.0%
$3,000
20.0%
$3,000
20.0%
$3,000
20.0%
$3,000
20.0%
$3,000
20.0%
$3,000
($500)
($500)
($184)
$2,316
($500)
($71)
$2,429
($500)
($6)
$2,494
($500)
$ -$2,500
($500)
$ -$2,500
($926)
$1,389
($972)
$1,458
($998)
$1,496
($1,000)
$1,500
($1,000)
$1,500
$3,000
($184)
($926)
$ -($500)
($300)
$1,089
$1,089
$3,000
($71)
($972)
$ -($500)
($300)
$1,158
$2,247
$3,000
($6)
($998)
$ -($500)
($153)
$1,343
$3,590
$3,000
$ -($1,000)
$ -($500)
$ -$1,500
$5,090
$3,000
$ -($1,000)
$ -($500)
$ -$1,500
$6,590
40.0%
Free Cash Flow
EBITDA
Less: Cash Interst Expense
Less: Cash Taxes
Less: Changes in NWC @ 20% of Rev Growth
Less: CapEx
Less: Mandatory Debt Paydown
Free Cash Flow for Voluntary Debt Paydown
Cumulative FCF
Capital Structure
Cash
$ --
$ --
$ --
$ --
$ --
$ --
Senior Debt
Seller Financing
Total Debt
3,000
4,500
$7,500
1,611
4,950
$6,561
153
5,445
$5,598
4,646
$4,646
3,611
$3,611
2,472
$2,472
6,450
$13,950
7,095
$13,656
$1,095
7,805
$13,402
$1,205
8,585
$13,231
$1,325
9,443
$13,054
$1,323
10,388
$12,860
$1,305
Investor Capital - Redeemable Preferred Stock
Investor Capital - Non-Redeemable Preferred Stock
Total Capitalization (excl. Common Stock)
Seller Financing + Investor Capital Accretion
Exit Valuation
EBITDA
Valuation Multiple
TEV
$3,000
4.0x
$12,000
Less: Net Total Debt
Total Equity Value
$2,472
$9,528
Less: Value to Redeemable Pfd Stock
Less: Value to Non-Redeemable Pfd Stock
Value to Common Equity
$ -$9,528
$ --
3
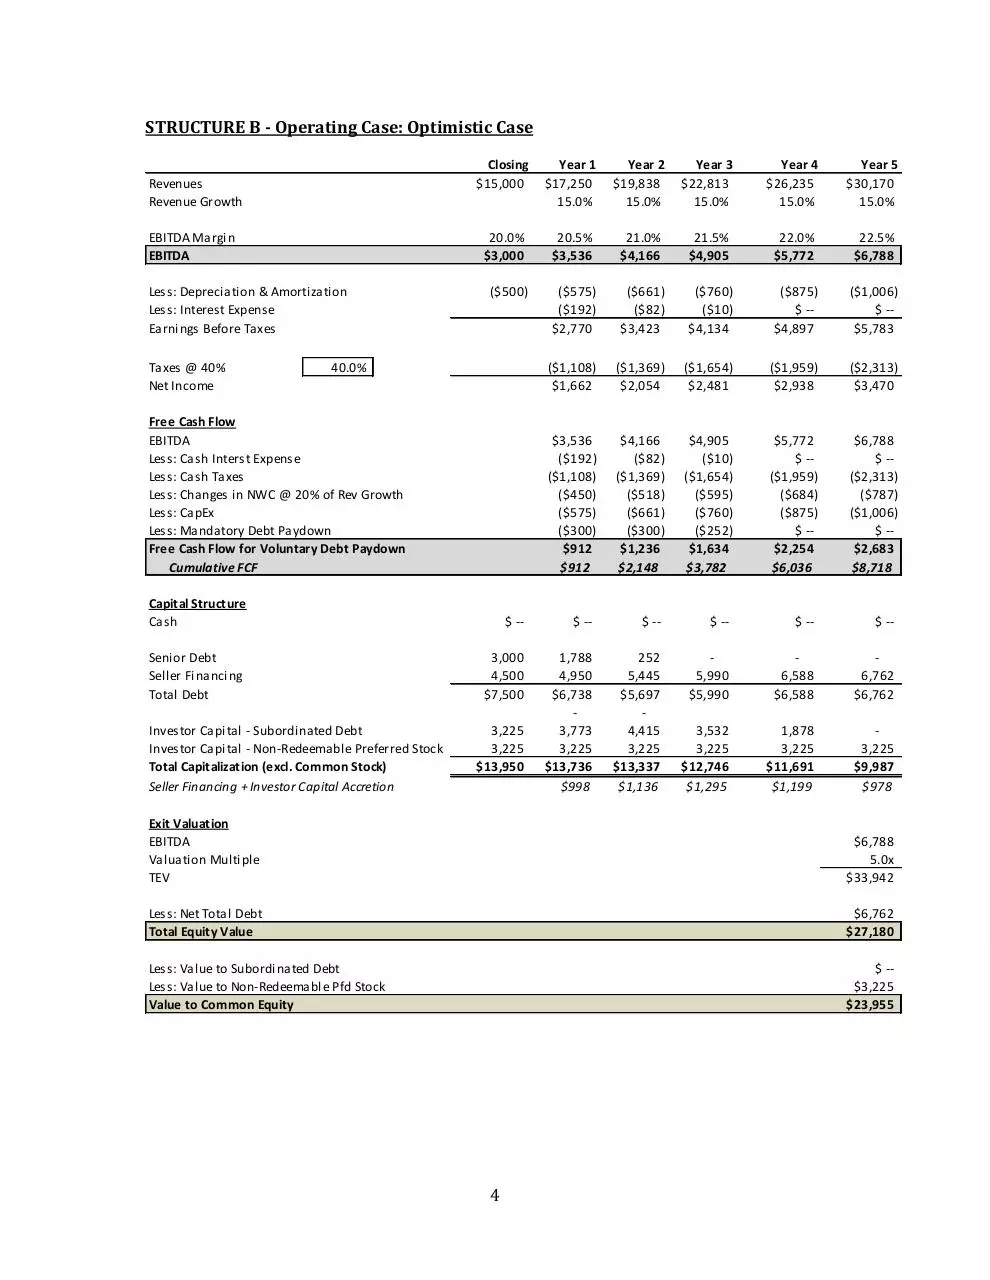
STRUCTURE B - Operating Case: Optimistic Case
Year 0
Revenues
Revenue Growth
EBITDA Margin
EBITDA
Less: Depreciation & Amortization
Less: Interest Expense
Earnings Before Taxes
Taxes @ 40%
Net Income
Closing
$15,000
Year 1
$17,250
15.0%
Year 2
$19,838
15.0%
Year 3
$22,813
15.0%
Year 4
$26,235
15.0%
Year 5
$30,170
15.0%
20.0%
$3,000
20.5%
$3,536
21.0%
$4,166
21.5%
$4,905
22.0%
$5,772
22.5%
$6,788
($500)
($575)
($192)
$2,770
($661)
($82)
$3,423
($760)
($10)
$4,134
($875)
$ -$4,897
($1,006)
$ -$5,783
($1,108)
$1,662
($1,369)
$2,054
($1,654)
$2,481
($1,959)
$2,938
($2,313)
$3,470
$3,536
($192)
($1,108)
($450)
($575)
($300)
$912
$912
$4,166
($82)
($1,369)
($518)
($661)
($300)
$1,236
$2,148
$4,905
($10)
($1,654)
($595)
($760)
($252)
$1,634
$3,782
$5,772
$ -($1,959)
($684)
($875)
$ -$2,254
$6,036
$6,788
$ -($2,313)
($787)
($1,006)
$ -$2,683
$8,718
40.0%
Free Cash Flow
EBITDA
Less: Cash Interst Expense
Less: Cash Taxes
Less: Changes in NWC @ 20% of Rev Growth
Less: CapEx
Less: Mandatory Debt Paydown
Free Cash Flow for Voluntary Debt Paydown
Cumulative FCF
Capital Structure
Cash
$ --
$ --
$ --
$ --
$ --
$ --
Senior Debt
Seller Financing
Total Debt
3,000
4,500
$7,500
1,788
4,950
$6,738
3,773
3,225
$13,736
$998
252
5,445
$5,697
4,415
3,225
$13,337
$1,136
5,990
$5,990
6,588
$6,588
6,762
$6,762
3,532
3,225
$12,746
$1,295
1,878
3,225
$11,691
$1,199
3,225
$9,987
$978
Investor Capital - Subordinated Debt
Investor Capital - Non-Redeemable Preferred Stock
Total Capitalization (excl. Common Stock)
Seller Financing + Investor Capital Accretion
3,225
3,225
$13,950
Exit Valuation
EBITDA
Valuation Multiple
TEV
$6,788
5.0x
$33,942
Less: Net Total Debt
Total Equity Value
$6,762
$27,180
Less: Value to Subordinated Debt
Less: Value to Non-Redeemable Pfd Stock
Value to Common Equity
$ -$3,225
$23,955
4
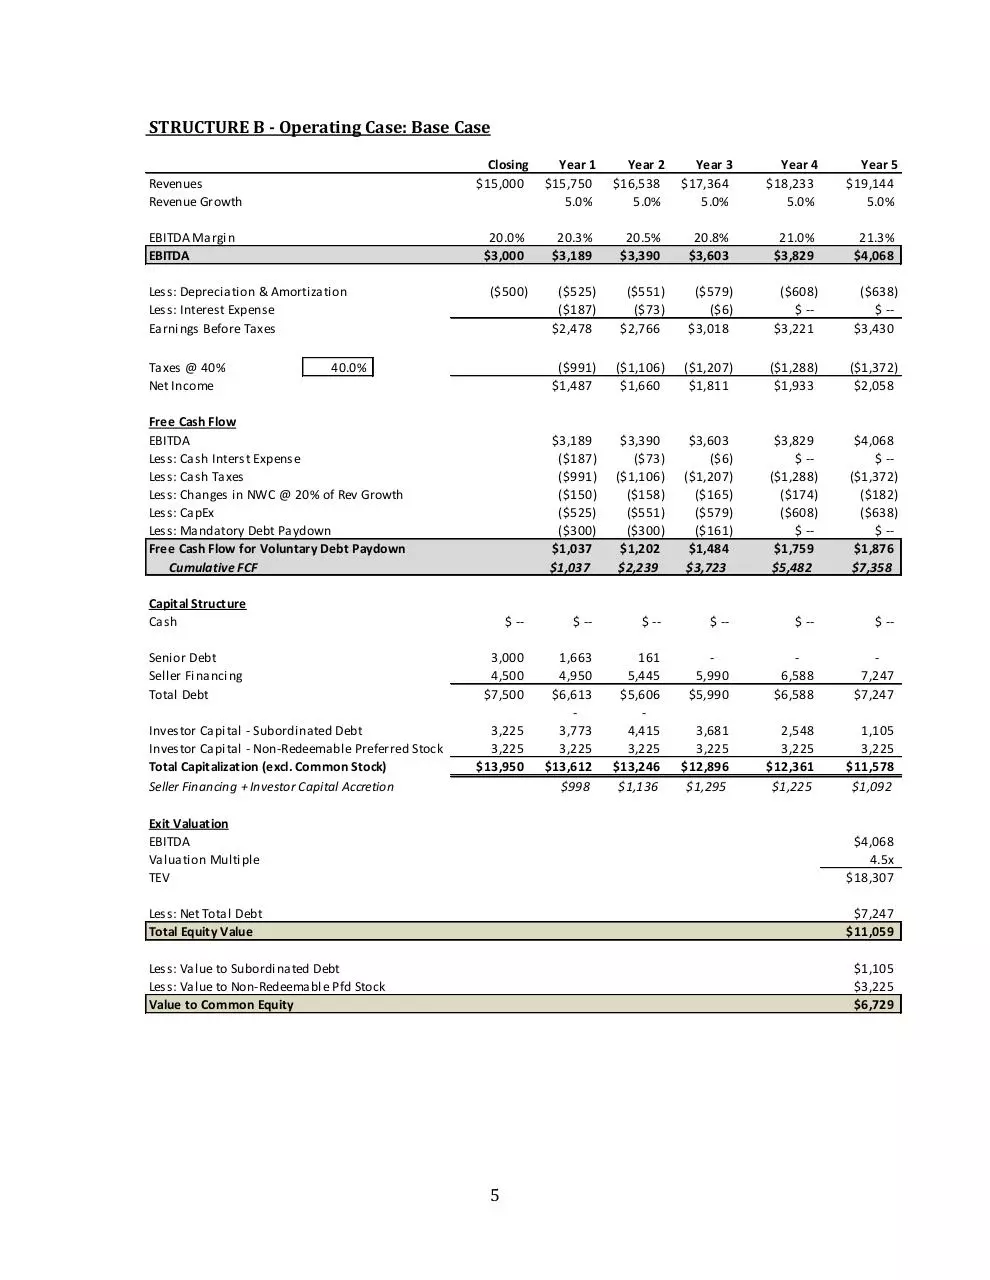
STRUCTURE B - Operating Case: Base Case
Year 0
Revenues
Revenue Growth
EBITDA Margin
EBITDA
Less: Depreciation & Amortization
Less: Interest Expense
Earnings Before Taxes
Taxes @ 40%
Net Income
Closing
$15,000
Year 1
$15,750
5.0%
Year 2
$16,538
5.0%
Year 3
$17,364
5.0%
Year 4
$18,233
5.0%
Year 5
$19,144
5.0%
20.0%
$3,000
20.3%
$3,189
20.5%
$3,390
20.8%
$3,603
21.0%
$3,829
21.3%
$4,068
($500)
($525)
($187)
$2,478
($551)
($73)
$2,766
($579)
($6)
$3,018
($608)
$ -$3,221
($638)
$ -$3,430
($991)
$1,487
($1,106)
$1,660
($1,207)
$1,811
($1,288)
$1,933
($1,372)
$2,058
$3,189
($187)
($991)
($150)
($525)
($300)
$1,037
$1,037
$3,390
($73)
($1,106)
($158)
($551)
($300)
$1,202
$2,239
$3,603
($6)
($1,207)
($165)
($579)
($161)
$1,484
$3,723
$3,829
$ -($1,288)
($174)
($608)
$ -$1,759
$5,482
$4,068
$ -($1,372)
($182)
($638)
$ -$1,876
$7,358
40.0%
Free Cash Flow
EBITDA
Less: Cash Interst Expense
Less: Cash Taxes
Less: Changes in NWC @ 20% of Rev Growth
Less: CapEx
Less: Mandatory Debt Paydown
Free Cash Flow for Voluntary Debt Paydown
Cumulative FCF
Capital Structure
Cash
$ --
$ --
$ --
$ --
$ --
$ --
Senior Debt
Seller Financing
Total Debt
3,000
4,500
$7,500
1,663
4,950
$6,613
3,773
3,225
$13,612
$998
161
5,445
$5,606
4,415
3,225
$13,246
$1,136
5,990
$5,990
6,588
$6,588
7,247
$7,247
3,681
3,225
$12,896
$1,295
2,548
3,225
$12,361
$1,225
1,105
3,225
$11,578
$1,092
Investor Capital - Subordinated Debt
Investor Capital - Non-Redeemable Preferred Stock
Total Capitalization (excl. Common Stock)
Seller Financing + Investor Capital Accretion
3,225
3,225
$13,950
Exit Valuation
EBITDA
Valuation Multiple
TEV
$4,068
4.5x
$18,307
Less: Net Total Debt
Total Equity Value
$7,247
$11,059
Less: Value to Subordinated Debt
Less: Value to Non-Redeemable Pfd Stock
Value to Common Equity
$1,105
$3,225
$6,729
5
STRUCTURE B - Operating Case: Pessimistic Case
Year 0
Revenues
Revenue Growth
EBITDA Margin
EBITDA
Less: Depreciation & Amortization
Less: Interest Expense
Earnings Before Taxes
Taxes @ 40%
Net Income
Closing
$15,000
Year 1
$15,000
--
Year 2
$15,000
--
Year 3
$15,000
--
Year 4
$15,000
--
Year 5
$15,000
--
20.0%
$3,000
20.0%
$3,000
20.0%
$3,000
20.0%
$3,000
20.0%
$3,000
20.0%
$3,000
($500)
($500)
($184)
$2,316
($500)
($71)
$2,429
($500)
($6)
$2,494
($500)
$ -$2,500
($500)
$ -$2,500
($926)
$1,389
($972)
$1,458
($998)
$1,496
($1,000)
$1,500
($1,000)
$1,500
$3,000
($184)
($926)
$ -($500)
($300)
$1,089
$1,089
$3,000
($71)
($972)
$ -($500)
($300)
$1,158
$2,247
$3,000
($6)
($998)
$ -($500)
($153)
$1,343
$3,590
$3,000
$ -($1,000)
$ -($500)
$ -$1,500
$5,090
$3,000
$ -($1,000)
$ -($500)
$ -$1,500
$6,590
40.0%
Free Cash Flow
EBITDA
Less: Cash Interst Expense
Less: Cash Taxes
Less: Changes in NWC @ 20% of Rev Growth
Less: CapEx
Less: Mandatory Debt Paydown
Free Cash Flow for Voluntary Debt Paydown
Cumulative FCF
Capital Structure
Cash
$ --
$ --
$ --
$ --
$ --
$ --
Senior Debt
Seller Financing
Total Debt
3,000
4,500
$7,500
1,611
4,950
$6,561
3,773
3,225
$13,559
$998
153
5,445
$5,598
4,415
3,225
$13,238
$1,136
5,990
$5,990
6,588
$6,588
7,247
$7,247
3,822
3,225
$13,036
$1,295
2,972
3,225
$12,785
$1,249
1,977
3,225
$12,449
$1,164
Investor Capital - Subordinated Debt
Investor Capital - Non-Redeemable Preferred Stock
Total Capitalization (excl. Common Stock)
Seller Financing + Investor Capital Accretion
3,225
3,225
$13,950
Exit Valuation
EBITDA
Valuation Multiple
TEV
$3,000
4.0x
$12,000
Less: Net Total Debt
Total Equity Value
$7,247
$4,753
Less: Value to Subordinated Debt
Less: Value to Non-Redeemable Pfd Stock
Value to Common Equity
$1,977
$2,776
$ --
6
Download Search-Fund-Financial-Models
Search-Fund-Financial-Models.pdf (PDF, 174.19 KB)
Download PDF
Share this file on social networks
Link to this page
Permanent link
Use the permanent link to the download page to share your document on Facebook, Twitter, LinkedIn, or directly with a contact by e-Mail, Messenger, Whatsapp, Line..
Short link
Use the short link to share your document on Twitter or by text message (SMS)
HTML Code
Copy the following HTML code to share your document on a Website or Blog
QR Code to this page

This file has been shared publicly by a user of PDF Archive.
Document ID: 0000337139.