MORI Leadership Independence September 2016 (PDF)
File information
Title: spomw31pol.wyp
Author: jebroughton
This PDF 1.4 document has been generated by PScript5.dll Version 5.2.2 / GPL Ghostscript 8.71, and has been sent on pdf-archive.com on 15/09/2016 at 10:08, from IP address 62.25.x.x.
The current document download page has been viewed 353 times.
File size: 240 KB (33 pages).
Privacy: public file


File preview
Page 1
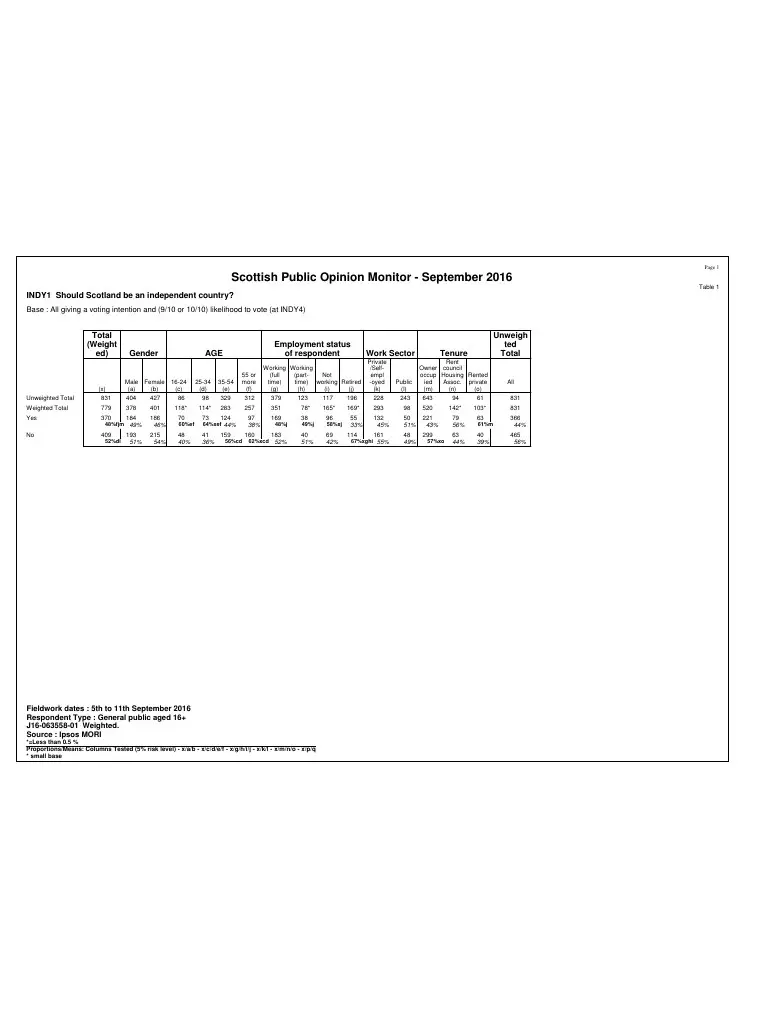
Scottish Public Opinion Monitor - September 2016
Table 1
INDY1 Should Scotland be an independent country?
Base : All giving a voting intention and (9/10 or 10/10) likelihood to vote (at INDY4)
Total
(Weight
ed)
(x)
Gender
Male Female
(a)
(b)
Employment status
of respondent
AGE
16-24
(c)
25-34
(d)
35-54
(e)
55 or
more
(f)
Work Sector
Working Working
(full
(partNot
time)
time) working Retired
(g)
(h)
(i)
(j)
Public
(l)
Tenure
Rent
Owner council
occup Housing Rented
ied
Assoc. private
(m)
(n)
(o)
All
Unweighted Total
831
404
427
86
98
329
312
379
117
196
228
243
643
94
61
831
Weighted Total
779
378
401
118*
114*
283
257
351
78*
165*
169*
293
98
520
142*
103*
831
Yes
370
186
46%
70
73
169
38
96
48%j
49%j
58%xj
132
45%
50
51%
221
43%
79
56%
63
60%ef
124
64%xef 44%
61%m
366
44%
215
54%
48
40%
41
36%
183
52%
40
51%
69
42%
161
48
49%
299
63
44%
40
39%
465
56%
No
184
48%fjm 49%
409
52%di
193
51%
159
56%cd
97
38%
160
62%xcd
123
Private
/Selfempl
-oyed
(k)
Unweigh
ted
Total
Fieldwork dates : 5th to 11th September 2016
Respondent Type : General public aged 16+
J16-063558-01 Weighted.
Source : Ipsos MORI
*=Less than 0.5 %
Proportions/Means: Columns Tested (5% risk level) - x/a/b - x/c/d/e/f - x/g/h/i/j - x/k/l - x/m/n/o - x/p/q
* small base
55
33%
114
67%xghi 55%
57%xo
Page 2
Scottish Public Opinion Monitor - September 2016
Table 2
INDY1 Should Scotland be an independent country?
Base : All giving a voting intention and (9/10 or 10/10) likelihood to vote (at INDY4)
Total
(Weigh
ted)
(x)
Unweig
hted
Urban/rural Total
Affluence of area
20% zones
1 Most
deprived
(a)
2
(b)
3
(c)
4
(d)
5 Least
deprived
(e)
Urban
(f)
Rural
(g)
Unweighted Total
831
95
126
159
171
193
557
187
831
Weighted Total
779
109*
132*
148*
136
170
534
162*
831
Yes
370
48%
67
409
No
52%af
74
50%
64
47%
71
42%
275
62%xe
67
51%
42
38%
65
49%
74
50%
72
53%
99
259
48%
Fieldwork dates : 5th to 11th September 2016
Respondent Type : General public aged 16+
J16-063558-01 Weighted.
Source : Ipsos MORI
*=Less than 0.5 %
Proportions/Means: Columns Tested (5% risk level) - x/a/b/c/d/e - x/f/g
* small base
58%a
52%x
69
42%
366
44%
94
58%
465
56%
Page 3
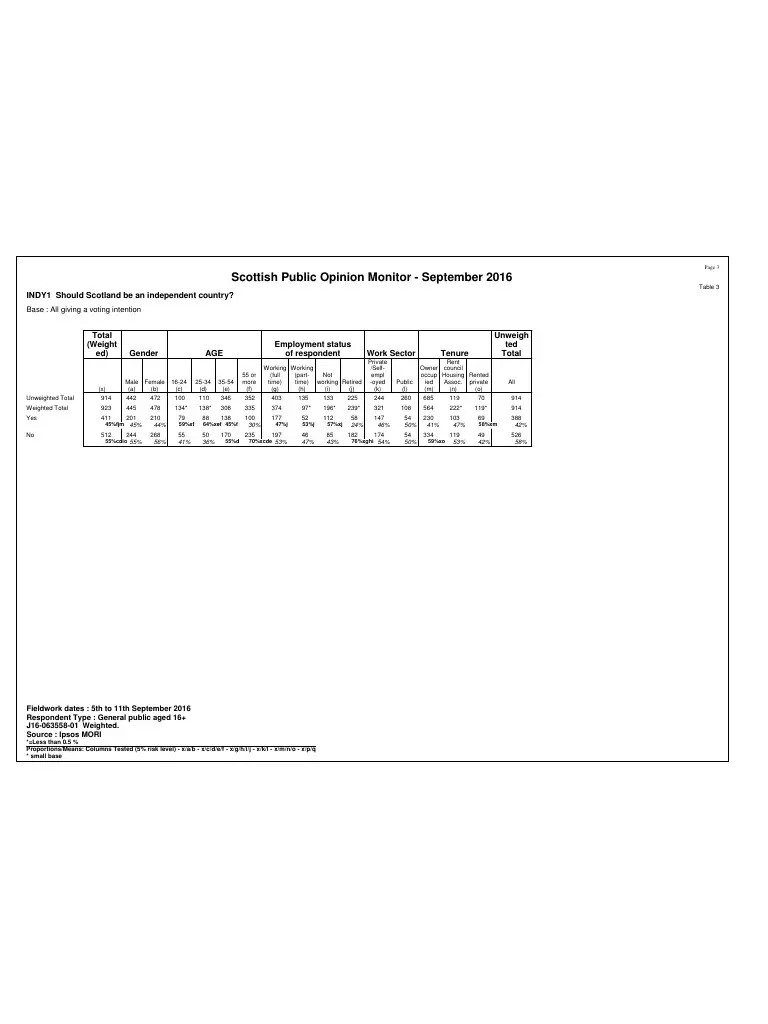
Scottish Public Opinion Monitor - September 2016
Table 3
INDY1 Should Scotland be an independent country?
Base : All giving a voting intention
Total
(Weight
ed)
(x)
Gender
Male Female
(a)
(b)
Employment status
of respondent
AGE
16-24
(c)
25-34
(d)
35-54
(e)
55 or
more
(f)
Work Sector
Working Working
(full
(partNot
time)
time) working Retired
(g)
(h)
(i)
(j)
Public
(l)
Tenure
Rent
Owner council
occup Housing Rented
ied
Assoc. private
(m)
(n)
(o)
All
Unweighted Total
914
442
472
100
110
346
352
403
133
225
244
260
685
119
70
914
Weighted Total
923
445
478
134*
138*
308
335
374
97*
196*
239*
321
108
564
222*
119*
914
Yes
411
210
44%
79
88
138
177
52
112
59%xf
64%xef 45%f
100
30%
268
56%
55
41%
50
36%
235
197
No
201
45%fjm 45%
512
244
55%cdio 55%
170
55%d
47%j
70%xcde 53%
135
Private
/Selfempl
-oyed
(k)
Unweigh
ted
Total
53%j
57%xj
46
47%
85
43%
Fieldwork dates : 5th to 11th September 2016
Respondent Type : General public aged 16+
J16-063558-01 Weighted.
Source : Ipsos MORI
*=Less than 0.5 %
Proportions/Means: Columns Tested (5% risk level) - x/a/b - x/c/d/e/f - x/g/h/i/j - x/k/l - x/m/n/o - x/p/q
* small base
58
24%
182
147
46%
54
50%
230
41%
103
47%
69
58%xm
388
42%
174
54
50%
334
119
53%
49
42%
526
58%
76%xghi 54%
59%xo
Page 4
Scottish Public Opinion Monitor - September 2016
Table 4
INDY1 Should Scotland be an independent country?
Base : All giving a voting intention
Total
(Weigh
ted)
(x)
Unweig
hted
Urban/rural Total
Affluence of area
20% zones
1 Most
deprived
(a)
2
(b)
3
(c)
4
(d)
5 Least
deprived
(e)
Urban
(f)
Rural
(g)
Unweighted Total
914
110
141
174
190
202
607
210
914
Weighted Total
923
144*
163*
166*
164*
190
632
195
914
Yes
411
45%
70
49%
69
42%
79
47%
80
49%
82
43%
512
73
51%
94
58%
87
53%
84
51%
107
57%
No
55%f
Fieldwork dates : 5th to 11th September 2016
Respondent Type : General public aged 16+
J16-063558-01 Weighted.
Source : Ipsos MORI
*=Less than 0.5 %
Proportions/Means: Columns Tested (5% risk level) - x/a/b/c/d/e - x/f/g
* small base
306
48%x
326
52%
74
38%
388
42%
120
62%
526
58%
Page 5
Scottish Public Opinion Monitor - September 2016
Table 5
INDY1 Should Scotland be an independent country?
Base : All 9/10 or 10/10 likelihood to vote (at INDY4)
Total
(Weight
ed)
Gender
Male Female
(a)
(b)
(x)
Employment status
of respondent
AGE
16-24
(c)
25-34
(d)
35-54
(e)
55 or
more
(f)
Work Sector
Private
Working Working
/Self(full
(partNot
empl
time)
time) working Retired -oyed
(g)
(h)
(i)
(j)
(k)
Tenure
Rent
Owner council
occup Housing Rented
ied
Assoc. private
(m)
(n)
(o)
All
Unweighted Total
883
427
456
90
104
357
326
409
124
202
243
262
687
100
62
883
Weighted Total
821
397
424
122*
123*
305
266
375
83*
174*
173
311
106
554
148*
105*
883
Yes
370
186
44%
70
73
169
96
45%j
38
46%
193
49%
215
51%
48
39%
41
34%
183
49%
40
48%
69
40%
41
5%
18
4%
23
5%
4
3%
8
7%
24
6%
5
6%
8
5%
3
2%
2
*
2
*
-
-
-
-
1
1%
*
*
No
184
45%fjm 46%
409
50%d
Undecided
Refused
124
58%xef 60%xef 41%
159
52%d
21
7%
1
*
97
37%
160
60%xcd
8
3%
*
*
*
*
131
Public
(l)
Unweigh
ted
Total
Fieldwork dates : 5th to 11th September 2016
Respondent Type : General public aged 16+
J16-063558-01 Weighted.
Source : Ipsos MORI
*=Less than 0.5 %
Proportions/Means: Columns Tested (5% risk level) - x/a/b - x/c/d/e/f - x/g/h/i/j - x/k/l - x/m/n/o - x/p/q
* small base
55%j
55
32%
114
132
43%
50
47%
221
40%
79
53%
63
60%xm
366
41%
161
48
45%
299
63
43%
40
38%
465
53%
33
6%
5
3%
2
2%
49
6%
1
*
1
1%
-
66%xghi 52%
18
6%
-
8
7%
*
*
54%x
3
*
Page 6
Scottish Public Opinion Monitor - September 2016
Table 6
INDY1 Should Scotland be an independent country?
Base : All 9/10 or 10/10 likelihood to vote (at INDY4)
Total
(Weigh
ted)
1 Most
deprived
(a)
(x)
Unweig
hted
Urban/rural Total
Affluence of area
20% zones
2
(b)
3
(c)
5 Least
deprived
(e)
4
(d)
Urban
(f)
Rural
(g)
Unweighted Total
883
97
131
171
183
203
583
202
883
Weighted Total
821
111*
138*
156*
147
177
555
175
883
Yes
370
45%
67
No
Undecided
Refused
74
47%
64
44%
71
40%
275
61%xe
67
48%
409
50%
42
38%
65
47%
74
47%
72
49%
99
41
5%
2
2%
6
4%
7
4%
11
8%
-
-
1
1%
-
2
*
Fieldwork dates : 5th to 11th September 2016
Respondent Type : General public aged 16+
J16-063558-01 Weighted.
Source : Ipsos MORI
*=Less than 0.5 %
Proportions/Means: Columns Tested (5% risk level) - x/a/b/c/d/e - x/f/g
* small base
56%a
6
4%
-
69
39%
366
41%
259
47%
94
54%
465
53%
20
4%
12
7%
49
6%
1
*
*
*
3
*
50%x
Page 7
Scottish Public Opinion Monitor - September 2016
Table 7
INDY1 Should Scotland be an independent country?
Base : All
Total
(Weight
ed)
Gender
108
121
388
376
447
148
147
236
264
292
749
134
73
1000
521
143*
152*
343
355
409
105*
216*
248*
345
123
615
241*
123*
1000
210
40%
79
88
138
100
28%
177
52
112
268
51%
55
39%
50
33%
235
197
9
6%
476
1000
479
244
51%cdil 51%
Undecided
Refused
65
Rent
Owner council
occup Housing Rented
ied
Assoc. private
(m)
(n)
(o)
524
1000
512
Public
(l)
Tenure
35-54
(e)
Weighted Total
No
Working Working
(full
(partNot
time)
time) working Retired
(g)
(h)
(i)
(j)
Private
/Selfempl
-oyed
(k)
25-34
(d)
Unweighted Total
201
41%fjm 42%
Work Sector
16-24
(c)
Male Female
(a)
(b)
411
AGE
Unweigh
ted
Total
55 or
more
(f)
(x)
Yes
Employment status
of respondent
6%j
27
6%
38
7%
12
1%
7
1%
6
1%
55%xef 58%xef 40%f
-
170
43%j
50%d
66%xcde 48%
10
7%
31
9%
14
4%
29
7%
3
2%
4
1%
6
2%
6
2%
58
23%
147
43%
54
44%
230
37%
103
43%
69
56%xm
388
39%
174
54
44%
334
119
49%
49
40%
526
53%
43
7%
16
6%
4
3%
75
8%
8
1%
4
1%
1
1%
11
1%
49%j
52%xj
46
43%
85
39%
8
7%
17
8%
6
2%
19
6%
3
1%
3
1%
5
1%
-
Fieldwork dates : 5th to 11th September 2016
Respondent Type : General public aged 16+
J16-063558-01 Weighted.
Source : Ipsos MORI
*=Less than 0.5 %
Proportions/Means: Columns Tested (5% risk level) - x/a/b - x/c/d/e/f - x/g/h/i/j - x/k/l - x/m/n/o - x/p/q
* small base
182
All
73%xghi 50%
14
11%x
2
1%
54%x
Page 8
Scottish Public Opinion Monitor - September 2016
Table 8
INDY1 Should Scotland be an independent country?
Base : All
Total
(Weigh
ted)
(x)
Unweig
hted
Urban/rural Total
Affluence of area
20% zones
1 Most
deprived
(a)
2
(b)
3
(c)
5 Least
deprived
(e)
4
(d)
Urban
(f)
Rural
(g)
Unweighted Total
1000
116
151
195
209
216
654
233
1000
Weighted Total
1000
151*
174*
181
182*
201
677
213
1000
Yes
411
41%
70
47%
69
40%
79
43%
80
44%
82
41%
512
51%
73
49%
94
54%
87
48%
84
46%
107
53%
Undecided
65
6%
4
3%
10
6%
12
7%
15
8%
Refused
12
1%
3
2%
2
1%
3
2%
3
2%
No
Fieldwork dates : 5th to 11th September 2016
Respondent Type : General public aged 16+
J16-063558-01 Weighted.
Source : Ipsos MORI
*=Less than 0.5 %
Proportions/Means: Columns Tested (5% risk level) - x/a/b/c/d/e - x/f/g
* small base
306
74
35%
388
39%
326
48%
120
56%
526
53%
11
5%
36
5%
16
7%
75
8%
1
*
9
1%
3
1%
11
1%
45%x
Page 9
Scottish Public Opinion Monitor - September 2016
Table 9
INDY2. As you may know, the UK voted to leave the European Union in a referendum held in June 2016.
Did this event change how you would vote in a future referendum on Scottish independence or not?
Base : All giving a view yes or no, on whether Scotland should be an independent country
Total
(Weight
ed)
Gender
Male Female
(a)
(b)
(x)
Employment status
of respondent
AGE
16-24
(c)
Private
Working Working
/Self55 or
(full
(partNot
empl
25-34 35-54 more time)
time) working Retired -oyed
(d)
(e)
(f)
(g)
(h)
(i)
(j)
(k)
Unweighted Total
914
442
472
100
110
346
352
403
Weighted Total
923
445
478
134*
138*
308
335
374
Yes, the EU referendum
result changed how I
would vote in a future
independence referendum
141
No, the EU referendum
result has not changed
how I would vote in a
future independence
referendum
731
Don't know/unsure
15%f
69
15%
359
79%dil 81%
51
6%m
18
4%
72
15%
29
372
78%
101
75%
34
7%
4
3%
22%f
Work Sector
27
20%
244
260
685
119
70
914
239*
321
108
564
222*
119*
914
77
79%
136
69%
1
1%
20
24
6%
Fieldwork dates : 5th to 11th September 2016
Respondent Type : General public aged 16+
J16-063558-01 Weighted.
Source : Ipsos MORI
*=Less than 0.5 %
Proportions/Means: Columns Tested (5% risk level) - x/a/b - x/c/d/e/f - x/g/h/i/j - x/k/l - x/m/n/o - x/p/q
* small base
All
225
92
252
284
294
82%d 85%xd 79%
67%
18
5%
Rent
Owner council
occup Housing Rented
ied
Assoc. private
(m)
(n)
(o)
196*
40
20%
11
4%
Tenure
133
19
20%
14%xe
34
10%
97*
56
15%
19
46
15%
135
Public
(l)
Unweigh
ted
Total
10%j
23
10%
210
88%xi
6
2%
48
15%
25
23%x
90
16%
27
12%
19
16%
138
15%
256
80%
78
73%
452
80%
179
80%
88
74%
749
82%
17
5%
5
4%
22
4%
16
7%
12
10%
27
3%
Download MORI - Leadership - Independence - September 2016
MORI - Leadership - Independence - September 2016.pdf (PDF, 240 KB)
Download PDF
Share this file on social networks
Link to this page
Permanent link
Use the permanent link to the download page to share your document on Facebook, Twitter, LinkedIn, or directly with a contact by e-Mail, Messenger, Whatsapp, Line..
Short link
Use the short link to share your document on Twitter or by text message (SMS)
HTML Code
Copy the following HTML code to share your document on a Website or Blog
QR Code to this page

This file has been shared publicly by a user of PDF Archive.
Document ID: 0000483400.