APAHE 2017 handout (PDF)
File information
Author: Anthony Losongco
This PDF 1.5 document has been generated by Microsoft® Word 2016, and has been sent on pdf-archive.com on 01/04/2017 at 19:18, from IP address 67.181.x.x.
The current document download page has been viewed 466 times.
File size: 1.46 MB (6 pages).
Privacy: public file


File preview
USE OF DATA VISUALIZATION TOOLS TO UNDERSTAND
AND ADVOCATE FOR UNDERREPRESENTED
ASIAN PACIFIC AMERICAN GROUPS
Asian Pacific Americans in Higher Education (APAHE) Conference • Oakland, CA • April 7, 2017
TONY LOSONGCO, Academic Support Specialist, Learning Center
YOSHIKO TAKAHASHI, Ph.D., Associate Professor, Department of Criminology
BACKGROUND
Over 1 million Asian Pacific Islander (API) students in college
Overall, API young adults have high rates of college enrollment and graduation
In the past 20 years, national-level data have revealed differences within API
o Differences between Asians and Pacific Islanders in college enrollment and graduation rates
o Enrollment reporting for only Asian subgroups
TIMELINE
❶
1997
❷
❸
2002
2007
❹
❺
2012
2017
❶ U.S. Office of Management and Budget (OMB) revises standards for race/ethnicity categories
❷ U.S. Census Bureau starts collecting/reporting data on 25 Asian and 24 Pacific Islander subgroups
❸ U.S. Department of Education issues final guidance to implement 1997 OMB standards
❹ 23-campus California State University (CSU) lets applicants identify with racial/ethnic subgroups
❺ California Government Code 8310.5 specifies a minimum of eight Asian and three Pacific Islander
subgroups for state collection of demographic data
API SUBGROUPS: Nationwide
These word clouds display the API subgroups reported by the U.S. Census Bureau, with the largest words
representing the most populous subgroups in the 2010 census.
Asian subgroups by 2010 U.S. population
Pacific Islander subgroups by 2010 U.S. population
Who is not represented in these API subgroups?
Middle Easterners and some Central Asian groups (e.g., Armenians) have typically been categorized as
“White.”
Some groups from India with distinct culture and language (e.g., Punjabi) are aggregated in the Asian
Indian subgroup.
Use of Data Visualization Tools to Understand and Advocate for Underrepresented Asian Pacific American Groups
API SUBGROUPS: Fresno State
Fresno State is a CSU campus, a Hispanic-Serving Institution (HSI), and an Asian American and Native
American Pacific Islander-Serving Institution (AANAPISI) in a region whose API population is mostly Southeast
Asian.
These word clouds display the API subgroups represented at Fresno State, with the largest words representing
the largest Fall 2016 enrollment. Notice how these word clouds look different from the word clouds on the
previous page for the overall U.S. API population:
Asian subgroups by Fall 2016 Fresno State enrollment
Pacific Islander subgroups by Fall 2016 Fresno State enrollment
How do we know this about Fresno State enrollment?
Disaggregation informs Fresno State about its API subgroups. Fresno State uses Tableau data visualization
software to produce interactive online dashboards that publicly report API subgroup enrollment.
These tables are adapted from a Race/Ethnicity Detail dashboard publicly available from Fresno State’s Office
of Institutional Effectiveness:
Asian subgroup enrollment at Fresno State,
Fall 2016
Pacific Islander subgroup enrollment at
Fresno State, Fall 2016
The dashboard reveals that
Hmong students, with a
headcount of 1,501, were 6.2%
of the overall university
enrollment in Fall 2016; the
next largest API subgroup,
Asian Indian, was 1.9% of
overall enrollment, with 459
students.
2
Use of Data Visualization Tools to Understand and Advocate for Underrepresented Asian Pacific American Groups
STUDENT SUCCESS: API Subgroups at Fresno State
Disaggregation has enabled Fresno State to calculate and analyze key measures of student success for API
subgroups. The following are three key student success rates of full-time, first-time freshmen (FTFTF)
universitywide, aggregated since the Fall 2009 entering cohort:
1-Year Retention
4-Year Graduation
6-Year Graduation
83.2%
15.6%
57.5%
The student success data universitywide and for a variety of subgroups are reported to campus users via
Tableau online interactive dashboards.
These two views, from a Fresno State dashboard on persistence and graduation, compare the one-year
retention, four-year graduation, and six-year graduation rates of FTFTF, for the university vs. all API students:
UNIVERSITYWIDE
ALL API
Why are the API graduation rates lower than the university rates?
Even though API FTFTF entered Fresno State with a higher high school GPA than the university overall (3.44
vs. 3.35), they had lower first-term GPA, 1-year retention, and graduation rates. Why?
There is wide variation in student success among API subgroups.
About 50% of all API FTFTF at Fresno State are Hmong, a historically underrepresented population in
higher education compared to other API subgroups such as Asian Indian.
Across multiple cohorts since Fall 2009, Hmong FTFTF had lower retention and graduation rates than the
university overall. Conversely, Asian Indian FTFTF had higher rates in these measures of student success
compared to the university.
The following two views, from the same dashboard, compare the one-year retention, four-year graduation, and
six-year graduation rates of FTFTF, for Hmong vs. Asian Indian students:
3
Use of Data Visualization Tools to Understand and Advocate for Underrepresented Asian Pacific American Groups
HMONG
ASIAN INDIAN
Why do you think the API subgroup student success rates are so different?
We may not immediately know the reasons why API subgroups at a specific institution have different rates of
student success. However, disaggregation and the use of data visualization tools can be combined with our
qualitative knowledge of a campus community to develop data-driven decisions that benefit student
populations throughout the institution.
DATA VISUALIZATION TOOLS
Advantages
Data are displayed to help users understand
and advocate for historically underrepresented
API groups
Dashboards can further disaggregate API
subgroup data by other variables (e.g., gender,
first-generation status)
Dashboards are built in-house with
commercially available Tableau software that
connects to data in Excel, Access, Qualtrics,
and other programs
Campus and community users can navigate
dashboards with little or no training
Applications
Culturally sensitive student interventions
(academic, personal, social)
Campus conversations about equity and
advocacy (whether to disaggregate, which
groups to disaggregate)
Grant applications
Outreach to prospective students and families
Community outreach and partnerships
QUESTIONS OF EQUITY AND ADVOCACY
1. What are the disaggregation guidelines of your campus, system, or state government?
2. Which API subgroups do you disaggregate?
3. How do the disaggregated API subgroups align with the population of your region?
4. Is any API group not represented properly?
5. What types of data do you report for disaggregated API subgroups?
6. How do student success rates for a disaggregated API subgroup compare to other subgroups? To other
races? To the campus at large?
7. How will your campus address any achievement and opportunity gaps revealed by disaggregation?
8. Who is prepared to address these gaps?
4
Use of Data Visualization Tools to Understand and Advocate for Underrepresented Asian Pacific American Groups
CASE STUDY
Research by Gong, Kubo, and Takahashi (2014) led to the launch of an Action Research Project at Fresno
State, funded by a CSU Chancellor’s Office grant. Disaggregated API subgroup data identified Southeast
Asian FTFTF who were invited to join Supporting Southeast Asian Student Success (SSASS). A 2015 SSASS
cohort of 27 students participated in activities intended to increase Southeast Asian student success rates and
campus-student “fit,” including:
A three-day on-campus summer orientation
Mentoring from a Peer Navigator who met with
SSASS participants weekly
A tablet-based course called “Writing for College
Success”
Student development workshops on leadership,
financial management, and other topics
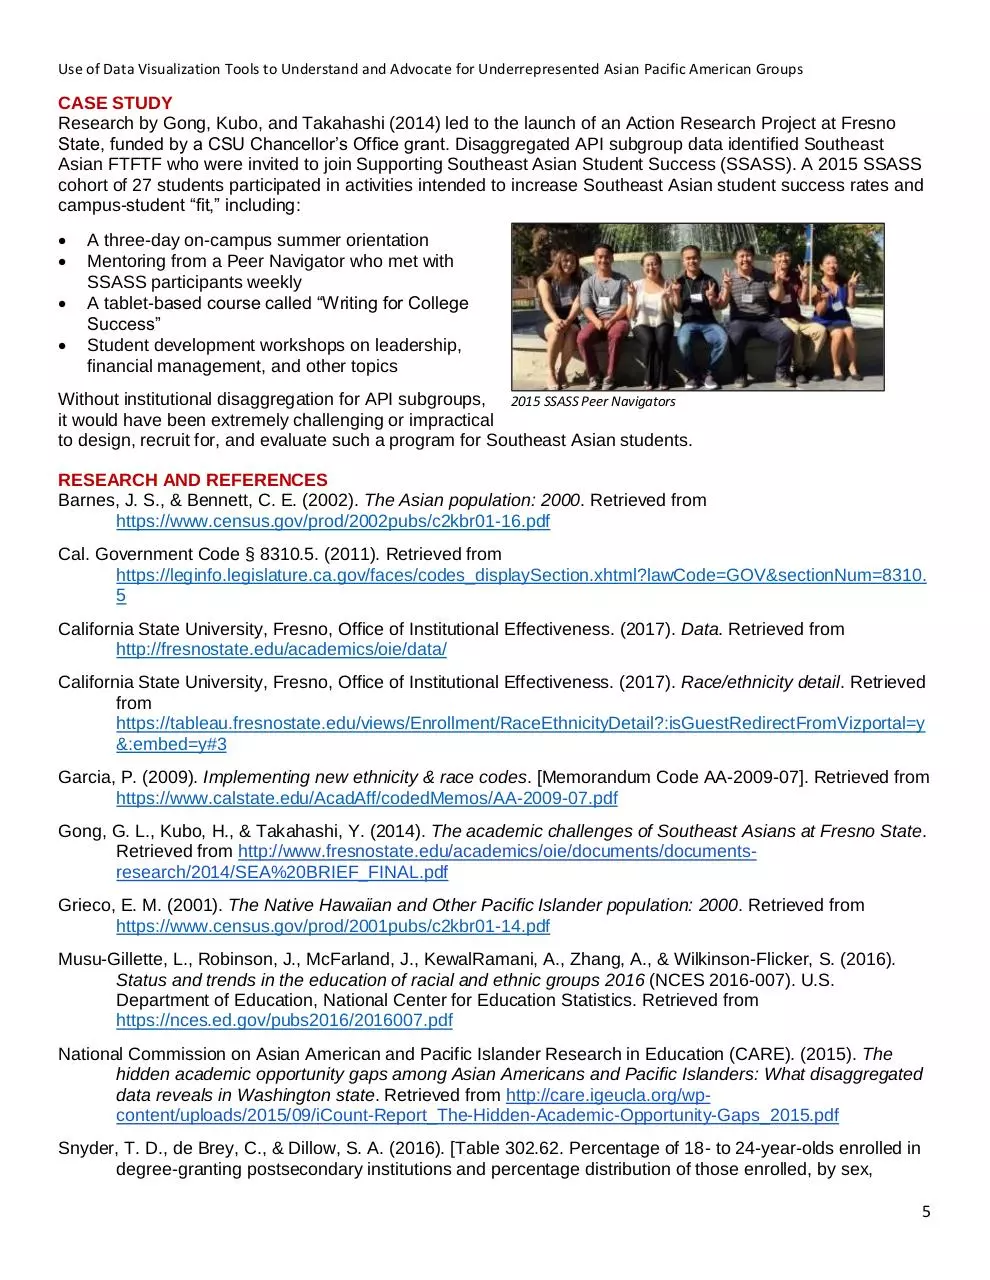
Without institutional disaggregation for API subgroups, 2015 SSASS Peer Navigators
it would have been extremely challenging or impractical
to design, recruit for, and evaluate such a program for Southeast Asian students.
RESEARCH AND REFERENCES
Barnes, J. S., & Bennett, C. E. (2002). The Asian population: 2000. Retrieved from
https://www.census.gov/prod/2002pubs/c2kbr01-16.pdf
Cal. Government Code § 8310.5. (2011). Retrieved from
https://leginfo.legislature.ca.gov/faces/codes_displaySection.xhtml?lawCode=GOV&sectionNum=8310.
5
California State University, Fresno, Office of Institutional Effectiveness. (2017). Data. Retrieved from
http://fresnostate.edu/academics/oie/data/
California State University, Fresno, Office of Institutional Effectiveness. (2017). Race/ethnicity detail. Retrieved
from
https://tableau.fresnostate.edu/views/Enrollment/RaceEthnicityDetail?:isGuestRedirectFromVizportal=y
&:embed=y#3
Garcia, P. (2009). Implementing new ethnicity & race codes. [Memorandum Code AA-2009-07]. Retrieved from
https://www.calstate.edu/AcadAff/codedMemos/AA-2009-07.pdf
Gong, G. L., Kubo, H., & Takahashi, Y. (2014). The academic challenges of Southeast Asians at Fresno State.
Retrieved from http://www.fresnostate.edu/academics/oie/documents/documentsresearch/2014/SEA%20BRIEF_FINAL.pdf
Grieco, E. M. (2001). The Native Hawaiian and Other Pacific Islander population: 2000. Retrieved from
https://www.census.gov/prod/2001pubs/c2kbr01-14.pdf
Musu-Gillette, L., Robinson, J., McFarland, J., KewalRamani, A., Zhang, A., & Wilkinson-Flicker, S. (2016).
Status and trends in the education of racial and ethnic groups 2016 (NCES 2016-007). U.S.
Department of Education, National Center for Education Statistics. Retrieved from
https://nces.ed.gov/pubs2016/2016007.pdf
National Commission on Asian American and Pacific Islander Research in Education (CARE). (2015). The
hidden academic opportunity gaps among Asian Americans and Pacific Islanders: What disaggregated
data reveals in Washington state. Retrieved from http://care.igeucla.org/wpcontent/uploads/2015/09/iCount-Report_The-Hidden-Academic-Opportunity-Gaps_2015.pdf
Snyder, T. D., de Brey, C., & Dillow, S. A. (2016). [Table 302.62. Percentage of 18- to 24-year-olds enrolled in
degree-granting postsecondary institutions and percentage distribution of those enrolled, by sex,
5
Use of Data Visualization Tools to Understand and Advocate for Underrepresented Asian Pacific American Groups
race/ethnicity, and selected racial/ethnic subgroups: 2009 and 2014]. Digest of education statistics,
2015. Retrieved from https://nces.ed.gov/programs/digest/d15/tables/dt15_302.62.asp?current=yes
Snyder, T. D., de Brey, C., & Dillow, S. A. (2016). [Table 306.10. Total fall enrollment in degree-granting
postsecondary institutions, by level of enrollment, sex, attendance status, and race/ethnicity of student:
Selected years, 1976 through 2015]. Digest of education statistics, 2015. Retrieved from
https://nces.ed.gov/programs/digest/d16/tables/dt16_306.10.asp?current=yes
Snyder, T. D., de Brey, C., & Dillow, S. A. (2016). [Table 326.10. Graduation rate from first institution attended
for first-time, full-time bachelor’s degree-seeking students at 4-year postsecondary institutions, by
race/ethnicity, time to completion, sex, control of institution, and acceptance rate: Selected cohort entry
years, 1996 through 2008]. Digest of education statistics, 2015. Retrieved from
https://nces.ed.gov/programs/digest/d15/tables/dt15_326.10.asp?current=yes
Southeast Asia Resource Action Center. (2013). Moving beyond the “Asian” check box. Washington, DC:
Author. Retrieved from http://www.searac.org/sites/default/files/2013.06.13%20%20RFI%20Policy%20Brief%20-%20FINAL.pdf
U.S. Department of Education. (2007). Final guidance on maintaining, collecting, and reporting racial and
ethnic data to the U.S. Department of Education (FR Doc. E7-20613). Retrieved from
https://www.gpo.gov/fdsys/pkg/FR-2007-10-19/pdf/E7-20613.pdf
U.S. Office of Management and Budget. (1997). Revisions to the standards for the classification of federal data
on race and ethnicity (FR Doc. 97-28653). Retrieved from https://www.gpo.gov/fdsys/pkg/FR-1997-1030/pdf/97-28653.pdf
CREDITS
Asian Faculty and Staff Association (AFSA), Fresno State
Dashboards and data: Office of Institutional Effectiveness (OIE), Fresno State
Poster design: Marie Fernandez, OIE, Fresno State
6
Download APAHE 2017 handout
APAHE 2017 handout.pdf (PDF, 1.46 MB)
Download PDF
Share this file on social networks
Link to this page
Permanent link
Use the permanent link to the download page to share your document on Facebook, Twitter, LinkedIn, or directly with a contact by e-Mail, Messenger, Whatsapp, Line..
Short link
Use the short link to share your document on Twitter or by text message (SMS)
HTML Code
Copy the following HTML code to share your document on a Website or Blog
QR Code to this page

This file has been shared publicly by a user of PDF Archive.
Document ID: 0000577133.